. 2021 Jul 19:15:701355.
doi: 10.3389/fnins.2021.701355. eCollection 2021.

Altered Fecal Metabolites and Colonic Glycerophospholipids Were Associated With Abnormal Composition of Gut Microbiota in a Depression Model of Mice

Affiliations

Altered Fecal Metabolites and Colonic Glycerophospholipids Were Associated With Abnormal Composition of Gut Microbiota in a Depression Model of Mice

Xue Gong et al. Front Neurosci. .

Abstract

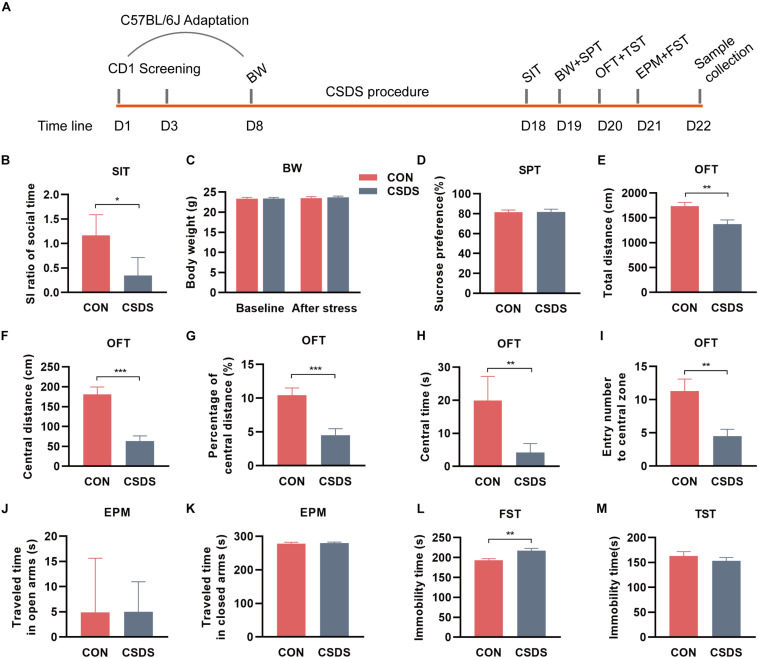
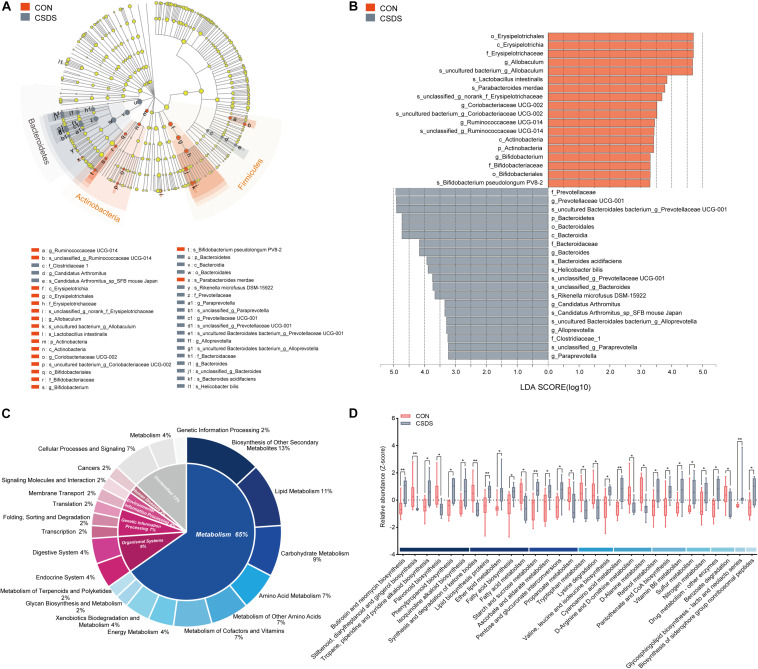
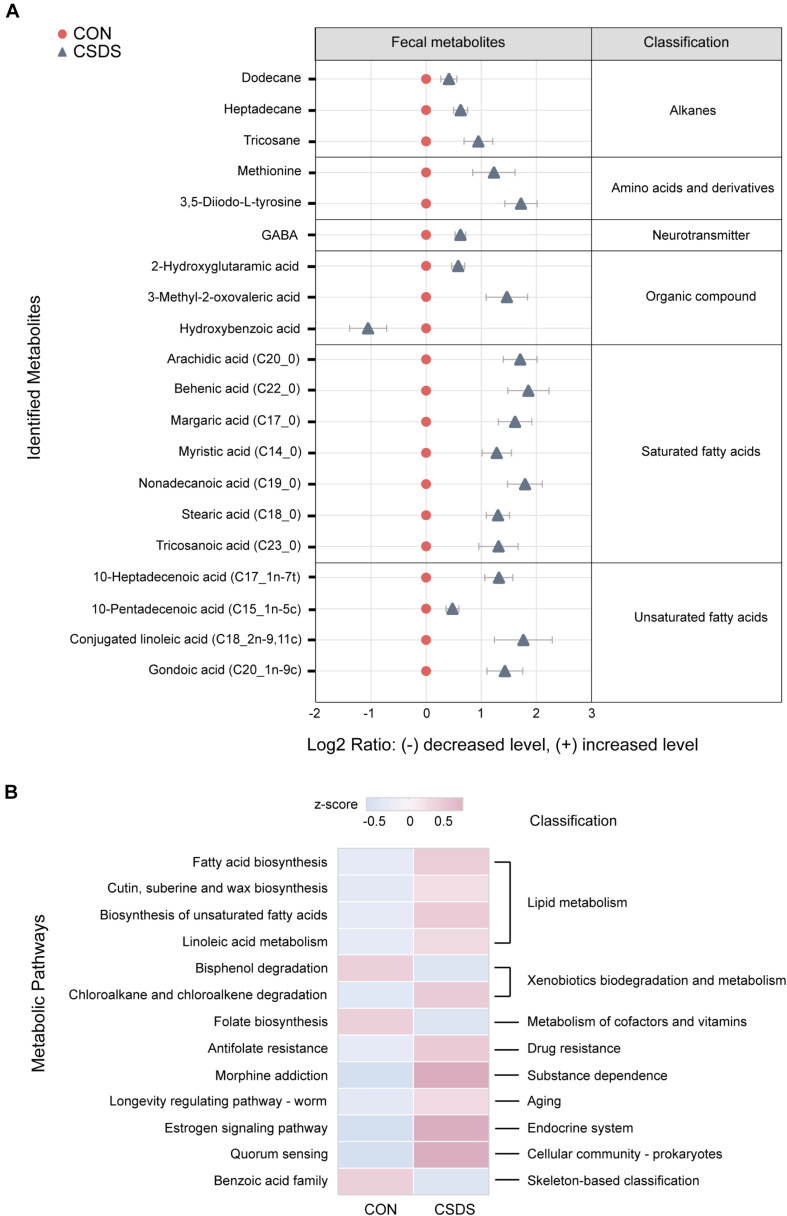
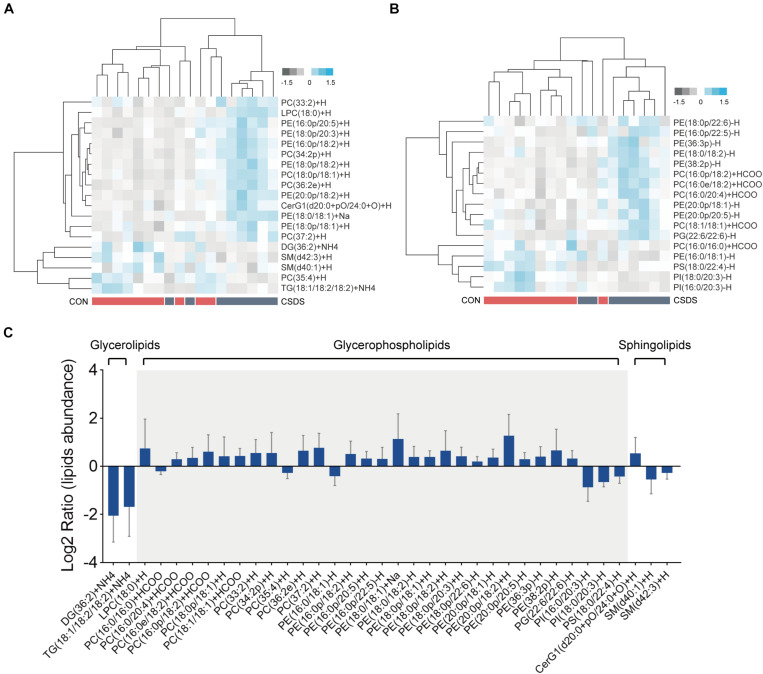
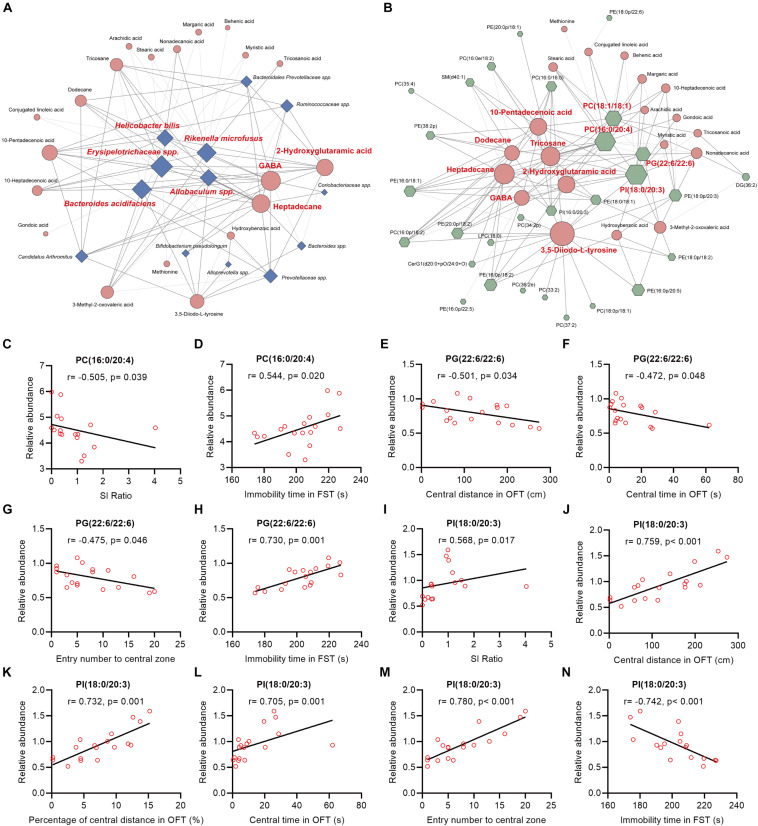
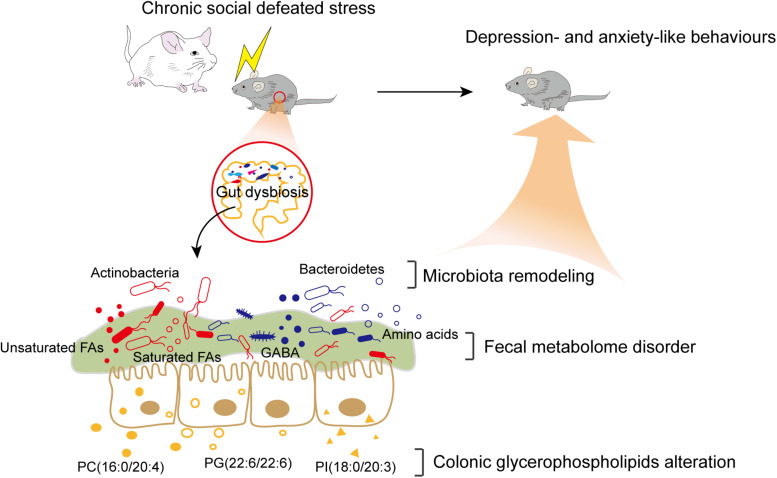
The microbiota-gut-brain axis has been considered to play an important role in the development of depression, but the underlying mechanism remains unclear. The gastrointestinal tract is home to trillions of microbiota and the colon is considered an important site for the interaction between microbiota and host, but few studies have been conducted to evaluate the alterations in the colon. Accordingly, in this study, we established a chronic social defeated stress (CSDS) mice model of depression. We applied 16S rRNA gene sequencing to assess the gut microbial composition and gas and liquid chromatography-mass spectroscopy to identify fecal metabolites and colonic lipids, respectively. Meanwhile, we used Spearman's correlation analysis method to evaluate the associations between the gut microbiota, fecal metabolites, colonic lipids, and behavioral index. In total, there were 20 bacterial taxa and 18 bacterial taxa significantly increased and decreased, respectively, in the CSDS mice. Further, microbial functional prediction demonstrated a disturbance of lipid, carbohydrate, and amino acid metabolism in the CSDS mice. We also found 20 differential fecal metabolites and 36 differential colonic lipids (in the category of glycerolipids, glycerophospholipids, and sphingolipids) in the CSDS mice. Moreover, correlation analysis showed that fecal metabolomic signature was associated with the alterations in the gut microbiota composition and colonic lipidomic profile. Of note, three lipids [PC(16:0/20:4), PG(22:6/22:6), and PI(18:0/20:3), all in the category of glycerophospholipids] were significantly associated with anxiety- and depression-like phenotypes in mice. Taken together, our results indicated that the gut microbiota might be involved in the pathogenesis of depression via influencing fecal metabolites and colonic glycerophospholipid metabolism.

Keywords: chronic social defeated stress; colonic lipids; fecal metabolome; glycerophospholipids; gut microbiota; microbiota–gut–brain axis.


Conflict of interest statement

The authors declare that the research was conducted in the absence of any commercial or financial relationships that could be construed as a potential conflict of interest.

Figures

FIGURE 1
FIGURE 1
Experimental schedule and assessments of behavior indices. (A) Schedule of the CSDS procedure. During the first week, C57BL/6J mice were kept in experimental cages for environmental adaptation, and meanwhile, CD1 mice underwent the screening process. After the adaptation, C57BL/6J mice in the CSDS group were subjected to 10 consecutive days of CSDS exposure. After 4 days of behavioral tests (SI, BW, SPT, OFT, and FST), all C57BL/6J mice were sacrificed. (B) SIT: Mice in the CSDS group showed a significantly lower SI ratio than those in the control group. (C) BW: No significant difference was observed at baseline or after social defeated stress. (D) SPT: No significant difference was observed between the CSDS and control groups. (E–I) OFT: Mice in the CSDS group showed a significantly reduced total distance, central distance, percentage of central distance, central time, and entry number to the central zone than those in the control group. (J,K) EPM: No significant difference was observed in the time traveling in open or closed arms. (L) FST: Mice in the CSDS group showed a significantly increased immobility time than the control group. (M) TST: No significant difference was observed between the two groups. When the data conformed to normal distribution and homogeneity of variance, two-tail Student t-test was used and data are presented as mean ± SEM. Otherwise, the non-parametric Mann–Whitney U test was required and data are presented as median ± interquartile range (n = 10 mice in each group). *p < 0.05, **p < 0.01, ***p < 0.001, ns, no significance. CON, mice in the control group; CSDS, mice in the CSDS group.
FIGURE 2
FIGURE 2
Comparison of the gut microbiota composition and functional predictions of the altered gut microbiota between the control and CSDS mice. (A) Phylogenetic diagram of LEfSe analysis illustrated the differential gut microbiota composition between the control and CSDS mice from the phylum to species levels. At the phylum level, Bacteroidetes were significantly enriched in the CSDS mice, whereas Actinobacteria and Firmicutes were enriched in the control mice. (B) Histogram of LDA scores computed by LEfSe analysis revealed the most differentially abundant bacteria taxa in the control and CSDS mice belonged to order Erysipelotrichales and family Prevotellaceae, respectively. (C) PICRUSt functional prediction of the altered gut microbiota indicated that the metabolism category ranked the top, with a proportion of 65%. In the metabolism category, lipid metabolism, carbohydrate metabolism, and amino acid metabolism counted for 11%, 9%, and 7%, respectively. (D) Histogram of all the significantly dysregulated metabolic pathways in the metabolism category. Mann–Whitney U test, *p < 0.05, **p < 0.01. CON, mice in the control group; CSDS, mice in the CSDS group.
FIGURE 3
FIGURE 3
Identification and pathway analysis of differential fecal metabolites between the control and CSDS mice. (A) 20 fecal metabolites were identified to be significantly changed in the CSDS mice. Compared to the control mice, only one metabolite (hydroxybenzoic acid) was significantly decreased, whereas the other 19 metabolites were increased in the CSDS mice. (B) Pathway analysis for fecal metabolites based on KEGG database revealed that 13 pathways were disturbed in the CSDS mice, of which most (4/13) were involved in lipid metabolism. CON, mice in the control group; CSDS, mice in the CSDS group.
FIGURE 4
FIGURE 4
Differential lipids identified in the colon tissues between the control and CSDS mice. (A) Heatmaps of 19 differential lipids identified in the positive mode and (B) 17 differential lipids identified in the negative mode. (C) These differential lipids belonged to glycerolipids, glycerophospholipids, and sphingolipids categories, of which most (31/36) were glycerophospholipids. CON, mice in the control group; CSDS, mice in the CSDS group.
FIGURE 5
FIGURE 5
Spearman’s correlations between the differential bacteria species, fecal metabolites, colonic lipids, and behavior indices. (A,B) The network maps illustrated correlations between the differential bacteria species and fecal metabolites, and between the differential fecal metabolites and colonic lipids, respectively. Blue nodes represent bacteria species; orange nodes represent fecal metabolites; and green nodes represent colonic lipids. Edges between nodes represent Spearman’s correlation. The node size corresponds to the number of correlations, that is, a larger node for bacteria taxa indicates it linked to more fecal metabolites. Nodes (the number of correlations over or equal to 10) were marked in red. The edge width corresponds to correlation coefficient. (C–N) The correlation analysis between PC(16:0/20:4), PG(22:6/22:6), PI(18:0/20:3), and behavioral index, respectively.
FIGURE 6
FIGURE 6
Brief summary of the study. CSDS induced gut microbiota remodeling and alterations of the fecal metabolome and colonic lipidome in C57BL/6J mice. The interactions among differential bacteria taxa, fecal metabolites, and colonic lipids might contribute to the potential mechanism of the MGB axis in the pathogenesis of depression.

Similar articles

Cited by

References

    1. Ahmmed M. K., Ahmmed F., Tian H. S., Carne A., Bekhit A. E. (2020). Marine omega-3 (n-3) phospholipids: a comprehensive review of their properties, sources, bioavailability, and relation to brain health. Compr. Rev. Food Sci. Food Saf. 19 64–123. 10.1111/1541-4337.12510 - DOI - PubMed
    1. Akkasheh G., Kashani-Poor Z., Tajabadi-Ebrahimi M., Jafari P., Akbari H., Taghizadeh M., et al. (2016). Clinical and metabolic response to probiotic administration in patients with major depressive disorder: a randomized, double-blind, placebo-controlled trial. Nutrition 32 315–320. 10.1016/j.nut.2015.09.003 - DOI - PubMed
    1. Boonstra E., de Kleijn R., Colzato L. S., Alkemade A., Forstmann B. U., Nieuwenhuis S. (2015). Neurotransmitters as food supplements: the effects of GABA on brain and behavior. Front. Psychol. 6:1520. 10.3389/fpsyg.2015.01520 - DOI - PMC - PubMed
    1. Burokas A., Arboleya S., Moloney R. D., Peterson V. L., Murphy K., Clarke G., et al. (2017). Targeting the Microbiota-Gut-Brain Axis: prebiotics Have Anxiolytic and Antidepressant-like Effects and Reverse the Impact of Chronic Stress in Mice. Biol. Psychiatry 82 472–487. 10.1016/j.biopsych.2016.12.031 - DOI - PubMed
    1. Chen H., Xie H., Huang S., Xiao T., Wang Z., Ni X., et al. (2020). Development of mass spectrometry-based relatively quantitative targeted method for amino acids and neurotransmitters: applications in the diagnosis of major depression. J. Pharm. Biomed. Anal. 194:113773. 10.1016/j.jpba.2020.113773 - DOI - PubMed