. 2021 Jul 19:15:687306.
doi: 10.3389/fncel.2021.687306. eCollection 2021.

The Structural E/I Balance Constrains the Early Development of Cortical Network Activity

Affiliations

The Structural E/I Balance Constrains the Early Development of Cortical Network Activity

Wenxi Xing et al. Front Cell Neurosci. .

Abstract

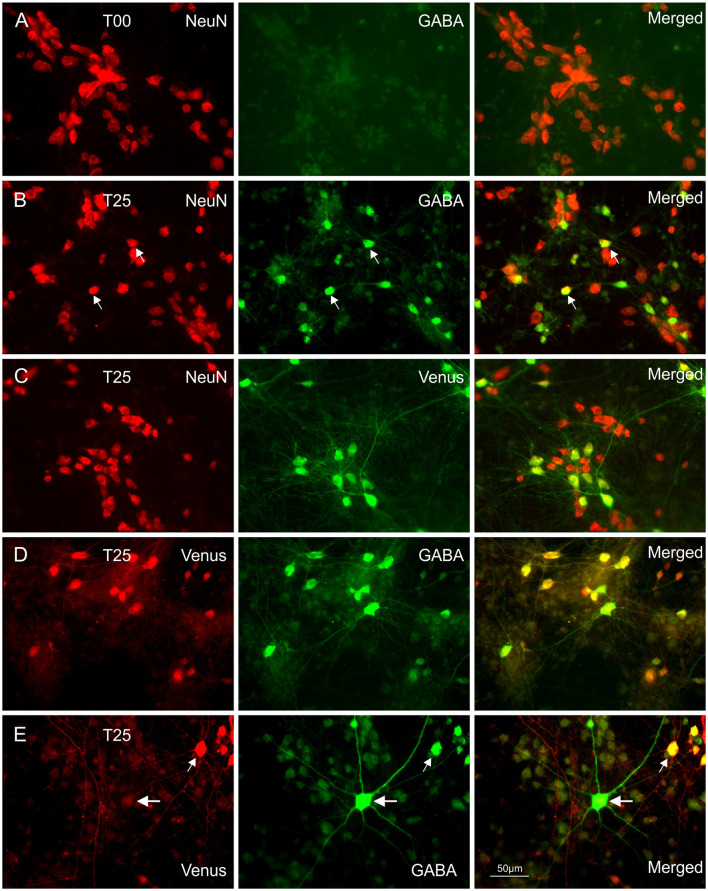
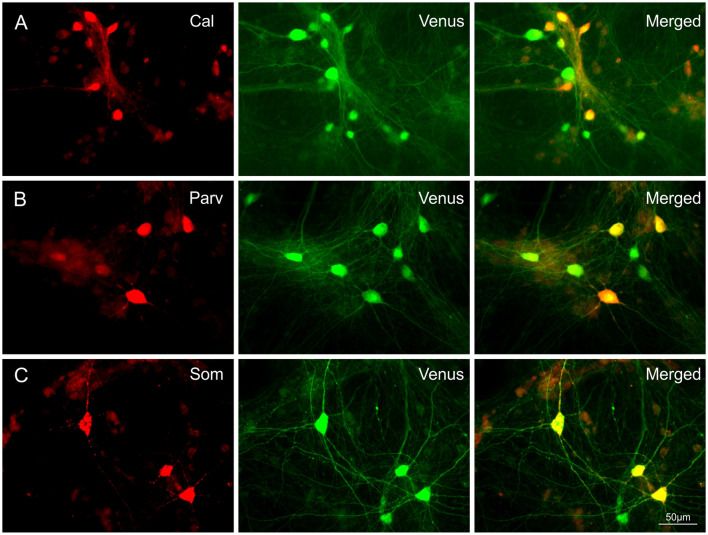
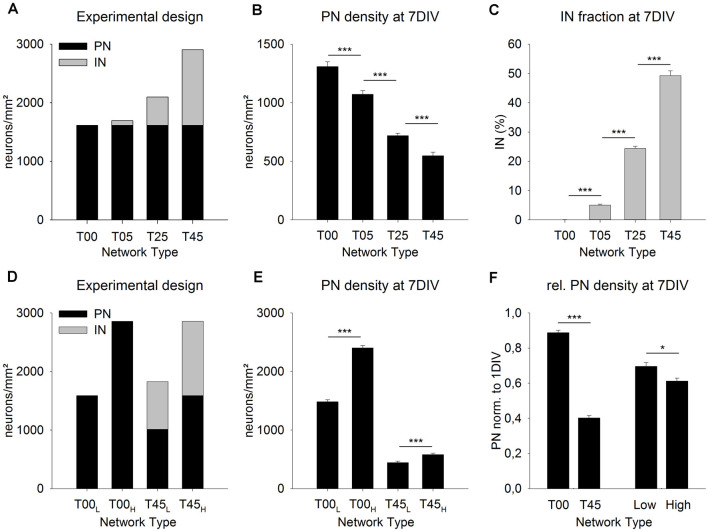
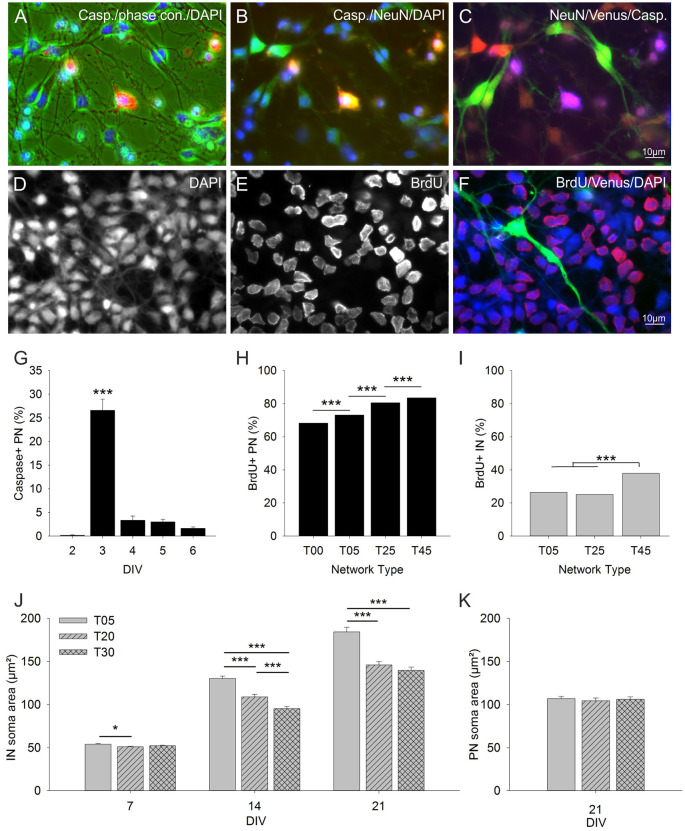
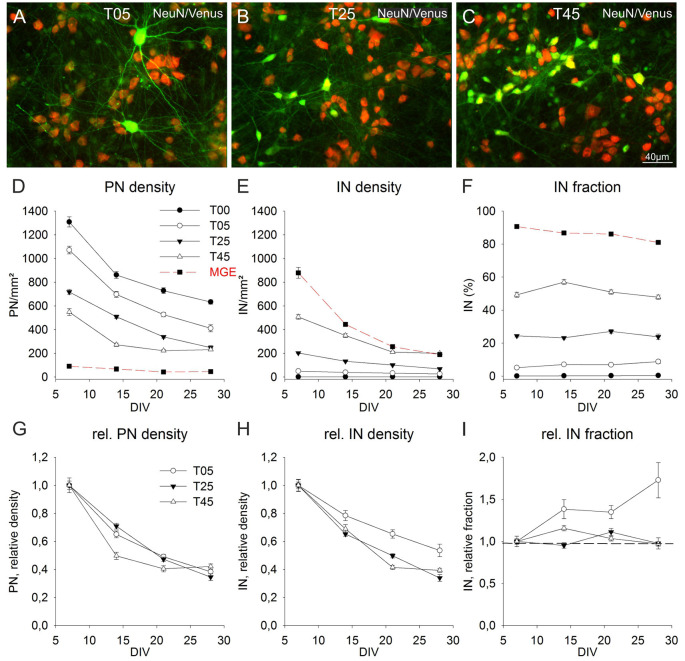
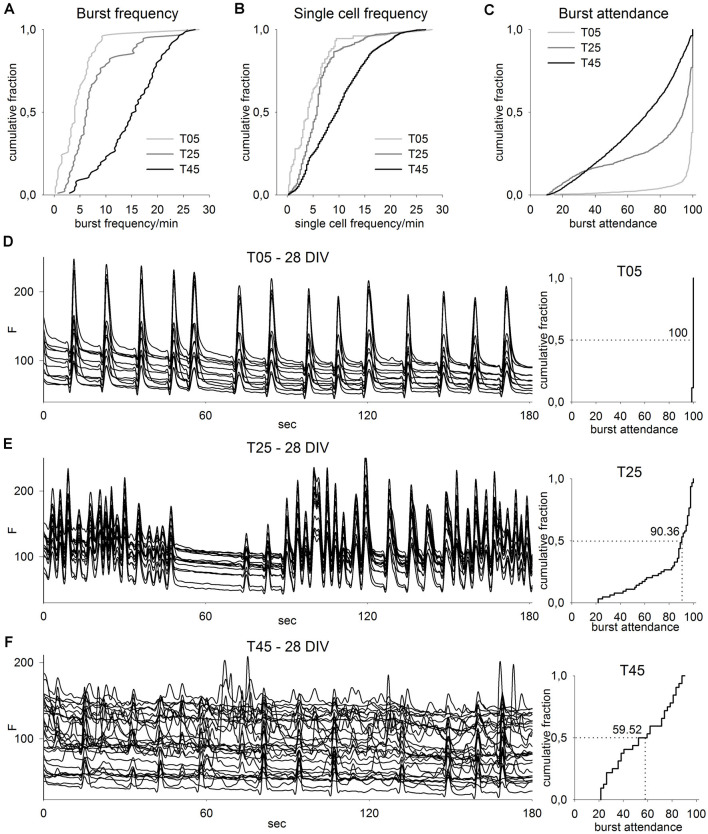
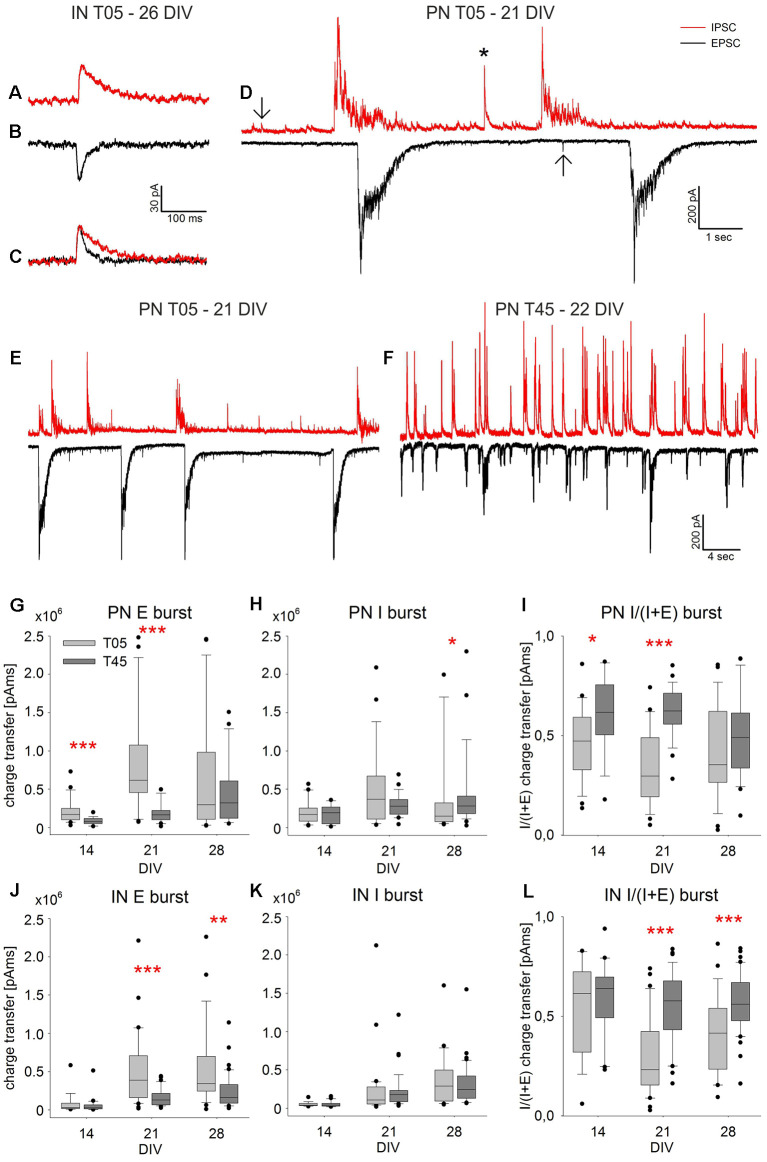
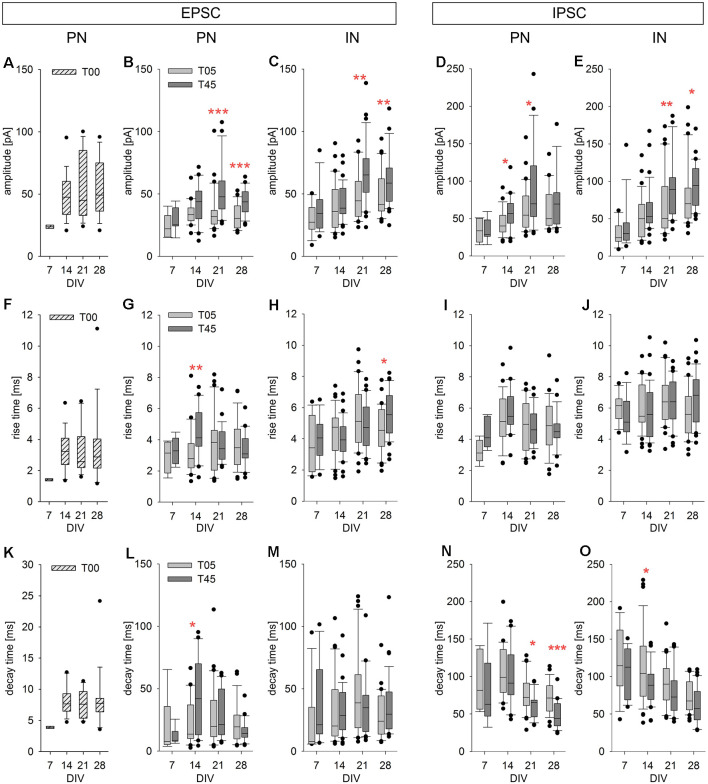
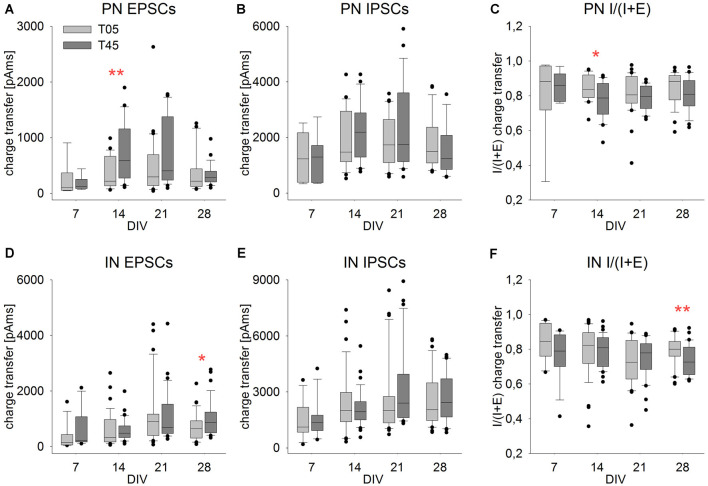
Neocortical networks have a characteristic constant ratio in the number of glutamatergic projection neurons (PN) and GABAergic interneurons (IN), and deviations in this ratio are often associated with developmental neuropathologies. Cultured networks with defined cellular content allowed us to ask if initial PN/IN ratios change the developmental population dynamics, and how different ratios impact the physiological excitatory/inhibitory (E/I) balance and the network activity development. During the first week in vitro, the IN content modulated PN numbers, increasing their proliferation in networks with higher IN proportions. The proportion of INs in each network set remained similar to the initial plating ratio during the 4 weeks cultivation period. Results from additional networks generated with more diverse cellular composition, including early-born GABA neurons, suggest that a GABA-dependent mechanism may decrease the survival of additional INs. A large variation of the PN/IN ratio did not change the balance between isolated spontaneous glutamatergic and GABAergic postsynaptic currents charge transfer (E/I balance) measured in PNs or INs. In contrast, the E/I balance of multisynaptic bursts reflected differences in IN content. Additionally, the spontaneous activity recorded by calcium imaging showed that higher IN ratios were associated with increased frequency of network bursts combined with a decrease of participating neurons per event. In the 4th week in vitro, bursting activity was stereotypically synchronized in networks with very few INs but was more desynchronized in networks with higher IN proportions. These results suggest that the E/I balance of isolated postsynaptic currents in single cells may be regulated independently of PN/IN proportions, but the network bursts E/I balance and the maturation of spontaneous network activity critically depends upon the structural PN/IN ratio.

Keywords: cell culture; cerebral cortex; cortical network; development; gamma-aminobutyric acid; interneurons; projection neurons.


Conflict of interest statement

The authors declare that the research was conducted in the absence of any commercial or financial relationships that could be construed as a potential conflict of interest.

Figures

Figure 1
Figure 1
Immunocytochemical double staining for co-localization of NeuN with GABA or Venus. Images in (A) show a NeuN/GABA double-stained culture obtained from dissociated embryonic rat wild-type dorsal cortices (dCtx) at E16 (T00 network). In this network type, the vast majority of neurons were pyramidal neurons (PNs). Images in (B) show a NeuN/GABA double-stained wild-type dCtx with 25% Venus MGE-INs (T25: MGE-INs from transgenic vGAT Venus rats). Arrows point to two strongly positive NeuN/GABA neurons. (C) Images of a NeuN/Venus double-stained T25 culture show the vGAT-Venus expressing MGE-INs. (D) Images of a double-stained T25 culture show the GABA co-localization in Venus expressing neurons. (E) Images of a Venus/GABA double-stained T25 culture show one example of the rare Venus negative INs found in very low density in dCtx cultures (large arrows). The double-labeled Venus/GABA expressing neurons (small arrows) were of MGE origin (MGE-INs) from E14 transgenic animals. All images in (A–E) show 14-day-old cultures.
Figure 2
Figure 2
Co-expression of Calretinin (Cal), Parvalbumin (Parv), or Somatostatin (Som) in Venus expressing neurons. Images show the co-localization of Cal (A), Parv (B) or Som (C) with Venus in neurons of 28-day-old T25 networks. Differences in soma size between Figures 1 and 2 are due to age differences of the cultures at the time of fixation.
Figure 3
Figure 3
MGE-INs modulate the density of PNs during the 1st week in vitro. Networks with increasing MGE-IN content were generated by plating dissociated MGE-INs (A, gray bars, 1 DIV) on cortical networks with the same density of PNs (A, black bars). After 7 DIV the projection neurons (PN) density was highest in T00 and lowest in T45 networks (B). The PN/IN ratio did not change during the 1st week in vitro (C). (D) Network pairs with no MGE-INs (T00) or high MGE-IN content (T45) were generated with low (L) or high (H) total cell density. (E) The much higher loss of PNs in T45L and T45H networks showed that PN density during the 1st week was predominantly dependent on IN density rather than on total cell density. (F) For statistical comparison, the data was normalized to 1 DIV values and pooled in four groups (see “Results” Section). This analysis showed that the presence of INs (T00 vs. T45) had a larger effect on PN density decline than total cell density (Low vs. High). Asterisks show the level of statistical significance (*P ≤ 0.05, ***P ≤ 0.001).
Figure 4
Figure 4
Influence of IN density on PN cell death and cell proliferation rates. The images in (A–C) show three RGB channel combinations of the five black and white micrographs taken with different illumination from an exemplary field of an anti-Caspase stained T25 network at 3 DIV (quantitative data in graph G). (A) caspase (red), phase contrast (green), DAPI (blue). (B) Caspase (red), NeuN (green), DAPI (blue). (C) NeuN (red), Venus (green), caspase (blue). Panels (D–F) show an exemplary field of a BrdU staining in a T25 network 24 h after BrdU application (quantitative data in graphs H and I). (D) DAPI, (E) BrdU, (F) color combined BrdU (red), Venus (green), DAPI (blue). (G) Graph shows the fraction of anti-Caspase positive PNs in T25 networks between 2–6 DIV. The number of caspase positive PNs increased drastically 24 h after the addition of the mitotic inhibitor Ara-C at 2 DIV and dropped to low values afterward. (H) Fraction of anti-BrdU positive PNs in different network types between 2–3 DIV (standard AraC treatment was replaced by BrdU at 2 DIV and proliferation rates were assessed 12 and 24 h later; see “Materials and Methods” section). The number of proliferating PNs increased with increasing IN content. (I) Fraction of anti-BrdU positive INs. Only T45 networks showed a significant increase in IN proliferation rates. Panels (J,K) show the analysis of IN and PN soma size in T05, T20, and T30 networks. (J) IN soma size was largest in networks with the lowest IN density (T05) and decreased with increasing IN density (T20, T30). PNs soma size did not vary with IN content (K). Asterisks show the level of statistical significance (*P ≤ 0.05, ***P ≤ 0.001). For n values see “Materials and Methods”, for statistics, see “Results” Section.
Figure 5
Figure 5
Long-term population dynamics in different network types. Panels (A–C) show the color combined images of the Venus (green) and NeuN (red) staining in exemplary fields of 14-day-old T05 (A), T25 (B), and T45 (C) dCtx networks. The networks differ in their Venus neuron density. The quantitative analysis of the apparent soma size differences of Venus neurons between the different network types is shown in Figure 4 (J,K). (D–F) Graphs show the development of PN (D) and IN (E) densities, and the fraction of INs (F) between 7 and 28 DIV. For better comparison, the data of T05, T25, and T45 networks were normalized to 7 DIV and are shown in (G–I). The dotted line in graph (I) shows the normalized 7 DIV value for reference. For MGE networks in (D, red dashed line) non-GABA neuron density is shown instead of the PN density.
Figure 6
Figure 6
Cellular composition of dCtx and wCtx networks during maturation. The graph in (A) shows the MGE-IN fraction of T00 networks derived either from the dorsal cortex (dCtx) or whole cortex (wCtx) of wild-type E16 rat embryos. In (B–D) the MGE-INs fraction of dCtx and wCtx networks is shown for T05 (B), T25 (C), and T45 (D) cultures. On wCtx the fraction of MGE-INs declined with age in all cases, while on dCtx it increased in T05, but remained stable in T25, T45 network types. (E–H) The values normalized to 7 DIV allow to compare the population dynamics of PN (E), IN (F), and %IN (G) in wCtx T05, T25, and T45 cultures. The faster decline in the IN fraction (E–G) was abolished in the presence of the GABA antagonist Gabazine (H). Dotted lines in (B–D) show the normalized 7 DIV value for reference.
Figure 7
Figure 7
Calcium imaging analysis of different network types. (A–C) CDF graphs show the imaging results of T05, T25, and T45 network recordings. With increasing MGE-IN content, network burst frequency (A) and single-cell burst frequency (B) increased but burst attendance (C) decreased (T05: n = 82, T25: n = 90, T45: n = 87; numbers correspond to the sum of data from 10 recorded fields in each of three cultures between ages 14 and 28 DIV from each of three independent experiments). (D–F) Imaging traces from exemplary fields of T05 (D), T25 (E), and T45 (F) networks (left, 28 DIV) show for clarity only 3 min of the recording time and a reduced number of traces. The corresponding CDF plots of burst attendance (right) are calculated from the background-corrected dF/F0 values (see “Materials and Methods” section) and include the data of the entire 4 min record and all active neurons within the fields. The median of the burst attendance (number of neurons participating in a burst) is shown in each plot.
Figure 8
Figure 8
Spontaneous PSC Bursts. The exemplary spontaneous IPSCs (A) and EPSCs (B) were recorded in an IN (T05, 26 DIV). The slower decay time of inhibitory currents is visualized by scaling the PSCs shown in (A,B) to the same amplitude (C). The examples of single isolated PSCs (D, arrows), a short multisynaptic event (D, asterisk), and large network bursts (D) were recorded in a PN (T05, 21 DIV). While isolated PSCs are single synaptic events (A–C, arrows in D), network bursts of large amplitude (D) are elicited by a barrage of synaptic inputs over several 100 ms. Panels (E,F) show exemplary traces illustrating the difference between spontaneous burst currents in PNs of T05 (E, 21 DIV) and T45 networks (F, 22 DIV). The quantitative analysis of network burst charge transfer is shown in (G–L). For both neuron types, EPSC burst charge transfer increased in the 3rd week, most prominently in T05 (G–J), while the increase of IPSC burst charge transfer was less pronounced (H–K). As a consequence, the burst charge transfer ratio [I/(I + E)] was lower in T05 compared with T45 networks (I,L) reflecting the lower synaptic inhibitory drive in both neuron types of T05 networks (see also: E,F). Asterisks show the level of statistical significance of differences between network types (*P ≤ 0.05, **P ≤ 0.01, ***P ≤ 0.001). For statistical significance of age differences, see text.
Figure 9
Figure 9
Developmental changes of isolated spontaneous PSCs in PNs and INs. The spontaneous postsynaptic currents analyzed for this and the next figure (see also Table 2) were isolated events during the interburst interval (see examples in Figure 8D, arrows). The box plots show the developmental changes of PSC amplitude (A–E), rise time (F–J), and decay time (K–O) for EPSCs [PNs (T00: A,F,K; T05 and T45: B,G,L); INs (C,H,M)] and IPSCs [PNs (D,I,N); INs (E,J,O)]. T00: hatched boxes; T05: light gray boxes; T45: dark gray boxes. Asterisks indicate significant differences between network types (*P ≤ 0.05, **P ≤ 0.01, ***P ≤ 0.001). For the number of cells and statistically significant age differences, see Table 2.
Figure 10
Figure 10
Isolated PSCs charge transfer ratio showed little variation in development and between networks. Graphs show the development of the single events PSC charge transfer and charge transfer ratio [I/(I + E)] in PNs (A–C) and INs (D–F) in T05 (light gray boxes) and T45 (dark gray boxes) networks over time. Compared with network bursts (Figures 8G–L), single PSCs charge transfer differed considerably less over age and between network types. Asterisks indicate significant differences between network types (*P ≤ 0.05, **P ≤ 0.01). For the number of cells and statistically significant age differences see Table 2.

Similar articles

Cited by

References

    1. Andang M., Hjerling-Leffler J., Moliner A., Lundgren T. K., Castelo-Branco G., Nanou E., et al. . (2008). Histone H2AX-dependent GABA(A) receptor regulation of stem cell proliferation. Nature 451, 460–464. 10.1038/nature06488 - DOI - PubMed
    1. Anderson S. A., Baraban S. C. (2012). “Cell therapy using GABAergic neural progenitors,” in Jasper’s Basic Mechanisms of the Epilepsies, eds Noebels J. L., Avoli M., Rogawski M. A., Olsen R. W., Delgado-Escueta A. V., 4th Edn., (Bethesda, MD: National Center for Biotechnology Information (US)), 1–7. - PubMed
    1. Ansen-Wilson L. J., Lipinski R. J. (2017). Gene-environment interactions in cortical interneuron development and dysfunction: a review of preclinical studies. Neurotoxicology 58, 120–129. 10.1016/j.neuro.2016.12.002 - DOI - PMC - PubMed
    1. Antonopoulos J., Pappas I. S., Parnavelas J. G. (1997). Activation of the GABA(A) receptor inhibits the proliferative effects of bFGF in cortical progenitor cells. Eur. J. Neurosci. 9, 291–298. 10.1111/j.1460-9568.1997.tb01399.x - DOI - PubMed
    1. Baker R. E., Corner M. A., Van P. J. (2006). Spontaneous neuronal discharge patterns in developing organotypic mega-co-cultures of neonatal rat cerebral cortex. Brain Res. 1101, 29–35. 10.1016/j.brainres.2006.05.028 - DOI - PubMed

LinkOut - more resources