. 2021 Jul 19:15:677688.
doi: 10.3389/fnsys.2021.677688. eCollection 2021.

Shifts in Estimated Preferred Directions During Simulated BMI Experiments With No Adaptation

Affiliations

Shifts in Estimated Preferred Directions During Simulated BMI Experiments With No Adaptation

Miri Benyamini et al. Front Syst Neurosci. .

Abstract

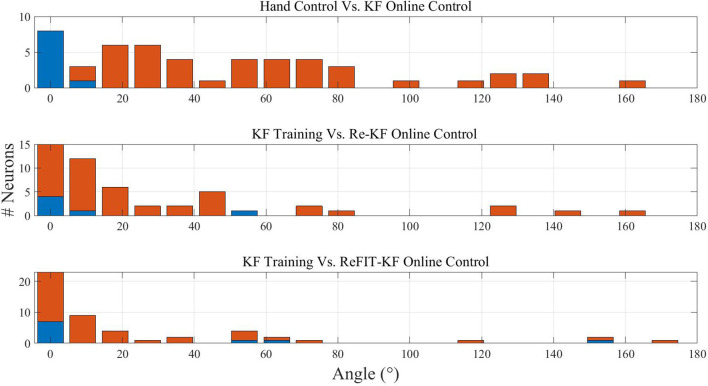
Experiments with brain-machine interfaces (BMIs) reveal that the estimated preferred direction (EPD) of cortical motor units may shift following the transition to brain control. However, the cause of those shifts, and in particular, whether they imply neural adaptation, is an open issue. Here we address this question in simulations and theoretical analysis. Simulations are based on the assumption that the brain implements optimal state estimation and feedback control and that cortical motor neurons encode the estimated state and control vector. Our simulations successfully reproduce apparent shifts in EPDs observed in BMI experiments with different BMI filters, including linear, Kalman and re-calibrated Kalman filters, even with no neural adaptation. Theoretical analysis identifies the conditions for reducing those shifts. We demonstrate that simulations that better satisfy those conditions result in smaller shifts in EPDs. We conclude that the observed shifts in EPDs may result from experimental conditions, and in particular correlated velocities or tuning weights, even with no adaptation. Under the above assumptions, we show that if neurons are tuned differently to the estimated velocity, estimated position and control signal, the EPD with respect to actual velocity may not capture the real PD in which the neuron encodes the estimated velocity. Our investigation provides theoretical and simulation tools for better understanding shifts in EPD and BMI experiments.

Keywords: BMI filter; brain-machine interfaces; neural encoding; neural modulations; preferred direction; shifts in preferred direction.


Conflict of interest statement

The authors declare that the research was conducted in the absence of any commercial or financial relationships that could be construed as a potential conflict of interest.

Figures

Figure 1
Figure 1
Schematic model of movement control during BMI experiments under the hypothesis that the brain implements optimal observer and controller. The neurons are assumed to encode the estimated state x^k|k and control signal, uk, in time step k. The cumulative bin rate Γk is a linear combination of the encoded signals (including the estimated speed and the magnitude of the control signal). The spike-count Nk is generated as a doubly stochastic Poisson process (DSPP) given Γk. The control signal is corrupted by hand process noise ξu. The brain model receives noisy proprioceptive yP and visual yV measurements from the hand and cursor, corrupted by proprioceptive and visual measurement noise, ωP and ωV, respectively.
Figure 2
Figure 2
Velocity tuning of a recorded M1 unit (upper panels) and a simulated M1-like unit (lower panels) in different lags and stages demonstrating shifts in estimated PDs after switching from pole control (PC, top) to brain control with hand movements (BC-WHM, middle) or without hand movements (BC-WO-HM, bottom). Color plots of the mean spike-count (in bins of 100 ms) as a function of Vx (x-axis) and Vy (y-axis) in cm/s. Different color code for each panel. Estimated PDs at −100 ms are marked by black arrows, while actual PDs in simulations are marked by red arrows.
Figure 3
Figure 3
Histograms of the magnitude of EPD shifts at −100 ms lag between different stages of BMI experiments for 56 recorded M1 units (A), 25 simulated M1-like units (B), 55 recorded PMd units (C) and 25 simulated PMd-like units (D). Upper panels: magnitude of PD shifts between open-loop BMI and PC. Middle and lower panels: magnitude of EPD shifts between PC and BC-WHM and BC-WO-HM, respectively. Red bars indicate statistically significant shifts (p < 0.05).
Figure 4
Figure 4
Histograms of the magnitude of EPD shifts at −100 ms lag between stages of simulated BMI experiments with different Kalman filters. Upper: EPD shifts between hand control and KF online control. Middle: EPD shifts between KF training data and Re-KF online control. Lower: EPD shifts between KF training and ReFIT-KF online control. Red bars indicate statistically significant shifts (p < 0.05).
Figure 5
Figure 5
Histogram of magnitude of deviations between RPDs, as defined by the tuning weights of the simulated neural activity with respect to the velocity, and EPD in PC at −100 ms lag for simulated M1-like (A) and PMd-like (B) units.
Figure 6
Figure 6
Estimated distributions of the magnitude of EPD shifts between hand control and either BC-WHM or BC-WO-HM during simulations with different filter types (linear, KF, and ReFIT-KF). Distributions were estimated over 20 runs of 20 min with 50 different units each (total of 1,000 simulated units).
Figure 7
Figure 7
Estimated distributions of the magnitude of EPD shifts during simulations that better satisfy the conditions of Proposition 2 (A) and simulations that best satisfy both Propositions (B). In particular, simulations that better satisfy Proposition 2 involved center-out rather than random movements, included 150 units with uniformly distributed RPDs rather than 50 units with random RPDs in each simulation, and used filters that were trained over 3-times longer sections. Simulations that best satisfy both Propositions were similar but included only PMd-like units, each with a single RPD that was used to encode both the estimated velocity and estimated position. Distributions were estimated from 3, 000 simulated units during 20 simulations. Graphs for “conditions not satisfied” are shown for comparison (same as in Figure 6 but shown separately for M1-like and PMd-like units).
Figure 8
Figure 8
Estimated distributions of the magnitude of deviations between RPD and EPD during simulations that better satisfy the conditions of Proposition 2 (A) and simulations that best satisfy both Propositions (B). See Figure 7 and text for more details.

Similar articles

References

    1. Ashe J. (1997). Force and the motor cortex. Behav. Brain Res. 87, 255–269. 10.1016/S0166-4328(97)00752-3 - DOI - PubMed
    1. Ashe J., Georgopoulos A. P. (1994). Movement parameters and neural activity in motor cortex and area 5. Cereb. Cortex 4, 590–600. 10.1093/cercor/4.6.590 - DOI - PubMed
    1. Benyamini M., Zacksenhouse M. (2015). Optimal feedback control successfully explains changes in neural modulations during experiments with brain-machine interfaces. Front. Syst. Neurosci. 9:71. 10.3389/fnsys.2015.00071 - DOI - PMC - PubMed
    1. Carmena J. M., Lebedev M. A., Crist R. E., O'Doherty J. E., Santucci D. M., Dimitrov D. F., et al. . (2003). Learning to control a brain-machine interface for reaching and grasping by primates. PLoS Biol. 1:e42. 10.1371/journal.pbio.0000042 - DOI - PMC - PubMed
    1. Chase S. M., Kass R. E., Schwartz A. B. (2012). Behavioral and neural correlates of visuomotor adaptation observed through a brain-computer interface in primary motor cortex. J. Neurophysiol. 108, 624–644. 10.1152/jn.00371.2011 - DOI - PMC - PubMed

LinkOut - more resources