. 2021 Jul 19:12:682790.
doi: 10.3389/fphys.2021.682790. eCollection 2021.

Discrete Dynamic Model of the Mammalian Sperm Acrosome Reaction: The Influence of Acrosomal pH and Physiological Heterogeneity

Affiliations

Discrete Dynamic Model of the Mammalian Sperm Acrosome Reaction: The Influence of Acrosomal pH and Physiological Heterogeneity

Andrés Aldana et al. Front Physiol. .

Abstract

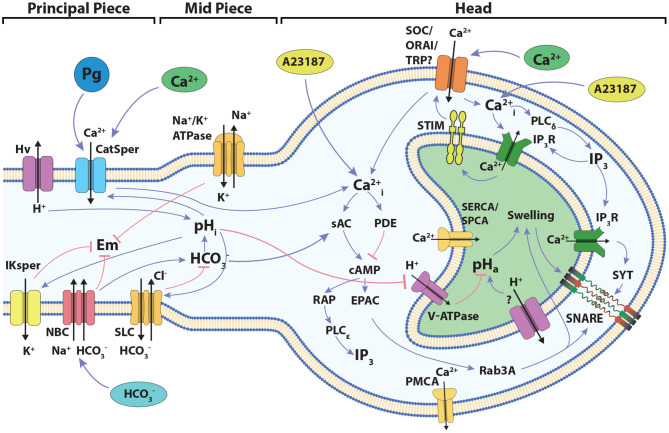
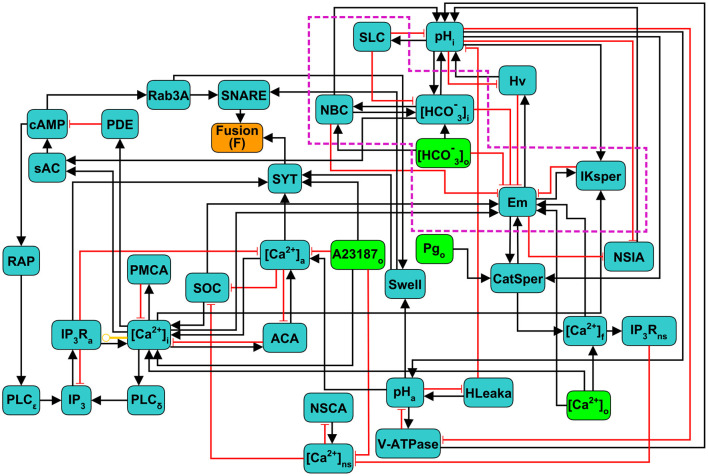
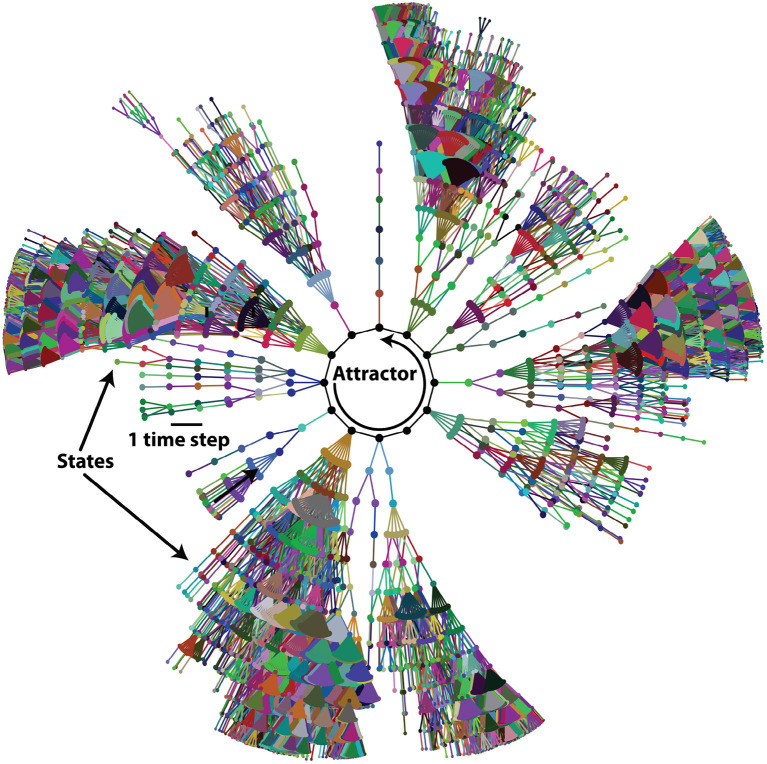
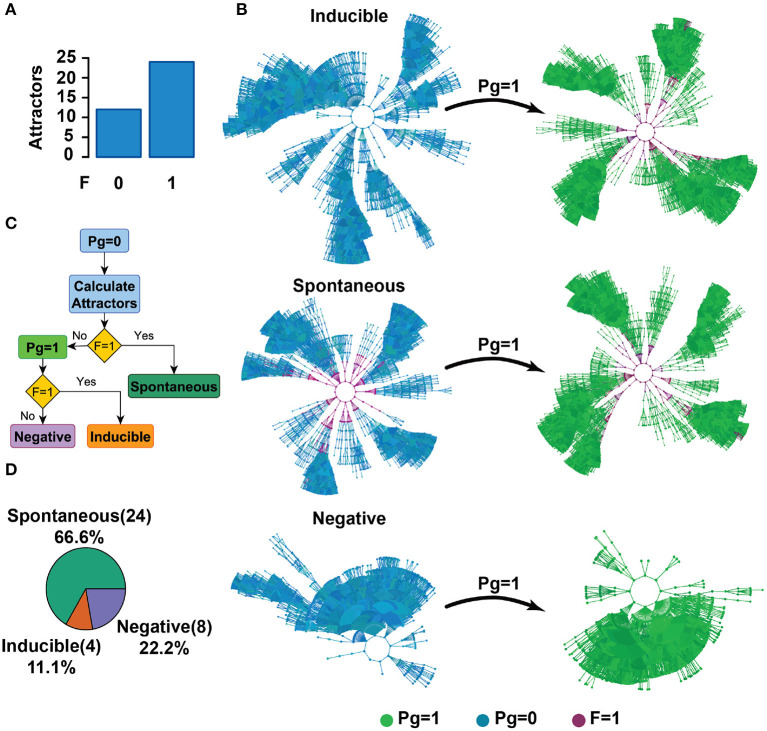
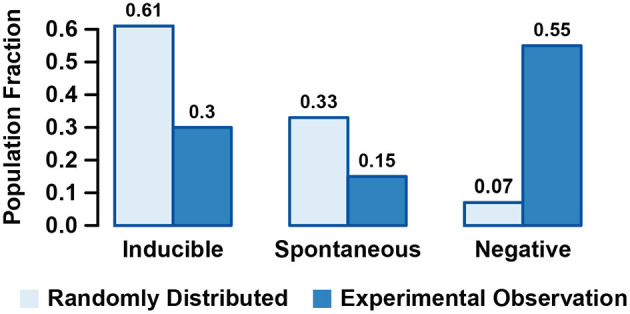
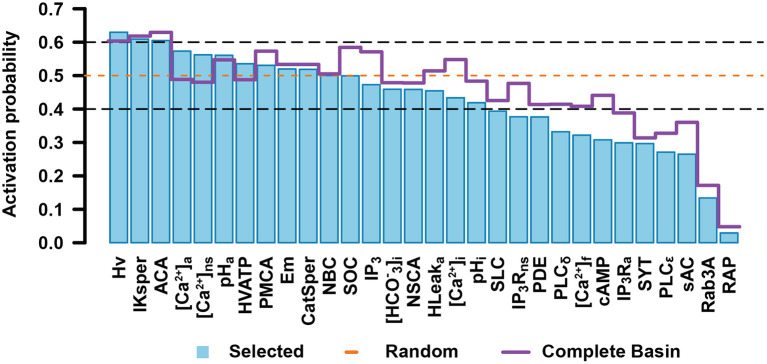
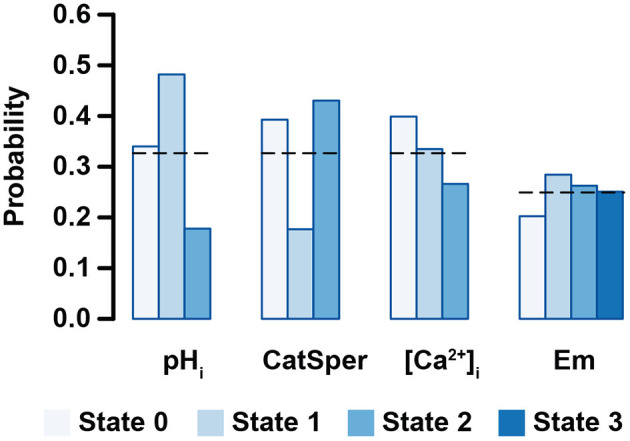
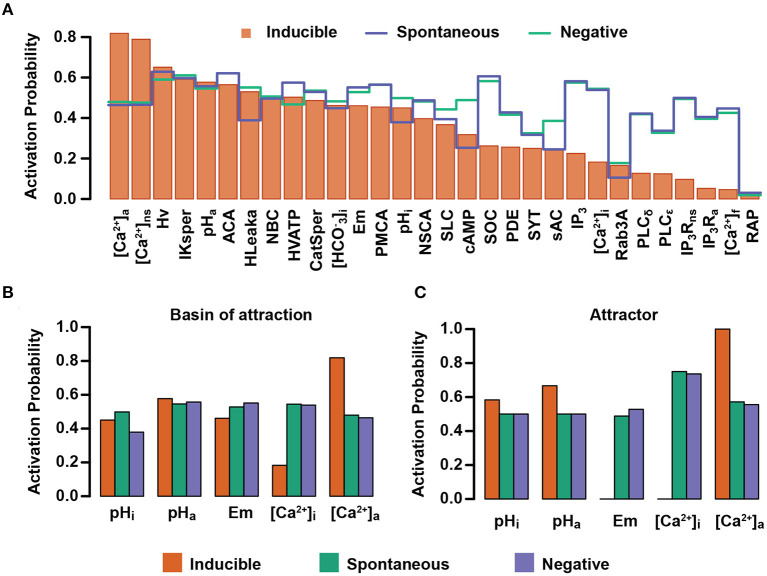
The acrosome reaction (AR) is an exocytotic process essential for mammalian fertilization. It involves diverse physiological changes (biochemical, biophysical, and morphological) that culminate in the release of the acrosomal content to the extracellular medium as well as a reorganization of the plasma membrane (PM) that allows sperm to interact and fuse with the egg. In spite of many efforts, there are still important pending questions regarding the molecular mechanism regulating the AR. Particularly, the contribution of acrosomal alkalinization to AR triggering physiological conditions is not well understood. Also, the dependence of the proportion of sperm capable of undergoing AR on the physiological heterogeneity within a sperm population has not been studied. Here, we present a discrete mathematical model for the human sperm AR based on the physiological interactions among some of the main components of this complex exocytotic process. We show that this model can qualitatively reproduce diverse experimental results, and that it can be used to analyze how acrosomal pH (pH a ) and cell heterogeneity regulate AR. Our results confirm that a pH a increase can on its own trigger AR in a subpopulation of sperm, and furthermore, it indicates that this is a necessary step to trigger acrosomal exocytosis through progesterone, a known natural inducer of AR. Most importantly, we show that the proportion of sperm undergoing AR is directly related to the detailed structure of the population physiological heterogeneity.

Keywords: acrosome reaction; discrete dynamics; dynamic model; mammalian fertilization; pH regulation; physiological heterogeneity; regulatory network; sperm signaling pathway.


Conflict of interest statement

The authors declare that the research was conducted in the absence of any commercial or financial relationships that could be construed as a potential conflict of interest.

Figures

Figure 1
Figure 1
Diagram of the signaling network involved in the development of acrosome reaction in human sperm. The cartoon shows the main components and signaling events to be considered in the development of the model described in the present work. Blue links connecting components indicate positive interactions, while red links indicate negative interactions. The localization of the different components among the head and the flagellum are indicated. Progesterone activates CatSper indirectly through a lipid hydrolase (Miller et al., 2016).
Figure 2
Figure 2
Scheme of the discrete regulatory network for acrosome reaction (AR) in human sperm. Light green nodes indicate extracellular components that can be considered as external stimuli or inputs of the network, dark green nodes represent intracellular components, the orange node Fusion (F) is the network's output reporter, representing the fusion between OAM and PM, that indicates AR completion. Black arrows indicate positive or activating interactions, red arrows indicate negative or inhibitory interactions, and yellow arrow indicates a dual interaction, depending on the values of the nodes involved. Subscripts indicate the physical location in the sperm of the physiological component represented by its corresponding node: i,a,o,f and ns represent intracellular, acrosomal, outer (extracellular medium), flagellar and neck store, respectively. Nodes inside the purple doted box are mostly involved in capacitation and are included as control variables of the necessary conditions to undergo AR.
Figure 3
Figure 3
Basin of attraction of one attractor of the acrosome reaction (AR) network. Network states are symbolized by dots and links between dots represent the single-step state transitions. The network eventually reaches the attractor, symbolized by black dots at the center, connected with solid black lines. For clarity, only states at 13 or less time steps away from the attractor are shown.
Figure 4
Figure 4
Attractor landscape partitions into three functional groups: Spontaneous, Inducible, and Negative. (A) The number of attractors reaching a membrane fusion state (F = 1) or lack of it (F = 0) in the absence of Pg (Pg = 0). (B) Diagram of the classification criteria of the attractor space in three functional groups. Colors represent the activity of the Pg node and the reporter node Fusion (F); blue dots correspond to states where Pg = 0, whereas green dots indicate Pg = 1. Purple dots represent states reaching F = 1. Considering the attractors of (A), Spontaneous attractors present membrane fusion (F = 1) in the absence of Pg, in which case Pg addition does not affect the membrane fused state [these attractors correspond to the second bar of (A)]. From the remaining attractors that do not present membrane fusion (F = 0), Inducible attractors are those where the fusion state (F = 1) is reached only after a Pg stimulus (Pg = 1). Negative attractors never reach the fusion state (F = 1) regardless of the value of Pg. (C) Flow diagram of the classification criteria described in (B). (D) Distribution of attractors in the absence of Pg (Pg = 0), classified in terms of their response to Pg.
Figure 5
Figure 5
Fraction of states randomly selected based on an equiprobable random distribution that are contained in the basins of attraction of Inducible, Spontaneous, and Negative attractors and comparison with the experimental observed fraction of sperms displaying induced, Spontaneous, or Negative acrosome reaction (AR).
Figure 6
Figure 6
Activation probability of network nodes in the set of initial states. Bar heights for each node represent the probability that the node is in the active state. The orange dashed line points out the activation probability of a completely random set of initial states. The purple straight line represents the activation probability of each node on the entire set of states conforming the basins of attraction for all the attractors. Nodes whose activation probability is between 0.4 and 0.6 are enclosed in black dashed lines. Error bars are not shown since in each case standard deviation is below 0.001.
Figure 7
Figure 7
Probability that one node takes a specific value in the set of initial states for non-binary nodes. Bar lengths show the average probability calculated over 2 × 10⁷ initial states. Black dashed lines indicate the probability on a completely random set of initial states. Biological interpretation for each node is as follows: pHi (acidic 0, mildly alkaline 1, fully alkaline 2); CatSper (closed 0, open 1, inactivated 2); [Ca2+]i (basal 0, activator 1, inhibitor 2); Em (hyperpolarized 0, equilibrium 1, mildly depolarized 2, and fully depolarized 3). Error bars are not shown since standard deviation is below 0.001.
Figure 8
Figure 8
Activation probability of network nodes in Inducible, Spontaneous, and Negative attractors. (A) Bars represent the activation probability of the network nodes for states in the Inducible attractors. Blue and green lines correspond to the activation probability of the network nodes in the Spontaneous and Negative attractors, respectively. (B,C) Activation probability of pHi, pHa, Em. [Ca2+]i and [Ca2+]a in the basins of attraction (B) or attractors (C) in the three functional classes.
Figure 9
Figure 9
pHa blocking effect on Inducible, Spontaneous, and Negative basins of attraction. (A) Number of total attractors when the pHa node is fixed as acidic (0) or alkaline (1) on the entire state space. (B) Distribution of attractors among functional classes fixing pHa as in (A). Setting pHa = 0 results in the deletion of Inducible and Spontaneous attractors, whereas fixing pHa = 1 leads to deletion of the Negative class. (C) Attractors distributed among the different functional classes where pHa is fixed only in the attractor states. Fixing pHa = 1 on the sequence of Negative attractors transforms them in Spontaneous attractors.
Figure 10
Figure 10
Fraction of node-specific perturbations that promoted functional changes on Inducible (A), Spontaneous (B), and Negative (C) attractors. Nodes involved directly in [Ca2+]i and [Ca2+]a regulation show high sensitivity on the Inducible group, whereas Spontaneous and Negative attractors show higher sensitivity to perturbations to nodes related to pHa and pHi. The three panels show a minimal change into Inducible attractors from Negative and Spontaneous groups.

Similar articles

Cited by

References

    1. Alvarez-Buylla E. R., Chaos Á., Aldana M., Benítez M., Cortes-Poza Y., Espinosa-Soto C., et al. . (2008). Floral morphogenesis: stochastic explorations of a gene network epigenetic landscape. PLoS ONE 3:e3626. 10.1371/journal.pone.0003626 - DOI - PMC - PubMed
    1. Balbach M., Gervasi M. G., Martin-Hidalgo D., Visconti P. E., Levin L. R., Buck J. (2020a). Metabolic changes in mouse sperm during capacitation. Biol. Reprod. 103, 791–801. 10.1093/biolre/ioaa114 - DOI - PMC - PubMed
    1. Balbach M., Hamzeh H., Jikeli J. F., Brenker C., Schiffer C., Hansen J. N., et al. . (2020b). Molecular mechanism underlying the action of zona-pellucida glycoproteins on mouse sperm. Front. Cell Dev. Biol. 8:572735. 10.3389/fcell.2020.572735 - DOI - PMC - PubMed
    1. Baldi E., Luconi M., Muratori M., Marchiani S., Tamburrino L., Forti G. (2009). Nongenomic activation of spermatozoa by steroid hormones: facts and fictions. Mol. Cell. Endocrinol. 308, 39–46. 10.1016/j.mce.2009.02.006 - DOI - PubMed
    1. Baxendale R. W., Fraser L. R. (2003). Evidence for multiple distinctly localized adenylyl cyclase isoforms in mammalian spermatozoa. Mol. Reprod. Dev. 66, 181–189. 10.1002/mrd.10344 - DOI - PubMed