. 2021 Jul 19:12:666510.
doi: 10.3389/fmicb.2021.666510. eCollection 2021.

New Insights From Transcriptomic Data Reveal Differential Effects of CO2 Acidification Stress on Photosynthesis of an Endosymbiotic Dinoflagellate in hospite

Affiliations

New Insights From Transcriptomic Data Reveal Differential Effects of CO2 Acidification Stress on Photosynthesis of an Endosymbiotic Dinoflagellate in hospite

Marcela Herrera et al. Front Microbiol. .

Abstract

Ocean acidification (OA) has both detrimental as well as beneficial effects on marine life; it negatively affects calcifiers while enhancing the productivity of photosynthetic organisms. To date, many studies have focused on the impacts of OA on calcification in reef-building corals, a process particularly susceptible to acidification. However, little is known about the effects of OA on their photosynthetic algal partners, with some studies suggesting potential benefits for symbiont productivity. Here, we investigated the transcriptomic response of the endosymbiont Symbiodinium microadriaticum (CCMP2467) in the Red Sea coral Stylophora pistillata subjected to different long-term (2 years) OA treatments (pH 8.0, 7.8, 7.4, 7.2). Transcriptomic analyses revealed that symbionts from corals under lower pH treatments responded to acidification by increasing the expression of genes related to photosynthesis and carbon-concentrating mechanisms. These processes were mostly up-regulated and associated metabolic pathways were significantly enriched, suggesting an overall positive effect of OA on the expression of photosynthesis-related genes. To test this conclusion on a physiological level, we analyzed the symbiont's photochemical performance across treatments. However, in contrast to the beneficial effects suggested by the observed gene expression changes, we found significant impairment of photosynthesis with increasing pCO2. Collectively, our data suggest that over-expression of photosynthesis-related genes is not a beneficial effect of OA but rather an acclimation response of the holobiont to different water chemistries. Our study highlights the complex effects of ocean acidification on these symbiotic organisms and the role of the host in determining symbiont productivity and performance.

Keywords: F’/Fm’; Symbiodiniaceae; carbon-concentrating mechanism; coral-dinoflagellate symbiosis; gene expression; ocean acidification; pCO2.


Conflict of interest statement

The authors declare that the research was conducted in the absence of any commercial or financial relationships that could be construed as a potential conflict of interest.

Figures

FIGURE 1
FIGURE 1
Schematic of the experimental design. (A) A single clone of the Red Sea coral Stylophora pistillata (symbiotic with Symbiodinium microadriaticum CCMP2467) was collected in 1989. (B) The same coral colony was (i) fragmented into multiple nubbins and (ii) maintained in the aquaria system of the Centre Scientifique de Monaco. (C) At least 3 nubbins were added to different pH treatments in 2012: pHs 7.2, 7.4, 7.8 and a control pH 8.0. Details on carbonate chemistry are shown as means ± SD; Ωar, saturation state of aragonite [taken from Liew et al. (2018)]. (D) Coral nubbins were retrieved in 2014 after being subjected to their respective treatments for 2 years. (i) RNA extractions were performed and (ii) photochemical efficiency (F’/Fm’) were measured to analyze changes in gene expression and assess the photo-physiological status, respectively.
FIGURE 2
FIGURE 2
Relationship between samples. Principal component analysis (PCA) of (A) in hospite Symbiodinium microadriaticum CCMP2467 and (B) Stylophora pistillata samples across all four treatments.
FIGURE 3
FIGURE 3
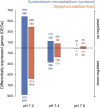
Barplot showing number of differentially expressed genes (DEGs) for the symbiont (blue) and coral host (orange) across pH treatments compared to the control. Numbers in bold indicate the total number of DEGs for each category whilst numbers in parenthesis show unique genes (exclusive to that treatment). Top and bottom panels depict direction of the change, up- and down-regulation, respectively.
FIGURE 4
FIGURE 4
Differential transcriptomic response of in hospite Symbiodinium microadriaticum CCMP2467 to CO2 acidification stress. (A) Heat map showing GO terms related to photosynthesis and carbon concentrating mechanisms. Empty boxes denote differences that were not significant (p ≥ 0.05). Annotation of each term is described in the table and p-values are provided in Supplementary Table 8. (B) Circular plot showing selected GO terms enriched in pH 7.2. Statistical significance (log10 adjusted p-value) of each GO term is shown by the height of the bars in the inner circle, while the color represents the overall regulation effect of each process as indicated by the z-score (red – increased, white – unchanged, blue – decreased). The outer circle scatterplots show the differentially expressed genes assigned to each process, where red and blue represent genes that are up- and down-regulation, respectively.
FIGURE 5
FIGURE 5
Absolute gene expression (transcripts per million) of two Stylophora pistillata genes encoding for bicarbonate transporter-like proteins across pH treatments. Although expression of these genes was not significantly different among conditions (ANOVASpis16901 F = 3.023, p = 0.094, ANOVASpis5056.t2 F = 1.402, p = 0.311), it followed the order pH 7.2 > 7.4 > 7.8 > 8.0.
FIGURE 6
FIGURE 6
Mean (± 1 SE) photochemical efficiencies of Symbiodinium microadriaticum CCMP2467 across pH treatments. Letters indicate overall similarities (e.g., AA) or differences (e.g., AB) between treatments as determined by SNK post hoc tests.

References

    1. Alexa A., Rahnenführer J., Lengauer T. (2006). Improved scoring of functional groups from gene expression data by decorrelating GO graph structure. Bioinformatics 22 1600–1607. 10.1093/bioinformatics/btl140 - DOI - PubMed
    1. Al-Moghrabi S., Goiran C., Allemand D., Speziale N., Jaubert J. (1996). Inorganic carbon uptake for photosynthesis by the symbiotic coral-dinoflagellate association II. Mechanisms for bicarbonate uptake. J. Exp. Mar. Biol. Ecol. 199 227–248. 10.1016/0022-0981(95)00202-2 - DOI
    1. Andersson A. J., Gledhill D. (2013). Ocean acidification and coral reefs: effects on breakdown, dissolution, and net ecosystem calcification. Annu. Rev. Mar. Sci. 5 321–348. 10.1146/annurev-marine-121211-172241 - DOI - PubMed
    1. Anthony K. R. N., Kline D. I., Diaz-Pulido G., Dove S., Hoegh-Guldberg O. (2008). Ocean acidification causes bleaching and productivity loss in coral reef builders. Proc. Natl. Acad. Sci. U.S.A. 105:17442. 10.1073/pnas.0804478105 - DOI - PMC - PubMed
    1. Aranda M., Li Y., Liew Y. J., Baumgarten S., Simakov O., Wilson M. C., et al. (2016). Genomes of coral dinoflagellate symbionts highlight evolutionary adaptations conducive to a symbiotic lifestyle. Sci. Rep. 6:39734. - PMC - PubMed

LinkOut - more resources