. 2021 Jul 19:12:659507.
doi: 10.3389/fgene.2021.659507. eCollection 2021.

Genome Divergence and Dynamics in the Thin-Tailed Desert Sheep From Sudan

Affiliations

Genome Divergence and Dynamics in the Thin-Tailed Desert Sheep From Sudan

Adam Abied et al. Front Genet. .

Abstract

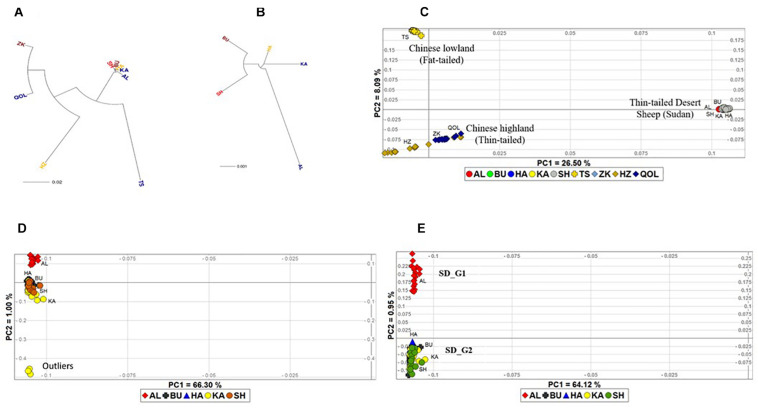
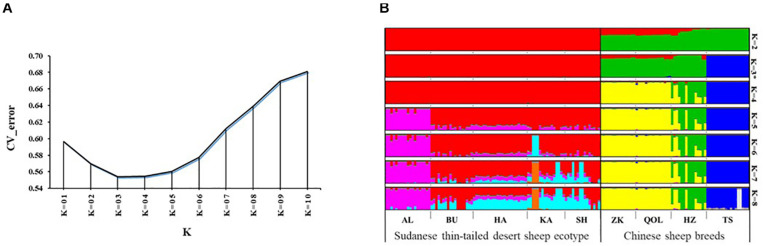
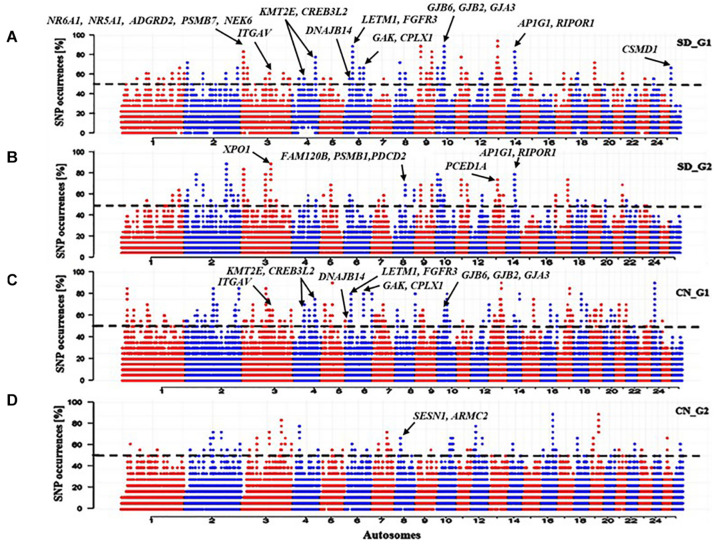
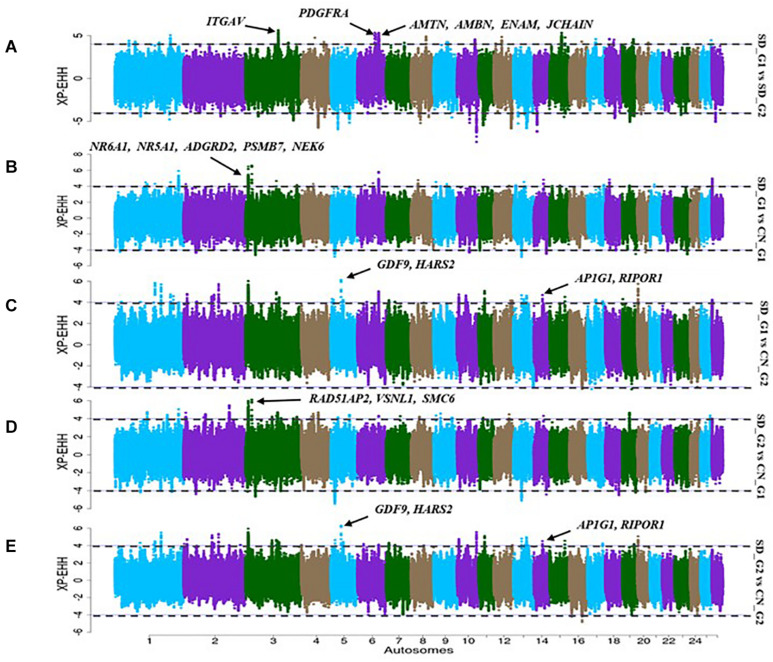
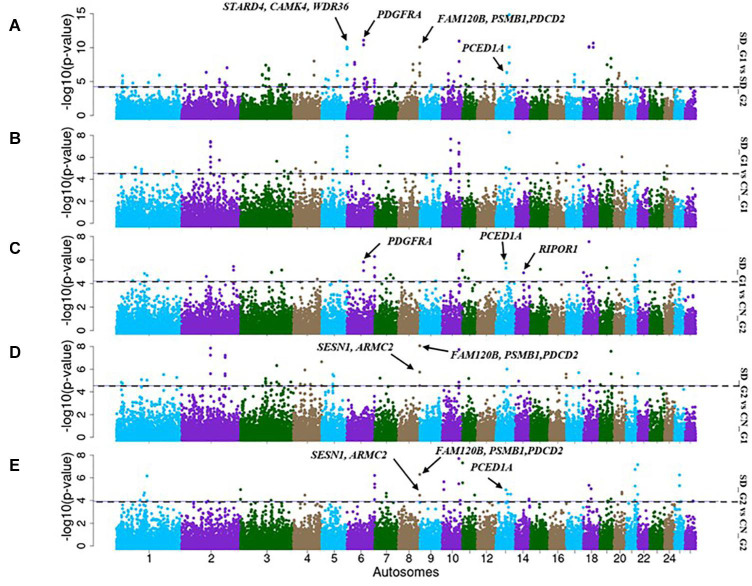
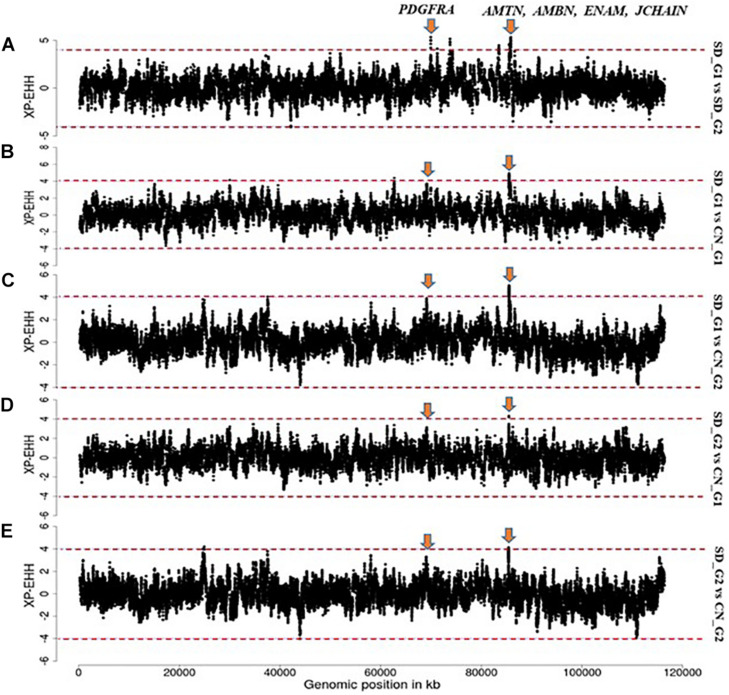
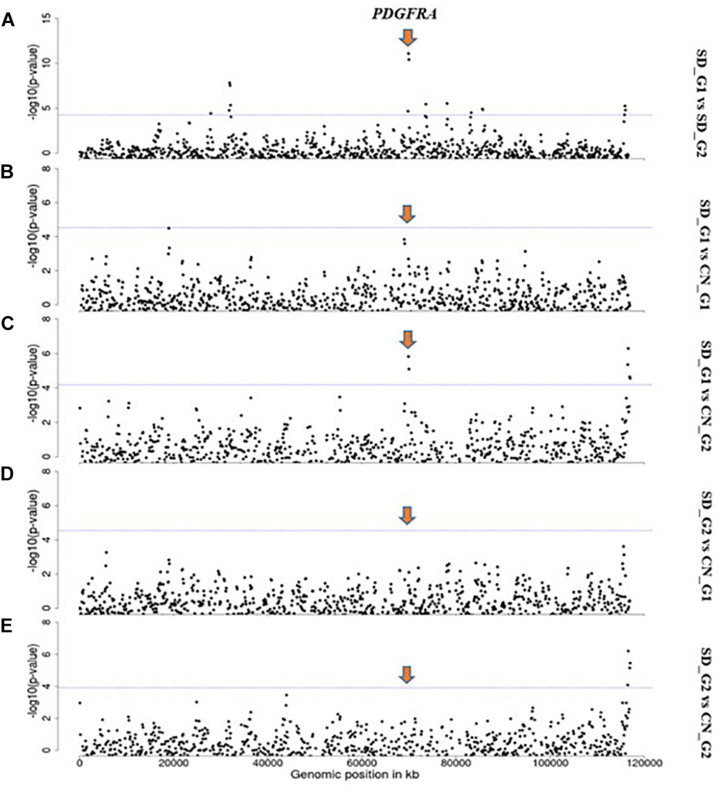
With climate change bound to affect food and feed production, emphasis will shift to resilient and adapted indigenous livestock to sustain animal production. However, indigenous livestock comprise several varieties, strains and ecotypes whose genomes are poorly characterized. Here, we investigated genomic variation in an African thin-tailed Desert Sheep sampled in Sudan, using 600K genotype data generated from 92 individuals representing five ecotypes. We included data from 18 fat-tailed and 45 thin-tailed sheep from China, to investigate shared ancestry and perform comparative genomic analysis. We observed a clear genomic differentiation between the African thin-tailed Desert Sheep and the Chinese thin-tailed and fat-tailed sheep, suggesting a broad genetic structure between the fat-tailed and thin-tailed sheep in general, and that at least two autosomal gene pools comprise the genome profile of the thin-tailed sheep. Further analysis detected two distinct genetic clusters in both the African thin-tailed Desert Sheep and the Chinese thin-tailed sheep, suggesting a fine-scale and complex genome architecture in thin-tailed sheep. Selection signature analysis suggested differences in adaptation, production, reproduction and morphology likely underly the fine-scale genetic structure in the African thin-tailed Desert Sheep. This may need to be considered in designing breeding programs and genome-wide association studies.

Keywords: SNP genotypes; adaptation; climate change; genetic diversity; selection signatures.


Conflict of interest statement

The authors declare that the research was conducted in the absence of any commercial or financial relationships that could be construed as a potential conflict of interest.

Figures

FIGURE 1
FIGURE 1
(A) LD decay pattern within 5 Mb distance in Sudanese and Chinese sheep. (B) NE across 1,000 generations in Sudanese and Chinese sheep.
FIGURE 2
FIGURE 2
Neighbor Joining tree of (A) all the five Sudanese thin-tailed Desert Sheep ecotypes and four breeds of Chinese sheep; (B) the five ecotypes of Sudanese thin-tailed Desert Sheep only; (C) PCA plot of all the individuals analyzed in this study; (D) PCA of Sudanese thin tailed Desert Sheep only; (E) PCA of the Sudanese thin-tailed Desert Sheep excluding the three outliers of the Kabashi ecotype.
FIGURE 3
FIGURE 3
(A) CV plot of the admixture analysis involving all the samples analyzed in the study. (B) Admixture plot showing the assignment probabilities of all the individuals analyzed in the current study for 2 ≤ K ≤ 8.
FIGURE 4
FIGURE 4
Manhattan plots of genome-wide distribution frequency of SNPs in stretches of ROH regions for (A) SD_G1 genetic group of thin-tailed Desert Sheep from Sudan; (B) SD_G2 genetic group of thin-tailed Desert Sheep from Sudan; (C) CN_G1 genetic group of Chinese sheep; (D) CN_G2 genetic group of Chinese sheep. The dashed lines indicate the 50% cut-off threshold for each groups of individuals.
FIGURE 5
FIGURE 5
Manhattan plots showing the candidate signatures of selection as determined with XP-EHH. (A) SD_G1 vs. SD_G2; (B) SD_G1 vs. CN_G1; (C) SD_G1 vs. CN_G2; (D) SD_G2 vs. CN_G1; (E) SD_G2 vs. CN_G2.
FIGURE 6
FIGURE 6
Manhattan plots showing the candidate signatures of selection as determined with FST. (A) SD_G1 vs. SD_G2; (B) SD_G1 vs. CN_G1; (C) SD_G1 vs. CN_G2; (D) SD_G2 vs. CN_G1; (E) SD_G2 vs. CN_G2.
FIGURE 7
FIGURE 7
Manhattan plots showing the strongest candidate signatures of selection as determined with XP-EHH on OAR6. (A) SD_G1 vs. SD_G2; (B) SD_G1 vs. CN_G1; (C) SD_G1 vs. CN_G2; (D) SD_G2 vs. CN_G1; (E) SD_G2 vs. CN_G2.
FIGURE 8
FIGURE 8
Manhattan plots showing the strongest candidate signatures of selection as determined with FST on OAR6. (A) SD_G1 vs. SD_G2; (B) SD_G1 vs. CN_G1; (C) SD_G1 vs. CN_G2; (D) SD_G2 vs. CN_G1; (E) SD_G2 vs. CN_G2.
FIGURE 9
FIGURE 9
Manhattan plots showing the strongest candidate signatures of selection as determined with XP-EHH on OAR3. (A) SD_G1 vs. SD_G2; (B) SD_G1 vs. CN_G1; (C) SD_G1 vs. CN_G2; (D) SD_G2 vs. CN_G1; (E) SD_G2 vs. CN_G2.

References

    1. Abualazayium M. (2004). Animal Wealth and Animal Production in Sudan. Khartoum: Khartoum University Press.
    1. Ahbara A., Bahbahani H., Almathen F., Al Abri M., Agoub M. O., Mwacharo J. M. (2019). Genome-wide variation, candidate regions and genes associated with fat deposition and tail morphology in Ethiopian indigenous sheep. Front. Genet. 9:699. 10.3389/fgene.2018.00699 - DOI - PMC - PubMed
    1. Ahbara A. M. (2019). Autosomal Genome-wide Analysis of Diversity, Adaptation and Morphological Traits in African Indigenous Sheep. Ph.D. Thesis. Nottingham: University of Nottingham, 183.
    1. Al Kalaldeh M., Gibson J., Lee S. H., Gondro C., van der Werf J. H. J. (2019). Detection of genomic regions underlying resistance to gastrointestinal parasites in Australian sheep. Genet. Sel. Evol. 51:37. 10.1186/s12711-019-0479-1 - DOI - PMC - PubMed
    1. Alexander D. H., Novembre J., Lange K. (2009). Fast model-based estimation of ancestry in unrelated individuals. Genome Res. 19 1655–1664. 10.1101/gr.094052.10910.1080/10495390902786926 - DOI - DOI - PMC - PubMed

LinkOut - more resources