

A BAYESIAN MARK INTERACTION MODEL FOR ANALYSIS OF TUMOR PATHOLOGY IMAGES
- PMID: 34349870
- PMCID: PMC8330435
- DOI: 10.1214/19-aoas1254
A BAYESIAN MARK INTERACTION MODEL FOR ANALYSIS OF TUMOR PATHOLOGY IMAGES
Abstract
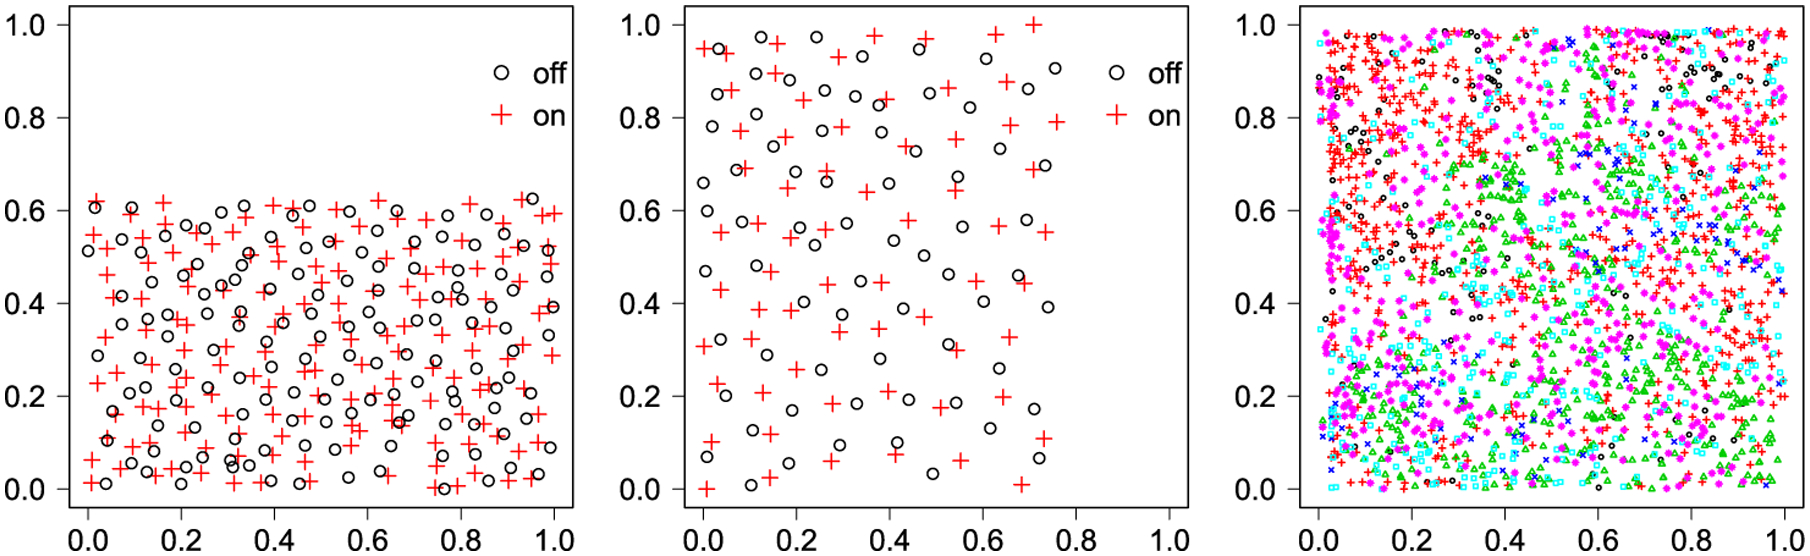
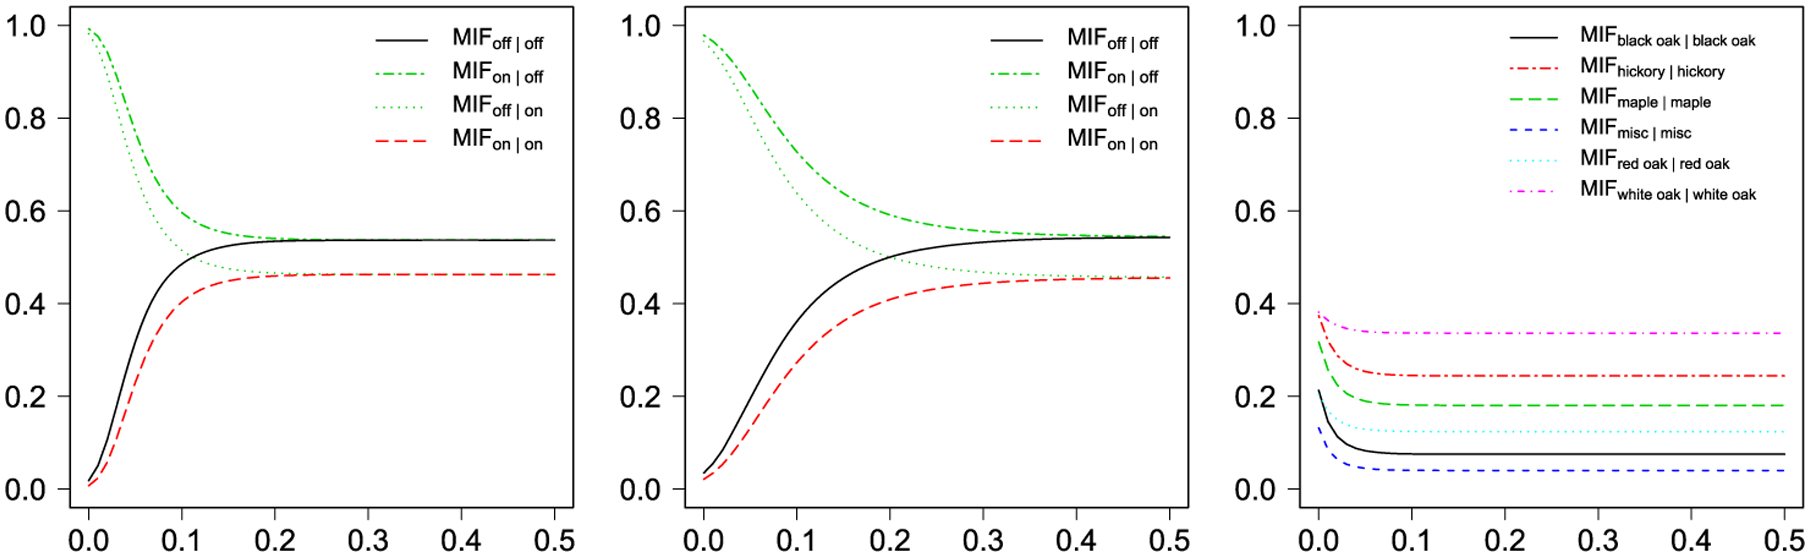
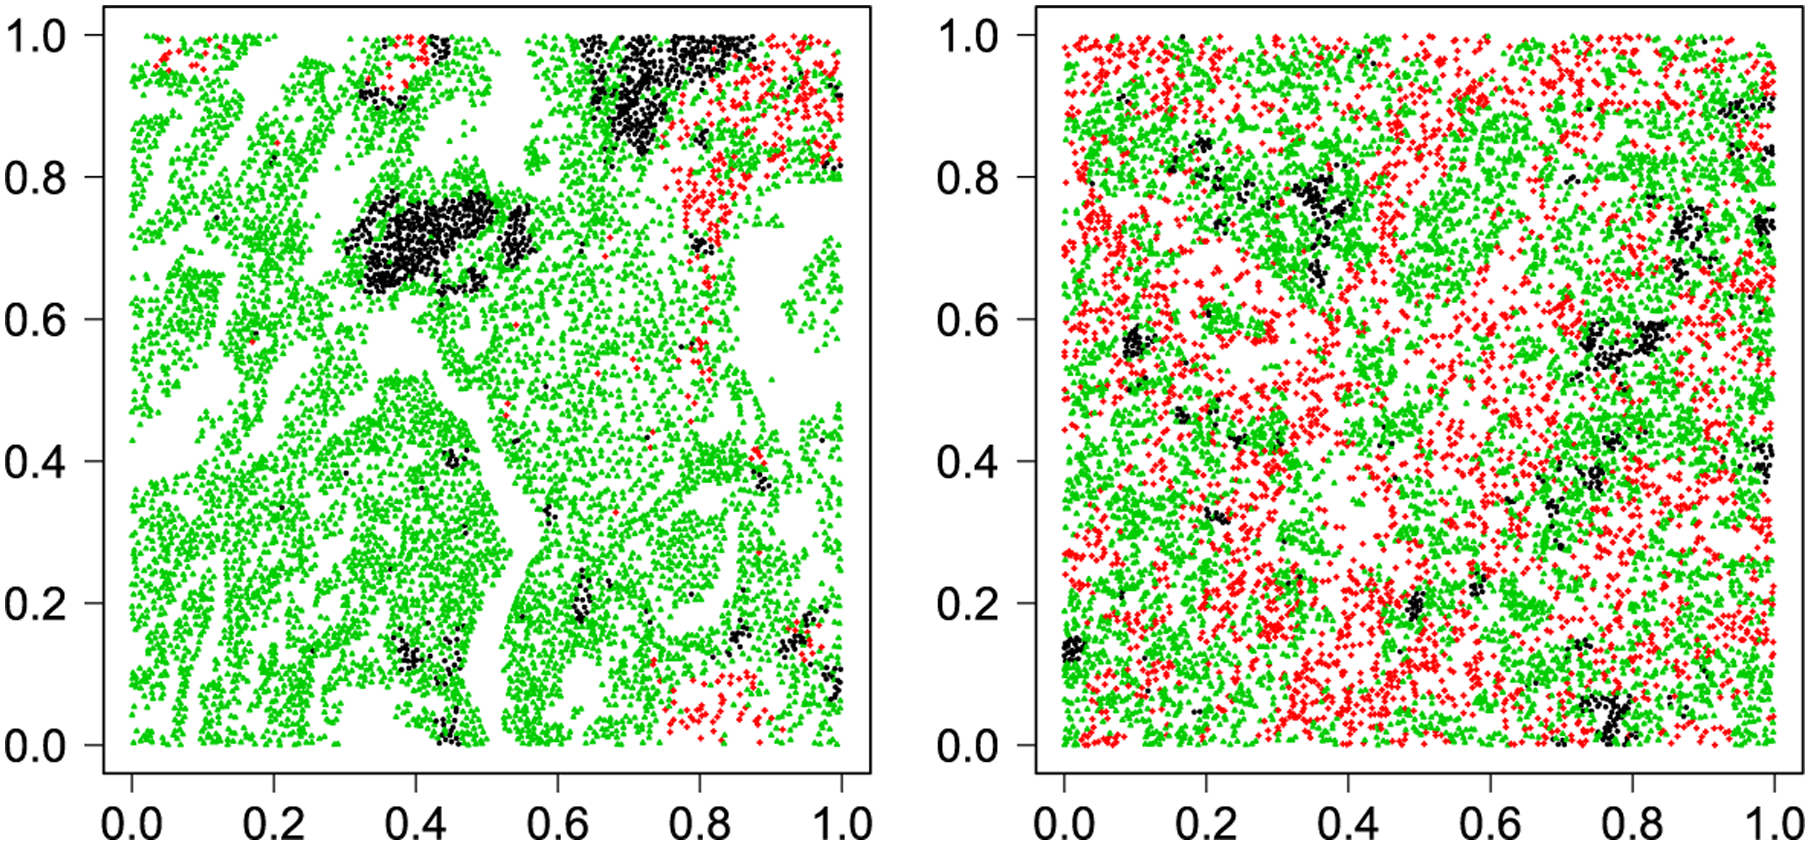
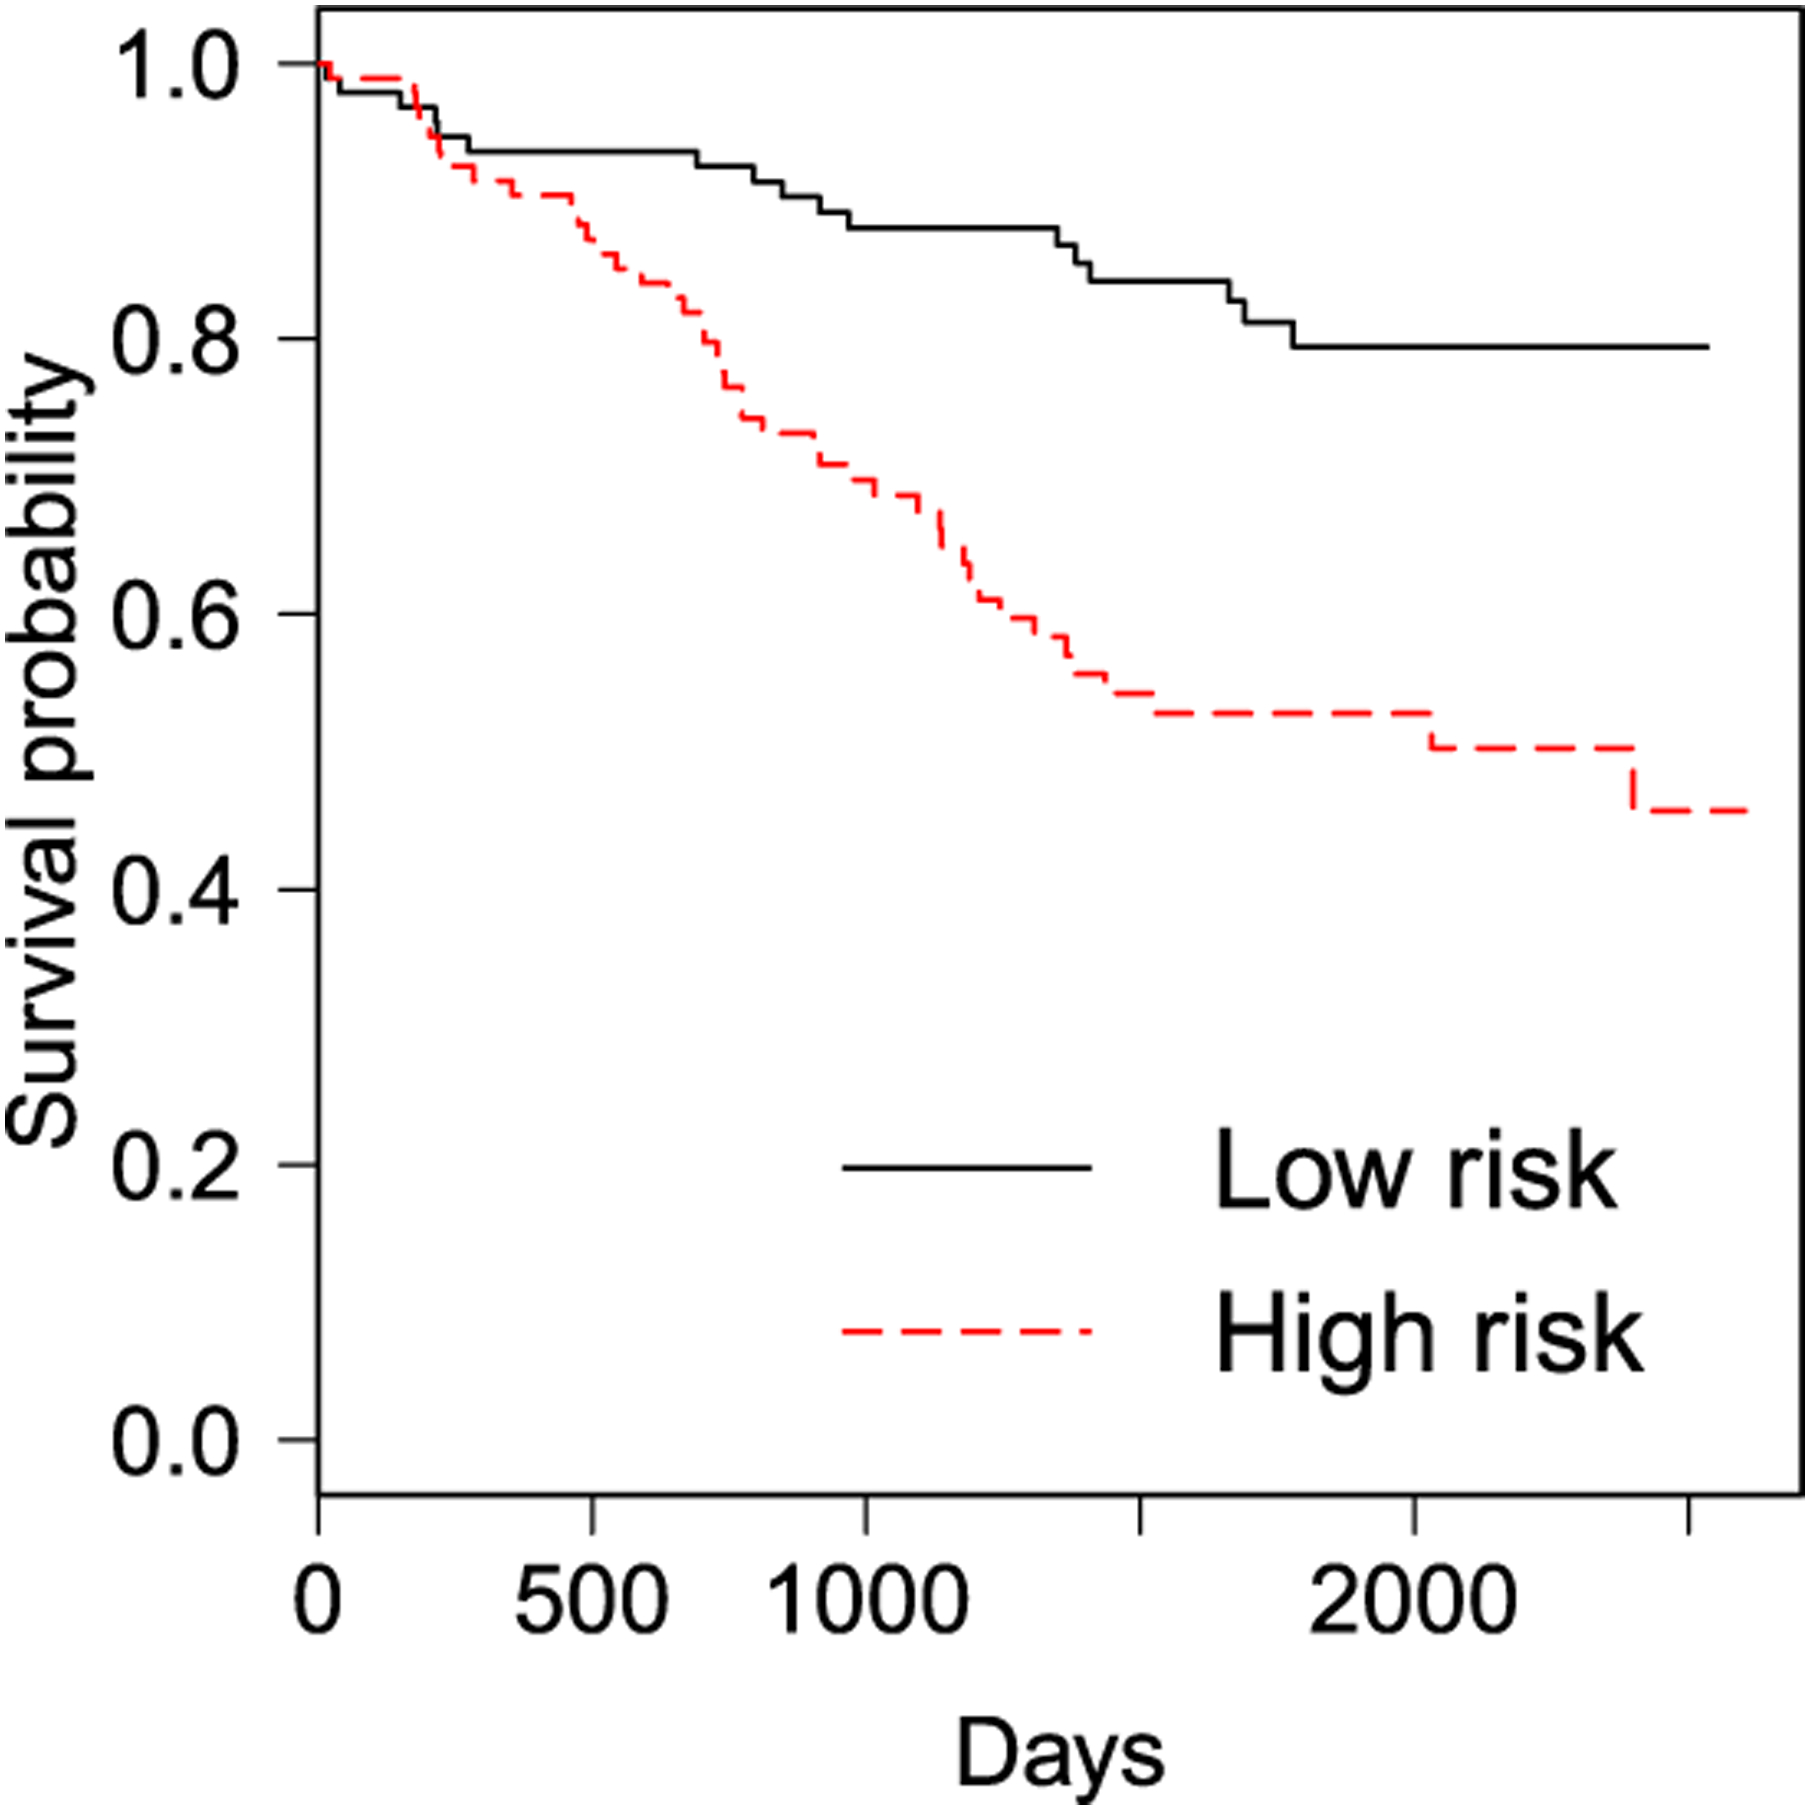
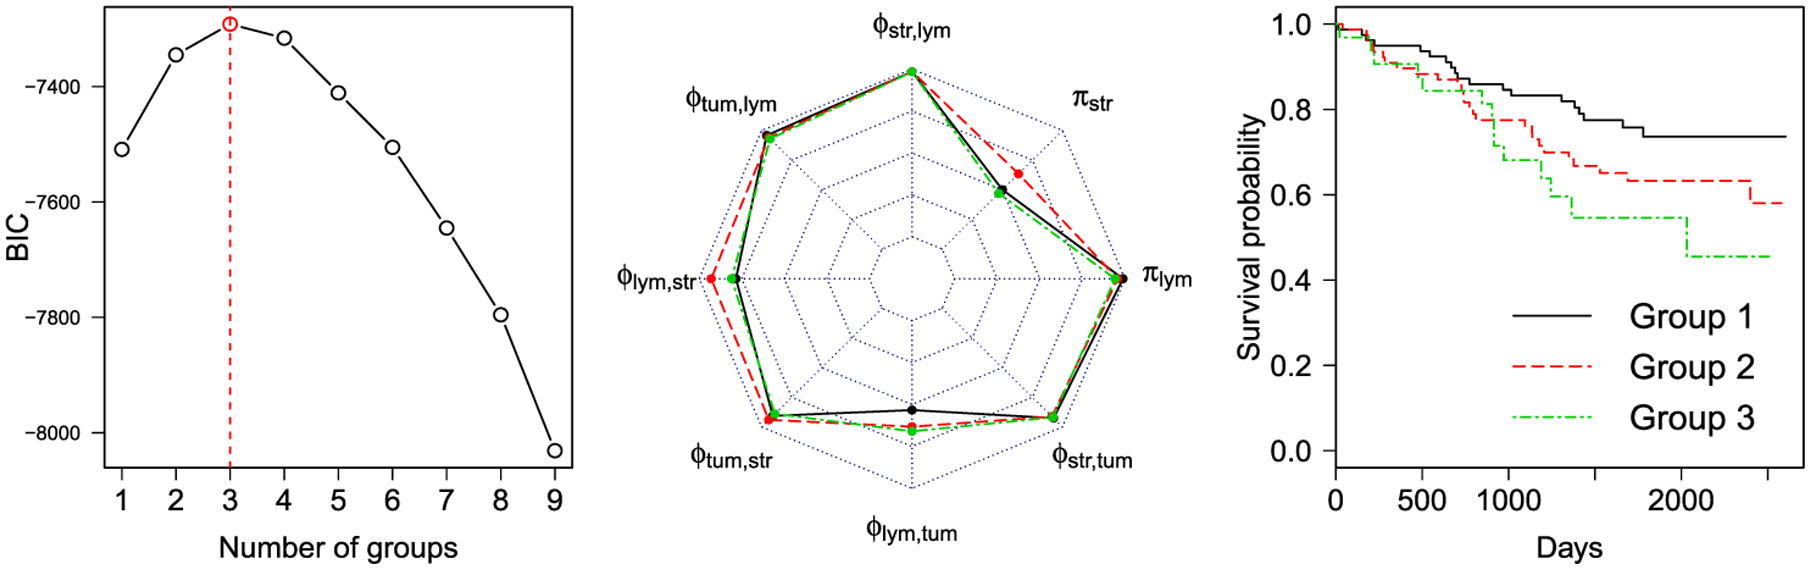
With the advance of imaging technology, digital pathology imaging of tumor tissue slides is becoming a routine clinical procedure for cancer diagnosis. This process produces massive imaging data that capture histological details in high resolution. Recent developments in deep-learning methods have enabled us to identify and classify individual cells from digital pathology images at large scale. Reliable statistical approaches to model the spatial pattern of cells can provide new insight into tumor progression and shed light on the biological mechanisms of cancer. We consider the problem of modeling spatial correlations among three commonly seen cells observed in tumor pathology images. A novel geostatistical marking model with interpretable underlying parameters is proposed in a Bayesian framework. We use auxiliary variable MCMC algorithms to sample from the posterior distribution with an intractable normalizing constant. We demonstrate how this model-based analysis can lead to sharper inferences than ordinary exploratory analyses, by means of application to three benchmark datasets and a case study on the pathology images of 188 lung cancer patients. The case study shows that the spatial correlation between tumor and stromal cells predicts patient prognosis. This statistical methodology not only presents a new model for characterizing spatial correlations in a multitype spatial point pattern conditioning on the locations of the points, but also provides a new perspective for understanding the role of cell-cell interactions in cancer progression.
Keywords: Markov random field; Multitype point pattern; double Metropolis-Hastings; spatial correlation.
Figures
Similar articles
-
A Bayesian hidden Potts mixture model for analyzing lung cancer pathology images.Biostatistics. 2019 Oct 1;20(4):565-581. doi: 10.1093/biostatistics/kxy019. Biostatistics. 2019. PMID: 29788035 Free PMC article.
-
A Bayesian modified Ising model for identifying spatially variable genes from spatial transcriptomics data.Stat Med. 2022 Oct 15;41(23):4647-4665. doi: 10.1002/sim.9530. Epub 2022 Jul 24. Stat Med. 2022. PMID: 35871762
-
Bayesian hidden mark interaction model for detecting spatially variable genes in imaging-based spatially resolved transcriptomics data.Front Genet. 2024 Apr 25;15:1356709. doi: 10.3389/fgene.2024.1356709. eCollection 2024. Front Genet. 2024. PMID: 38725485 Free PMC article.
-
Artificial Intelligence in Lung Cancer Pathology Image Analysis.Cancers (Basel). 2019 Oct 28;11(11):1673. doi: 10.3390/cancers11111673. Cancers (Basel). 2019. PMID: 31661863 Free PMC article. Review.
-
[Aiming for zero blindness].Nippon Ganka Gakkai Zasshi. 2015 Mar;119(3):168-93; discussion 194. Nippon Ganka Gakkai Zasshi. 2015. PMID: 25854109 Review. Japanese.
Cited by
-
Deciphering cell to cell spatial relationship for pathology images using SpatialQPFs.Sci Rep. 2024 Nov 28;14(1):29585. doi: 10.1038/s41598-024-81383-1. Sci Rep. 2024. PMID: 39609630 Free PMC article.
-
Spatial molecular profiling: platforms, applications and analysis tools.Brief Bioinform. 2021 May 20;22(3):bbaa145. doi: 10.1093/bib/bbaa145. Brief Bioinform. 2021. PMID: 32770205 Free PMC article. Review.
-
Lung Cancer Computational Biology and Resources.Cold Spring Harb Perspect Med. 2022 Feb 1;12(2):a038273. doi: 10.1101/cshperspect.a038273. Cold Spring Harb Perspect Med. 2022. PMID: 34751162 Free PMC article. Review.
-
SPARTIN: a Bayesian method for the quantification and characterization of cell type interactions in spatial pathology data.Front Genet. 2023 May 18;14:1175603. doi: 10.3389/fgene.2023.1175603. eCollection 2023. Front Genet. 2023. PMID: 37274781 Free PMC article.
-
ConvPath: A software tool for lung adenocarcinoma digital pathological image analysis aided by a convolutional neural network.EBioMedicine. 2019 Dec;50:103-110. doi: 10.1016/j.ebiom.2019.10.033. Epub 2019 Nov 22. EBioMedicine. 2019. PMID: 31767541 Free PMC article.
References
-
- Amin MB, Tamboli P, Merchant SH, Ordóñez NG, Ro J, Ayala AG and Ro JY (2002). Micropapillary component in lung adenocarcinoma: A distinctive histologic feature with possible prognostic significance. Amer. J. Surg. Pathol 26 358–364. - PubMed
-
- Avalos G and Bucci F (2014). Exponential decay properties of a mathematical model for a certain fluid-structure interaction. In New Prospects in Direct, Inverse and Control Problems for Evolution Equations. Springer INdAM Ser. 10 49–78. Springer, Cham.
-
- Baddeley A (2010). Multivariate and marked point processes. In Handbook of Spatial Statistics (Gelfand AE, Diggle P, Guttorp P and Fuentes M, eds.). Chapman & Hall/CRC Handb. Mod. Stat. Methods 371–402. CRC Press, Boca Raton, FL.
-
- Baddeley A and Turner R (2006). Modelling spatial point patterns in R. In Case Studies in Spatial Point Process Modeling. Lect. Notes Stat 185 23–74. Springer, New York.
Grants and funding
LinkOut - more resources
Full Text Sources