

On the impact of publicly available news and information transfer to financial markets
- PMID: 34350010
- PMCID: PMC8316821
- DOI: 10.1098/rsos.202321
On the impact of publicly available news and information transfer to financial markets
Abstract
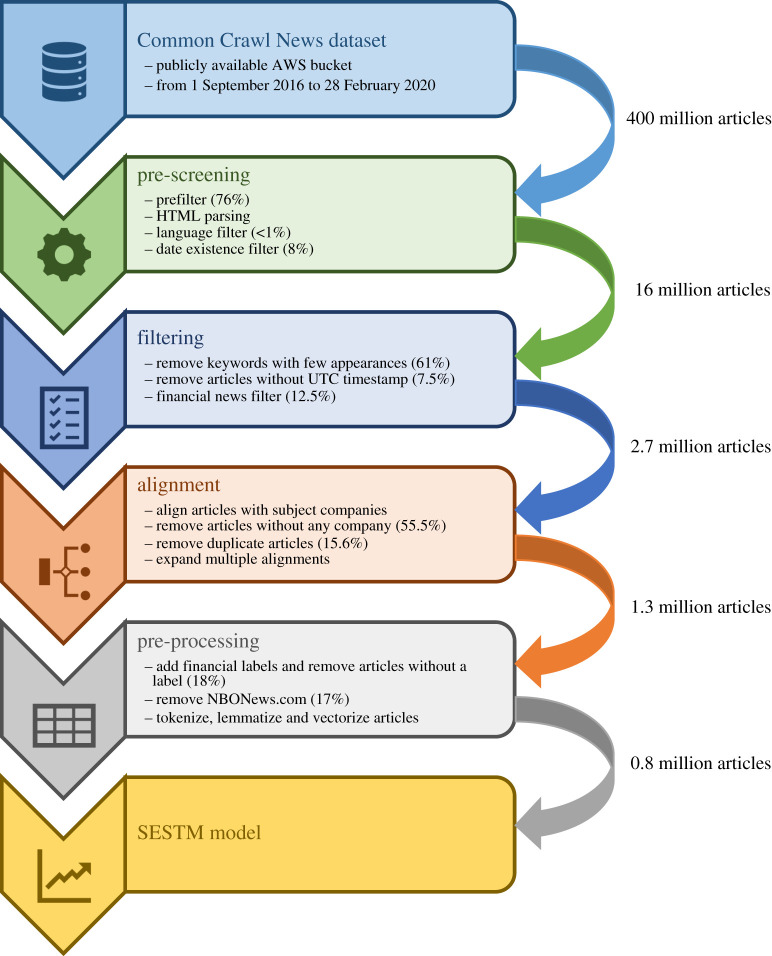
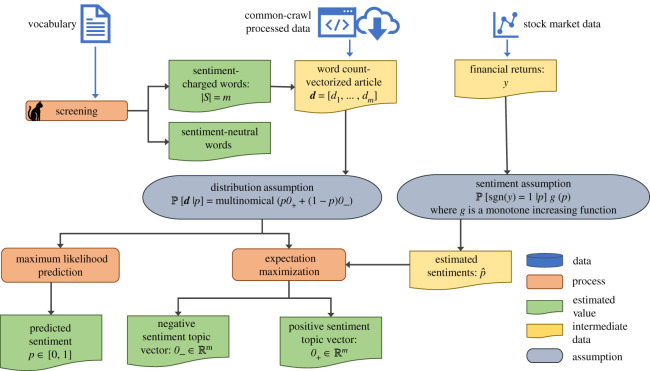
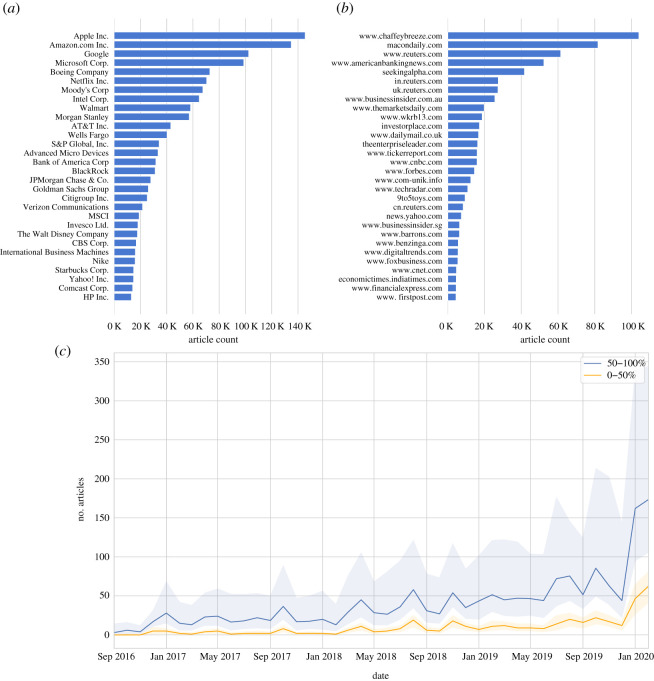
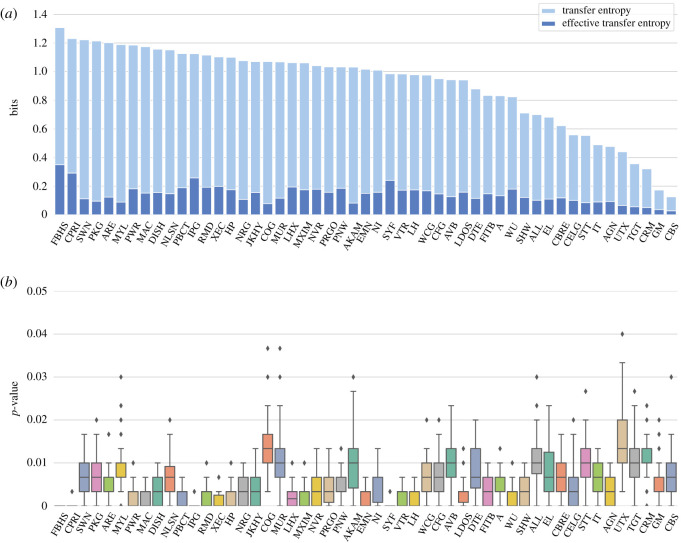
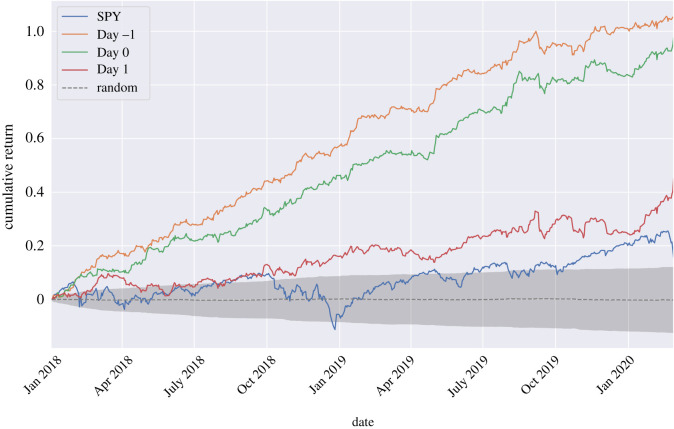
We quantify the propagation and absorption of large-scale publicly available news articles from the World Wide Web to financial markets. To extract publicly available information, we use the news archives from the Common Crawl, a non-profit organization that crawls a large part of the web. We develop a processing pipeline to identify news articles associated with the constituent companies in the S&P 500 index, an equity market index that measures the stock performance of US companies. Using machine learning techniques, we extract sentiment scores from the Common Crawl News data and employ tools from information theory to quantify the information transfer from public news articles to the US stock market. Furthermore, we analyse and quantify the economic significance of the news-based information with a simple sentiment-based portfolio trading strategy. Our findings provide support for that information in publicly available news on the World Wide Web has a statistically and economically significant impact on events in financial markets.
Keywords: complex systems; financial markets; machine learning; sentiment analysis; transfer entropy.
© 2021 The Authors.
Figures
Similar articles
-
Machine learning sentiment analysis, COVID-19 news and stock market reactions.Res Int Bus Finance. 2023 Jan;64:101881. doi: 10.1016/j.ribaf.2023.101881. Epub 2023 Jan 16. Res Int Bus Finance. 2023. PMID: 36687319 Free PMC article.
-
Twitter Sentiment Analysis and Influence on Stock Performance Using Transfer Entropy and EGARCH Methods.Entropy (Basel). 2022 Jun 25;24(7):874. doi: 10.3390/e24070874. Entropy (Basel). 2022. PMID: 35885097 Free PMC article.
-
High quality topic extraction from business news explains abnormal financial market volatility.PLoS One. 2013 Jun 6;8(6):e64846. doi: 10.1371/journal.pone.0064846. Print 2013. PLoS One. 2013. PMID: 23762258 Free PMC article.
-
The Applicability of Self-Play Algorithms to Trading and Forecasting Financial Markets.Front Artif Intell. 2021 May 31;4:668465. doi: 10.3389/frai.2021.668465. eCollection 2021. Front Artif Intell. 2021. PMID: 34136801 Free PMC article. Review.
-
Systematic literature review of the performance characteristics of Chebyshev polynomials in machine learning applications for economic forecasting in low-income communities in sub-Saharan Africa.SN Bus Econ. 2022;2(12):184. doi: 10.1007/s43546-022-00328-w. Epub 2022 Nov 10. SN Bus Econ. 2022. PMID: 36407751 Free PMC article. Review.
Cited by
-
Causality-driven multivariate stock movement forecasting.PLoS One. 2024 Apr 25;19(4):e0302197. doi: 10.1371/journal.pone.0302197. eCollection 2024. PLoS One. 2024. PMID: 38662755 Free PMC article.
References
-
- Bachelier L. 1900. Théorie de la spéculation. Annales scientifiques de l’École Normale Supérieure17, 21–86.
-
- Mandelbrot B. 1963. The variation of certain speculative prices. J. Bus. 36, 394-419. (10.1086/294632) - DOI
-
- Jarrow R, Protter P. 2004. A short history of stochastic integration and mathematical finance: the early years, 1880–1970. In A festschrift for Herman Rubin (ed. A DasGupta), pp. 75–91. Beachwood, OH: Institute of Mathematical Statistics.
-
- Fama EF. 1970. Efficient capital markets: a review of theory and empirical work. J. Finance 25, 383-417. (10.2307/2325486) - DOI
-
- Clark PK. 1973. A subordinated stochastic process model with finite variance for speculative prices. Econometrica 41, 135-155. (10.2307/1913889) - DOI
Publication types
Associated data
LinkOut - more resources
Full Text Sources
