

The risk for a new COVID-19 wave and how it depends on R 0, the current immunity level and current restrictions
- PMID: 34350017
- PMCID: PMC8316802
- DOI: 10.1098/rsos.210386
The risk for a new COVID-19 wave and how it depends on R 0, the current immunity level and current restrictions
Abstract
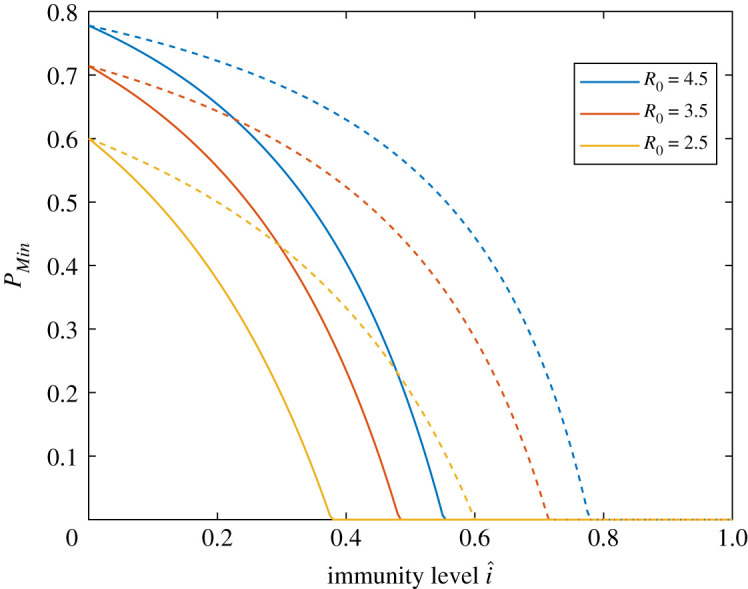
The COVID-19 pandemic has hit different regions differently. The current disease-induced immunity level î in a region approximately equals the cumulative fraction infected, which primarily depends on two factors: (i) the initial potential for COVID-19 in the region (R 0), and (ii) the preventive measures put in place. Using a mathematical model including heterogeneities owing to age, social activity and susceptibility, and allowing for time-varying preventive measures, the risk for a new epidemic wave and its doubling time are investigated. Focus lies on quantifying the minimal overall effect of preventive measures p Min needed to prevent a future outbreak. It is shown that î plays a more influential roll than when immunity is obtained from vaccination. Secondly, by comparing regions with different R 0 and î it is shown that regions with lower R 0 and low î may need higher preventive measures (p Min) compared with regions having higher R 0 but also higher î, even when such immunity levels are far from herd immunity. Our results are illustrated on different regions but these comparisons contain lots of uncertainty due to simplistic model assumptions and insufficient data fitting, and should accordingly be interpreted with caution.
Keywords: COVID-19; basic reproduction number; immunity; modelling; prevention.
© 2021 The Authors.
Figures

References
-
- Diekmann O, Heesterbeek H, Britton T. 2013. Mathematical tools for understanding infectious disease dynamics. Princeton, NJ: Princeton University Press.
-
- Gomes MGM et al. 2020. Individual variation in susceptibility or exposure to SARS-CoV-2 lowers the herd immunity threshold. MedRxiv. (10.1101/2020.04.27.20081893). - DOI
Associated data
LinkOut - more resources
Full Text Sources
