. 2021 Aug;71(2):416-424.
doi: 10.2144/btn-2021-0006. Epub 2021 Aug 5.

Unbiased automated quantitation of ROS signals in live retinal neurons of Drosophila using Fiji/ImageJ

Affiliations

Unbiased automated quantitation of ROS signals in live retinal neurons of Drosophila using Fiji/ImageJ

Prajakta Deshpande et al. Biotechniques. 2021 Aug.

Abstract

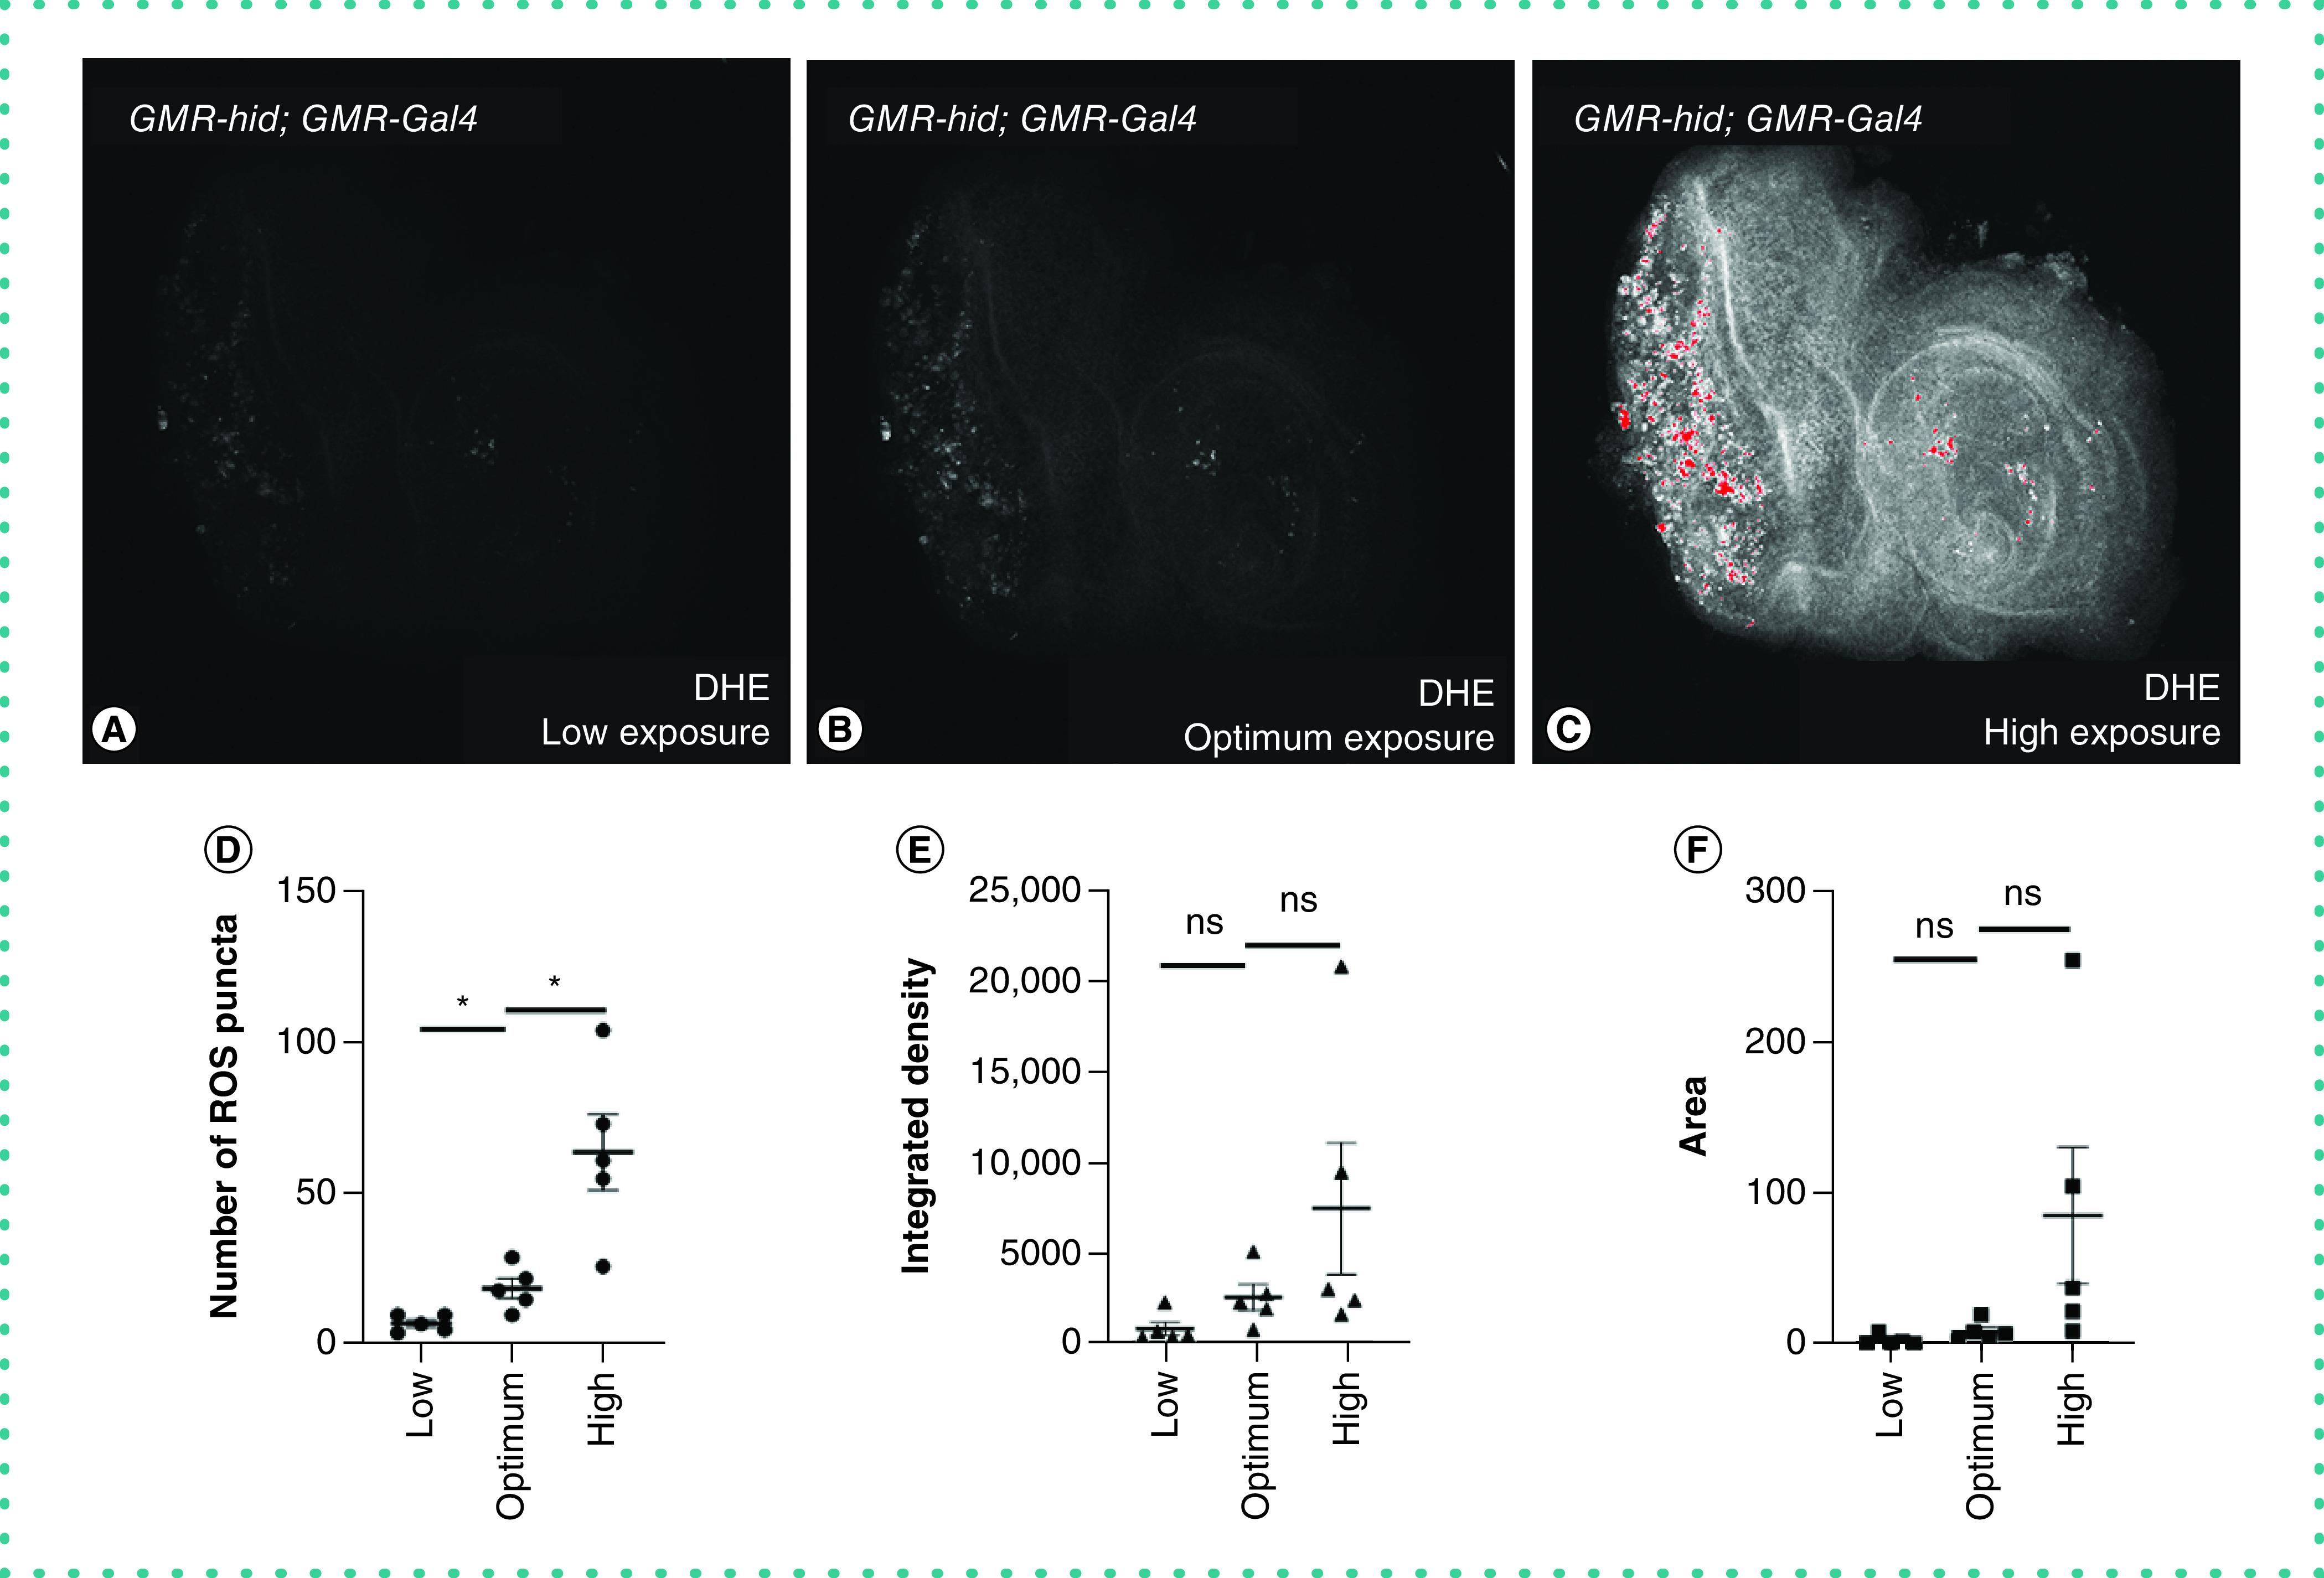
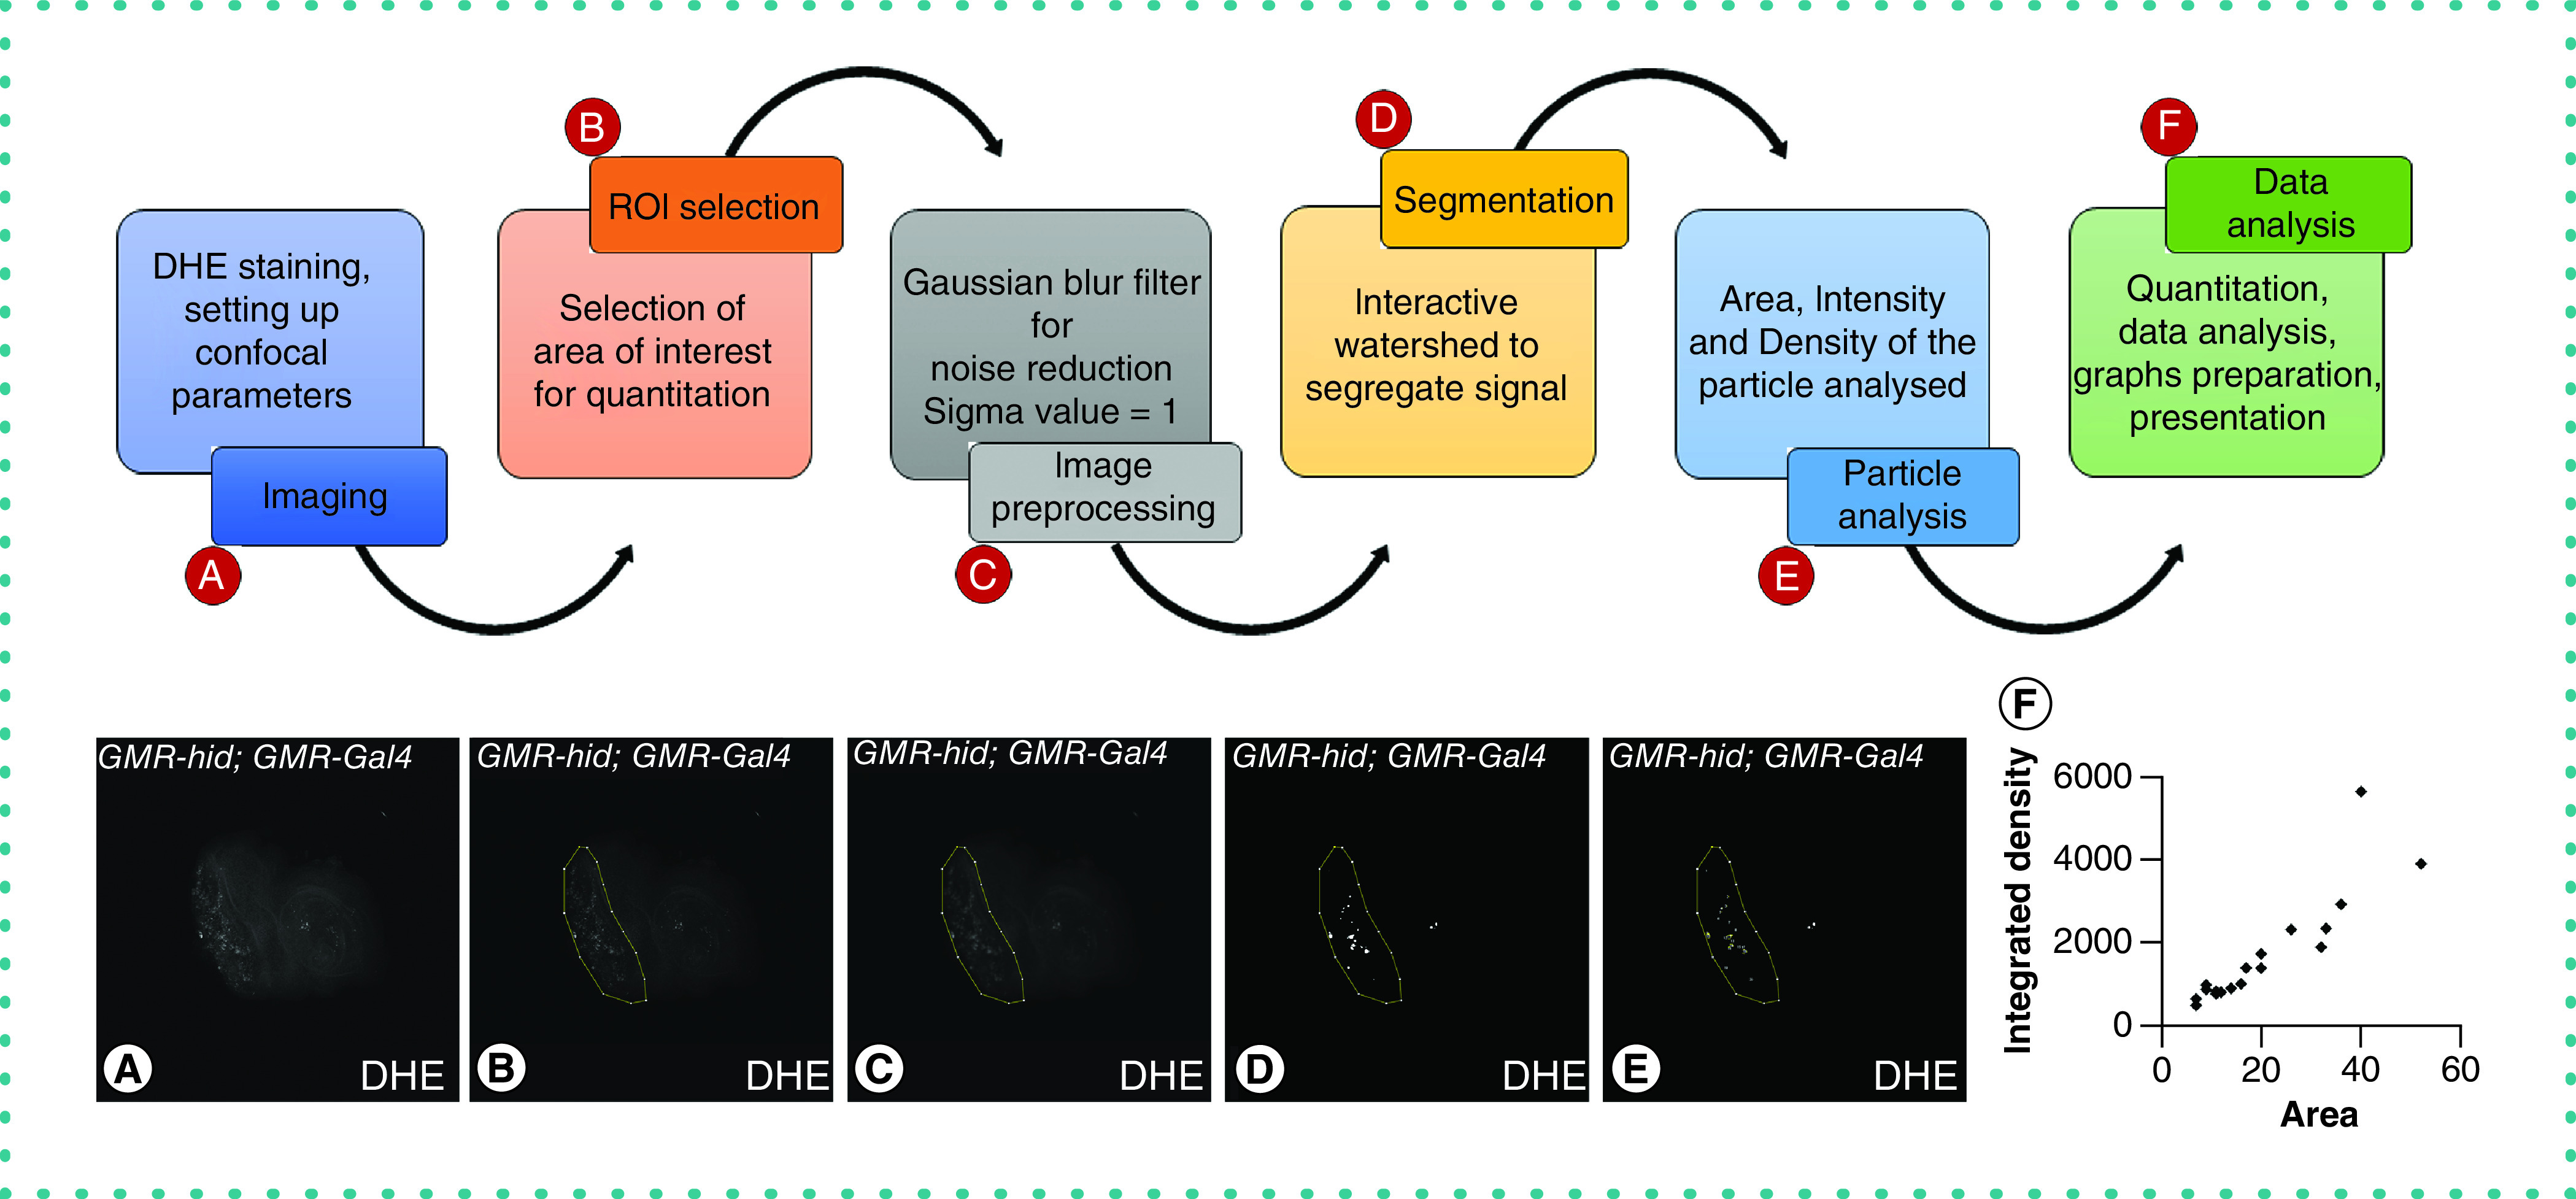
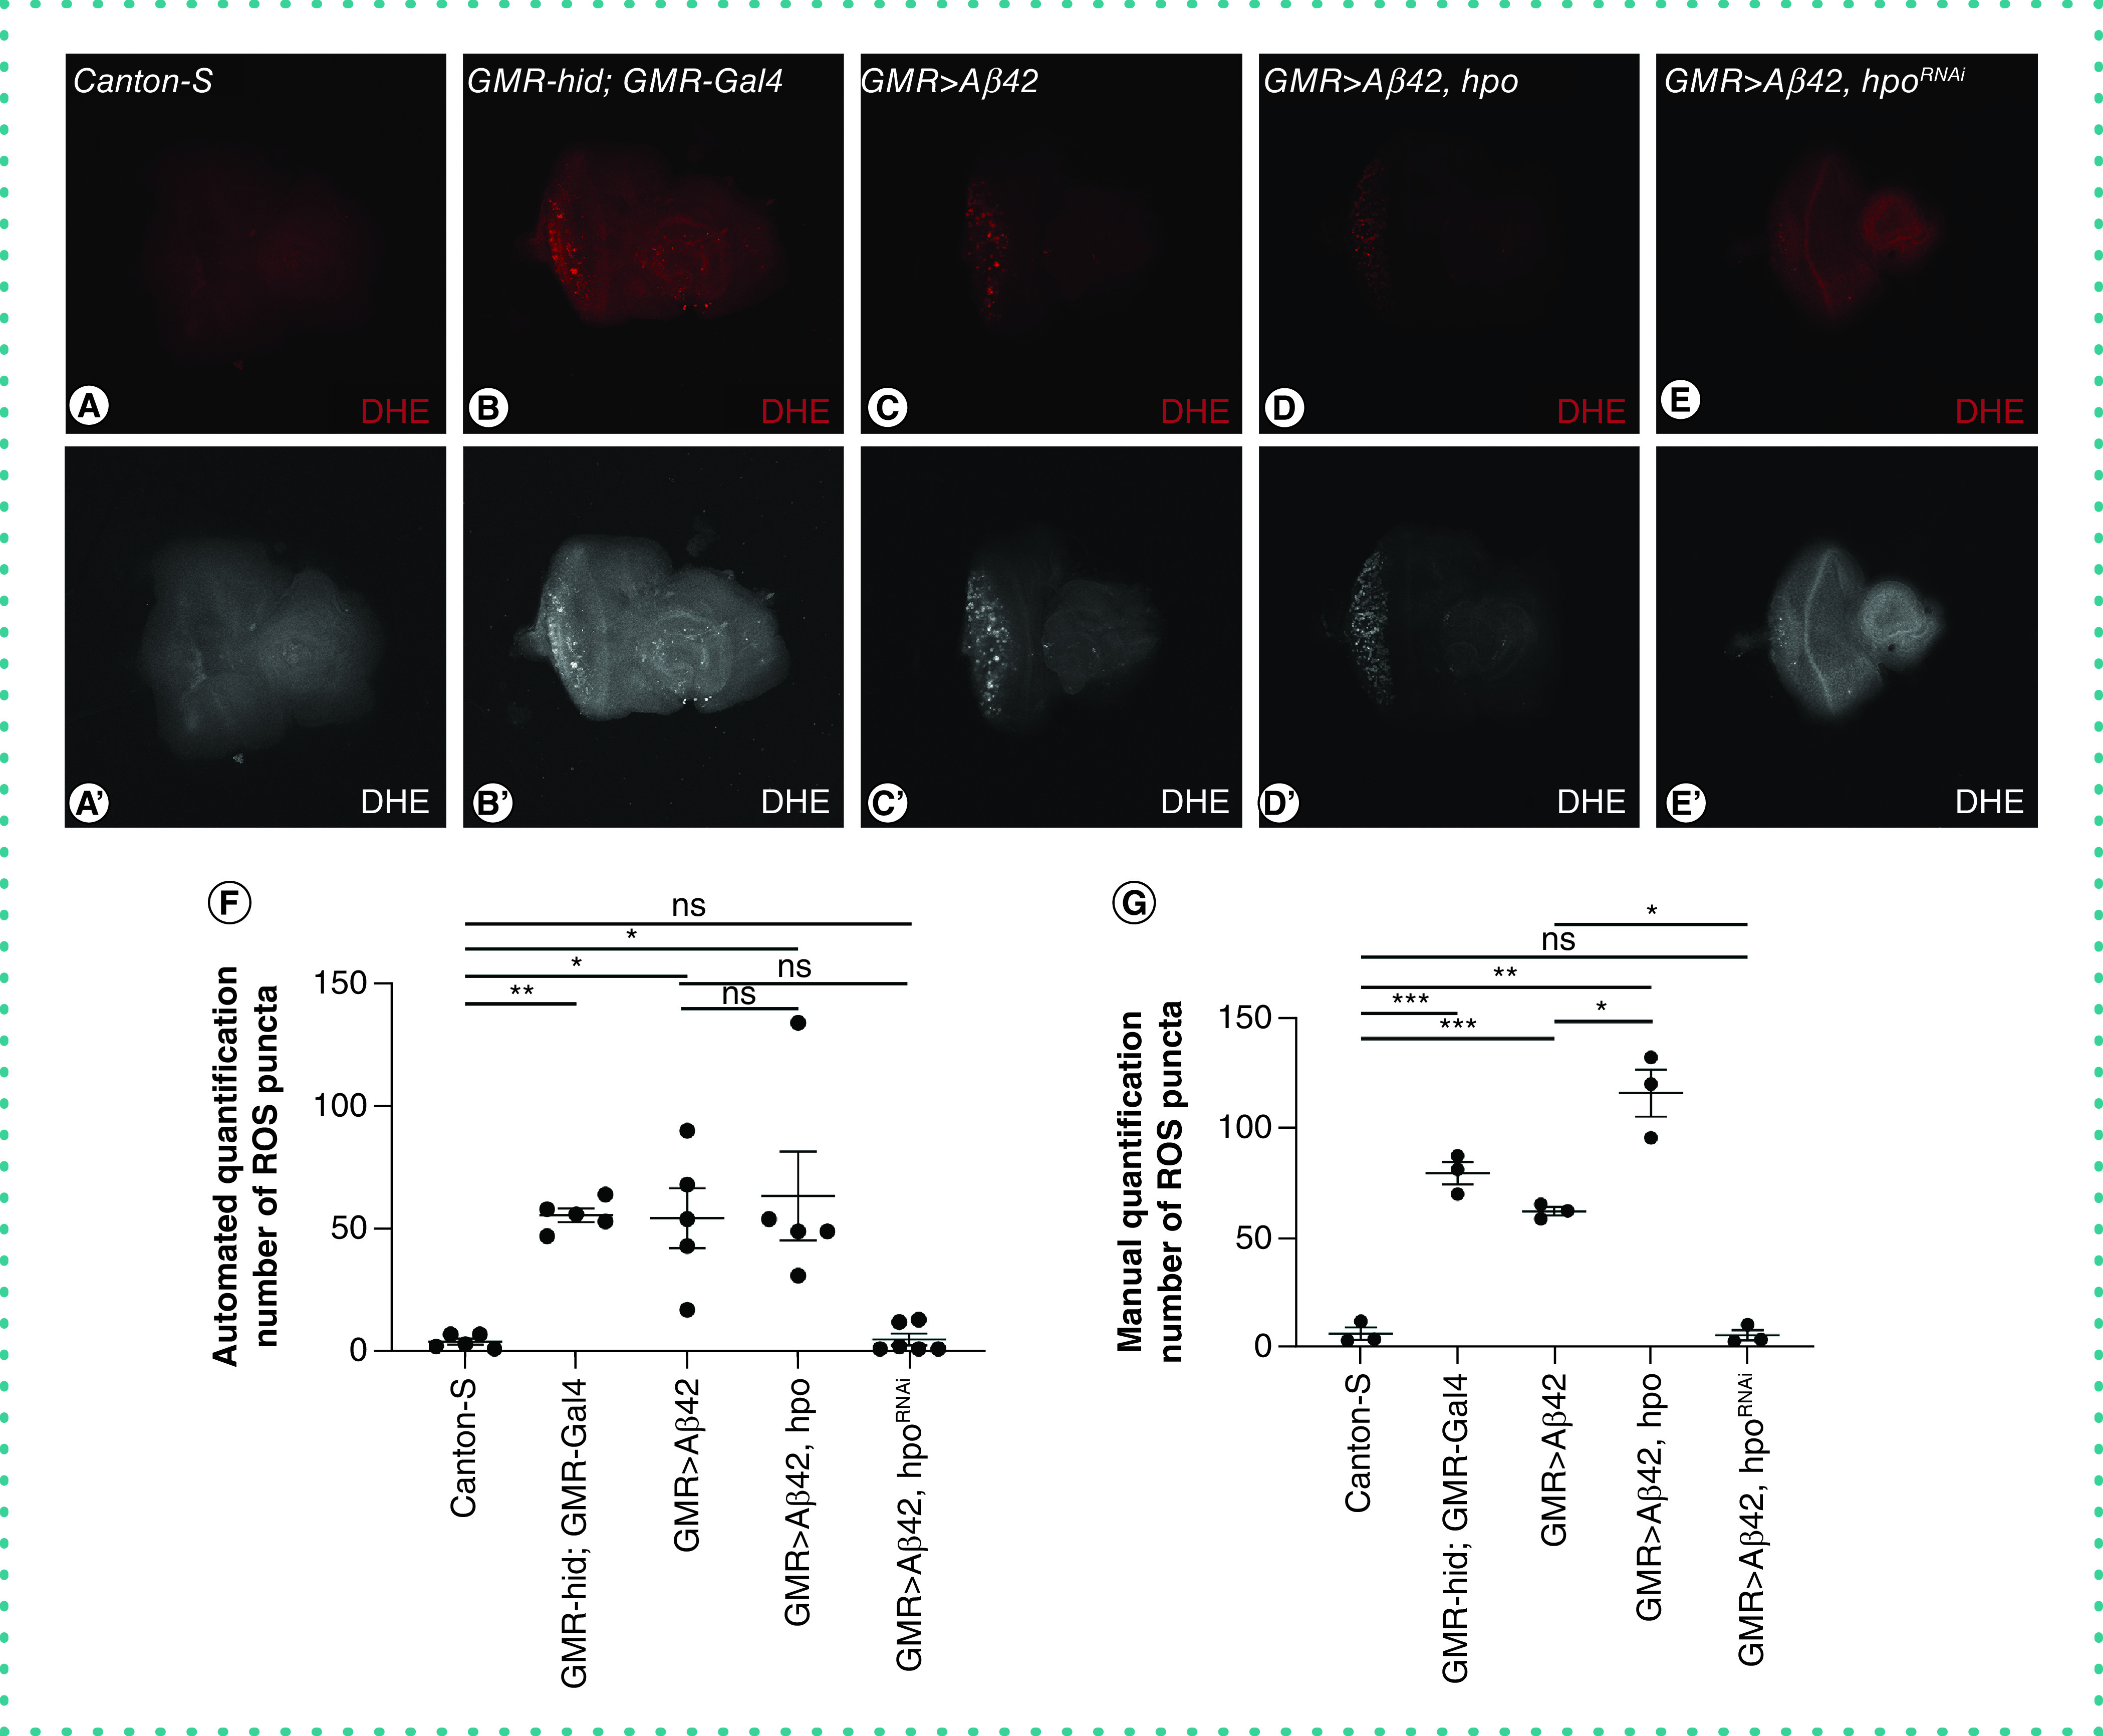
Numerous imaging modules are utilized to study changes that occur during cellular processes. Besides qualitative (immunohistochemical) or semiquantitative (Western blot) approaches, direct quantitation method(s) for detecting and analyzing signal intensities for disease(s) biomarkers are lacking. Thus, there is a need to develop method(s) to quantitate specific signals and eliminate noise during live tissue imaging. An increase in reactive oxygen species (ROS) such as superoxide (O2-) radicals results in oxidative damage of biomolecules, which leads to oxidative stress. This can be detected by dihydroethidium staining in live tissue(s), which does not rely on fixation and helps prevent stress on tissues. However, the signal-to-noise ratio is reduced in live tissue staining. We employ the Drosophila eye model of Alzheimer's disease as a proof of concept to quantitate ROS in live tissue by adapting an unbiased method. The method presented here has a potential application for other live tissue fluorescent images.

Keywords: Alzheimer's disease; Drosophila; ImageJ; automated quantitation; confocal microscopy; dihydroethidium; live cell imaging; neurodegeneration; oxidative stress; reactive oxygen species.


Conflict of interest statement

The authors have no other relevant affiliations or financial involvement with any organization or entity with a financial interest in or financial conflict with the subject matter or materials discussed in the manuscript apart from those disclosed.

Figures

Figure 1.
Figure 1.. Ideal imaging conditions are required to quantify reactive oxygen species.
DHE, a fluorescent probe, is used to detect the ROS produced inside the cell. (A–C) The third instar larval eye-antennal imaginal discs from GMR-hid; GMR-Gal4 larvae (n = 5) were stained with DHE (grayscale) and imaged under laser scanning confocal microscopy (Olympus Fluoview 3000) at (A) low, (B) optimal and (C) high exposure (high HV setting, highly saturated signal: red saturation in image) conditions as per saturation levels. Note that the ROS are randomly distributed in the eye and are present as distinct puncta. (D–F) Scatter plots of data from five discs for low, optimal and high settings (represented mean ± standard error of the mean). These graphs represent (D) number of ROS puncta, (E) integrated density and (F) area across the settings. The p-values were calculated in a set of five (n = 5) using Student's t-test. Magnification of all eye-antennal imaginal discs is 20×. Statistical significance in each graph is shown by ***p < 0.001; **p < 0.01; *p < 0.05 and ns. DHE: Dihydroethidium; ns: Nonsignificant; ROS: Reactive oxygen species.
Figure 2.
Figure 2.. Workflow diagram of key steps in automated quantitation for live cell imaging to observe reactive oxygen species using DHE staining.
(A–F) Image shows summary of steps for unbiased quantitation in Fiji/ Image-J. It shows how the final ROIs are selected and analyzed using watershed and particle analysis. (A) The workflow and analysis of one representative image. The tissue samples are first dissected and subjected to DHE staining (grayscale) and are imaged under laser scanning confocal microscopy. (B) The live tissue images are then subjected to automated quantitation using Fiji/ImageJ software where the first step is selection of ROI. (C) The image is then processed using appropriate filter to reduce background noise. (D) The processed image is subjected to H-interactive watershed algorithms to segment each ROS signal for further analysis. (E) The parameters to quantitate are set, and all segments are subjected to analysis to obtain results. (F) The data are analyzed, interpreted and subjected to further statistical analysis and representation. Graphical representation in the form of scatter plot depicts the area (x-axis) against their respective intensities (y-axis). DHE: Dihydroethidium; ROI: Region of interest.
Figure 3.
Figure 3.. Quantitation of reactive oxygen species production between controls and experimental treatments in the fly model of Alzheimer's disease.
Panel shows the third instar larval eye-antennal imaginal discs of (A) wild-type Canton-S, (B) GMR-hid; GMR-Gal4, (C) GMR>Aβ42, (D) GMR>Aβ42+hpo and (E) GMR>Aβ42+hpoRNAi were stained with DHE (red) and imaged under laser scanning confocal microscopy (Olympus Fluoview 3000) according to the optimal settings as per saturation levels. Note that the ROS are randomly distributed in the eye and are present as distinct puncta. (A′, B′, C′, D′ & E′) Eye-antennal imaginal disc showing grayscale for DHE staining. (F) Scatter plot shows automated quantitation of the average number of ROS signals from five discs for each genotype (n = 5) (represented mean ± standard error of the mean). (G) Scatter plot shows average manual quantitation of ROS signals from five discs of each genotype. Manual quantitation was performed by three people independently. The p-value was calculated using Student's t-test. Magnification of all the images is 20×. Statistical significance in each graph is shown by p-value: ***p < 0.001; **p < 0.01; *p < 0.05. DHE: Dihydroethidium; ns: Nonsignificant; ROS: Reactive oxygen species.

References

    1. Sies H, Jones DP. Reactive oxygen species (ROS) as pleiotropic physiological signalling agents. Nat. Rev. Mol. Cell Biol. 21(7), 363–383 (2020). - PubMed
    1. Liguori I, Russo G, Curcio F et al. Oxidative stress, aging, and diseases. Clin. Interv. Aging 13, 757–772 (2018). - PMC - PubMed
    1. Fang C, Gu L, Smerin D et al. The interrelation between reactive oxygen species and autophagy in neurological disorders. Oxid. Med. Cell Longev. 2017, 8495160 (2017). - PMC - PubMed
    1. Manoharan S, Guillemin GJ, Abiramasundari RS et al. The role of reactive oxygen species in the pathogenesis of Alzheimer's disease, Parkinson's disease, and Huntington's disease: a mini review. Oxid. Med. Cell Longev. 2016, 8590578 (2016). - PMC - PubMed
    1. Sarkar A, Gogia N, Glenn N et al. A soy protein Lunasin can ameliorate amyloid-beta 42 mediated neurodegeneration in Drosophila eye. Sci. Rep. 8(1), 13545 (2018). - PMC - PubMed

Publication types

Substances

LinkOut - more resources