. 2021 Aug 1;224(15):jeb242135.
doi: 10.1242/jeb.242135. Epub 2021 Aug 5.

The effects of triceps surae muscle stimulation on localized Achilles subtendon tissue displacements

Affiliations

The effects of triceps surae muscle stimulation on localized Achilles subtendon tissue displacements

Nathan L Lehr et al. J Exp Biol. .

Abstract

The triceps surae muscle-tendon unit is composed of the lateral and medial gastrocnemius (MG) and soleus (SOL) muscles and three in-series elastic 'subtendons' that form the Achilles tendon. Comparative literature and our own in vivo evidence suggest that sliding between adjacent subtendons may facilitate independent muscle actuation. We aim to more clearly define the relationship between individual muscle activation and subtendon tissue displacements. Here, during fixed-end contractions, electrical muscle stimulation controlled the magnitude of force transmitted via individual triceps surae muscles while ultrasound imaging recorded resultant subtendon tissue displacements. We hypothesized that MG and SOL stimulation would elicit larger displacements in their associated subtendon. Ten young adults completed four experimental activations at three ankle angles (-20, 0 and 20 deg) with the knee flexed to approximately 20 deg: MG stimulation (STIMMG), SOL stimulation (STIMSOL), combined stimulation, and volitional contraction. At 20 deg plantarflexion, STIMSOL elicited 49% larger tendon non-uniformity (SOL-MG subtendon tissue displacement) than that of STIMMG (P=0.004). For STIMSOL, a one-way post hoc ANOVA revealed a significant main effect of ankle angle (P=0.009) on Achilles tendon non-uniformity. However, peak tendon non-uniformity decreased by an average of 61% from plantarflexion to dorsiflexion, likely due to an increase in passive tension. Our results suggest that localized tissue displacements within the Achilles tendon respond in anatomically consistent ways to differential patterns of triceps surae muscle activation, but these relations are highly susceptible to ankle angle. This in vivo evidence points to at least some mechanical independence in actuation between the human triceps surae muscle-subtendon units.

Keywords: Ankle; Biomechanics; Neuromuscular control; Plantarflexor; Ultrasound.


Conflict of interest statement

Competing interests The authors declare no competing or financial interests.

Figures

Fig. 1.
Fig. 1.
Depiction of experimental setup illustrating a typical subject's right medial gastrocnemius (MG, blue), lateral gastrocnemius (green) and soleus (SOL, red). With the knee flexed to 20 deg, surface electrodes stimulated the MG and/or SOL muscles at three different ankle angles (20 deg plantarflexion, 0 deg and 20 deg dorsiflexion) while ultrasound recorded Achilles subtendon tissue displacements.
Fig. 2.
Fig. 2.
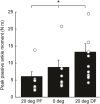
Group mean (±s.e.m.; n=10) peak passive ankle moment for each ankle angle [20 deg plantarflexion (PF), 0 deg and 20 deg dorsiflexion (DF)]. Individual data points are represented by open gray circles. Asterisk (*) represents a significant difference between ankle angles (P<0.0083).
Fig. 3.
Fig. 3.
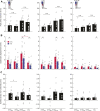
Group mean (±s.e.m.) peak ankle moment, peak individual subtendon displacement and peak Achilles tendon non-uniformity for each experimental activation at each ankle angle. Individual data points (n=10) are represented by open gray circles. (A) For peak ankle moment, consistent with our experimental design, non-significant differences between experimental activations with similar ankle moment targets (STIMMG versus STIMSOL and STIMBOTH versus VOL) are denoted as brackets labeled n.s. (P>0.05). (B) For peak individual subtendon displacement, brackets with asterisks (*) represent significant differences between stimulation activations for the SOL subtendon (red), MG (blue) or between subtendons (black) (P<0.0083). (C) For peak Achilles tendon non-uniformity, brackets with asterisks (*) represent significant differences between stimulation activations (black) (P<0.0083).
Fig. 4.
Fig. 4.
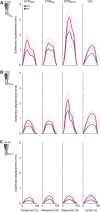
Time-normalized group mean (±s.e.m.) displacement patterns (n=10) for the MG subtendon (blue) and SOL subtendon (red) for each experimental activation. (A) 20 deg plantarflexion, (B) 0 deg neutral ankle angle and (C) 20 deg dorsiflexion.
Fig. 5.
Fig. 5.
Time-normalized group mean (s.e.m.) displacement patterns (n=10) for the magnitude of Achilles tendon tissue non-uniformity (SOL–MG subtendon displacement) for each experimental activation. (A) 20 deg plantarflexion, (B) 0 deg neutral ankle angle and (C) 20 deg dorsiflexion. Here, positive y-axis values indicate greater SOL subtendon tissue displacement relative to MG subtendon tissue displacement.

References

    1. Albracht, K., Arampatzis, A. and Baltzopoulos, V. (2008). Assessment of muscle volume and physiological cross-sectional area of the human triceps surae muscle in vivo. J. Biomech. 41, 2211-2218. 10.1016/j.jbiomech.2008.04.020 - DOI - PubMed
    1. Arndt, A., Bengtsson, A. S., Peolsson, M., Thorstensson, A. and Movin, T. (2012). Non-uniform displacement within the Achilles tendon during passive ankle joint motion. Knee Surg. Sports Traumatol. Arthrosc. 20, 1868-1874. 10.1007/s00167-011-1801-9 - DOI - PubMed
    1. Bernabei, M., Van Dieen, J. H., Baan, G. C. and Maas, H. (2015). Significant mechanical interactions at physiological lengths and relative positions of rat plantar flexors. J. Appl. Physiol. 118, 427-436. 10.1152/japplphysiol.00703.2014 - DOI - PubMed
    1. Bojsen-Moller, J., Schwartz, S., Kalliokoski, K. K., Finni, T. and Magnusson, S. P. (2010). Intermuscular force transmission between human plantarflexor muscles in vivo. J. Appl. Physiol. 109, 1608-1618. 10.1152/japplphysiol.01381.2009 - DOI - PubMed
    1. Chao, E. Y., Laughman, R. K., Schneider, E. and Stauffer, R. N. (1983). Normative data of knee joint motion and ground reaction forces in adult level walking. J. Biomech. 16, 219-233. 10.1016/0021-9290(83)90129-X - DOI - PubMed

Publication types