. 2021 Sep 1;134(17):jcs258685.
doi: 10.1242/jcs.258685. Epub 2021 Sep 6.

Activation of IRE1, PERK and salt-inducible kinases leads to Sec body formation in Drosophila S2 cells

Affiliations

Activation of IRE1, PERK and salt-inducible kinases leads to Sec body formation in Drosophila S2 cells

Chujun Zhang et al. J Cell Sci. .

Abstract

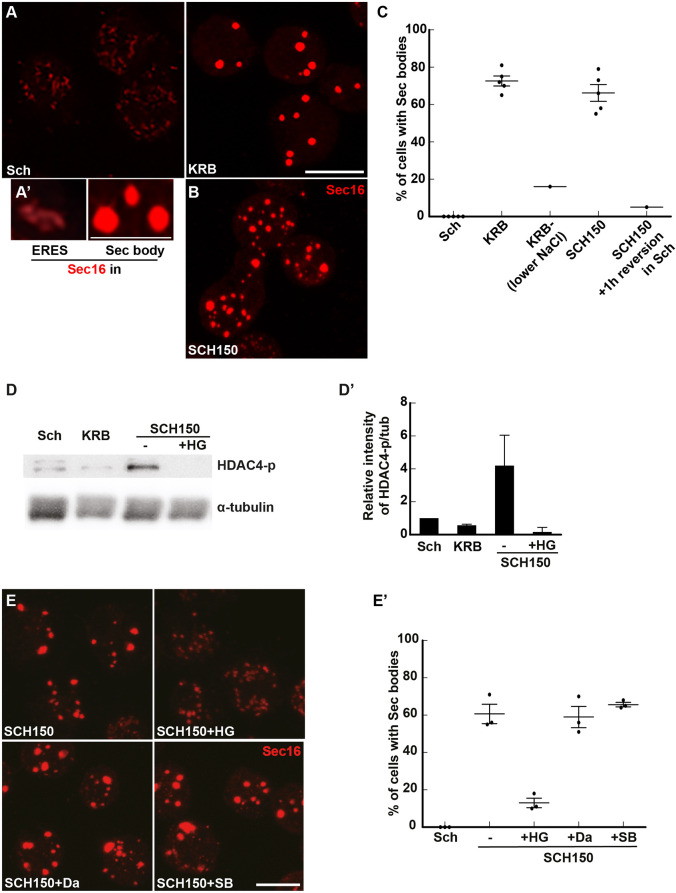
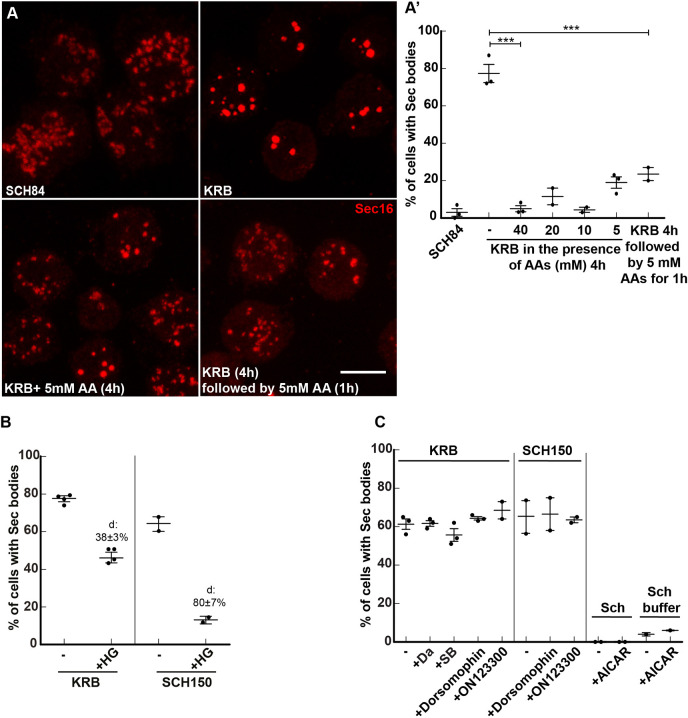
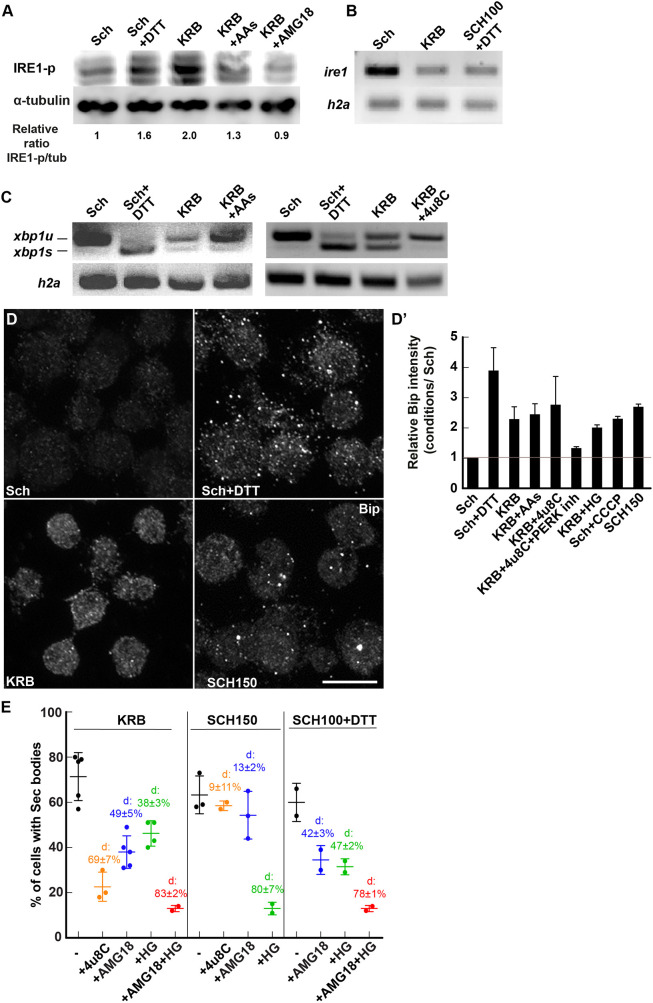
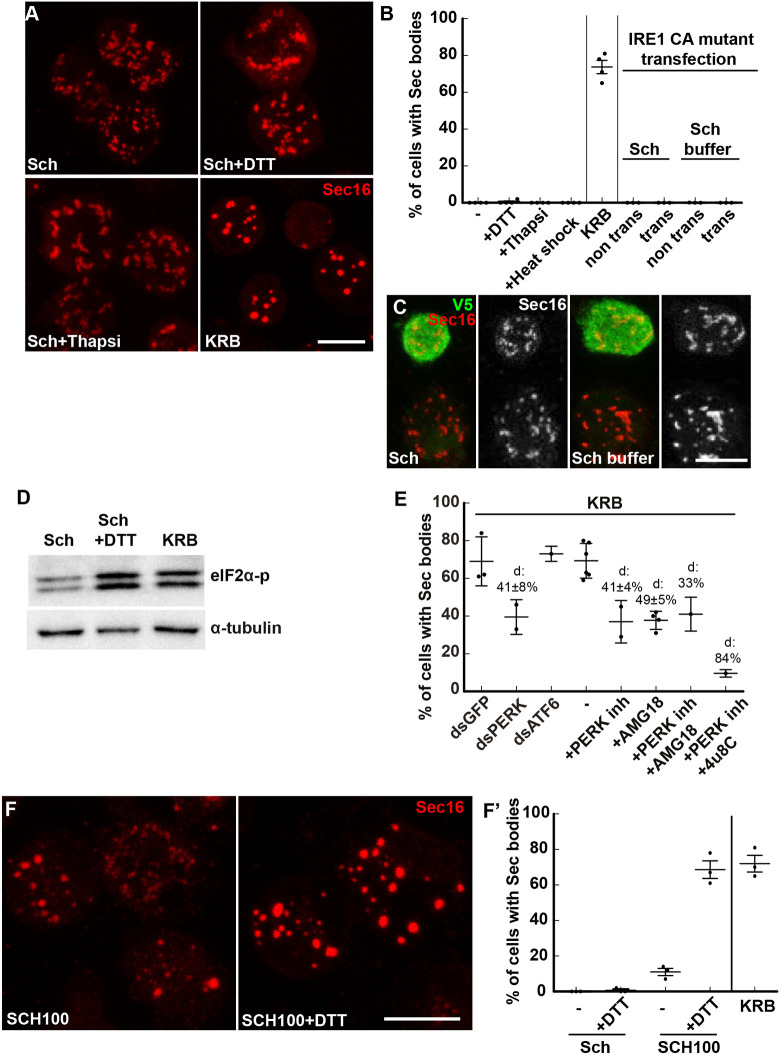
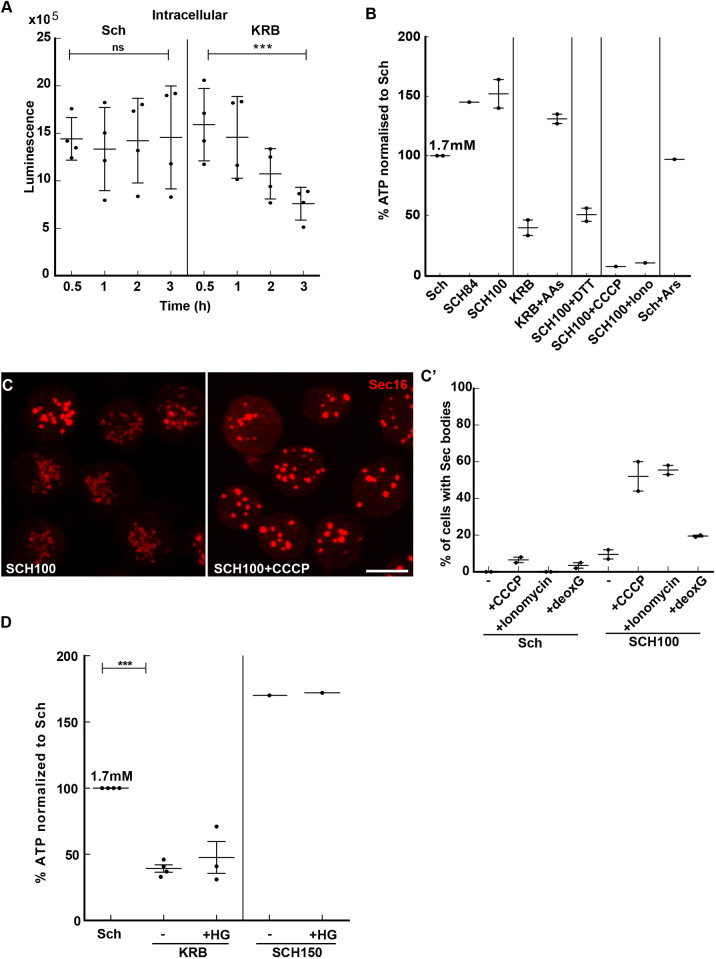
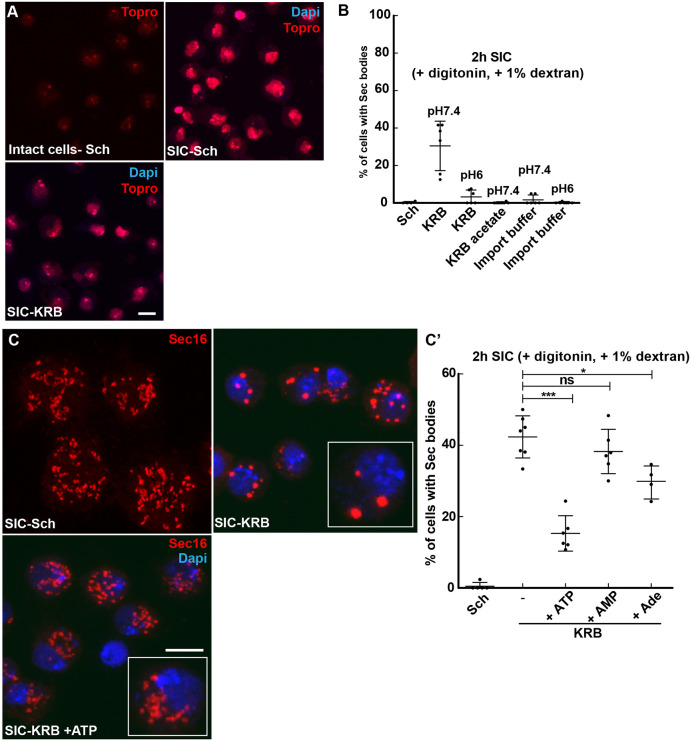
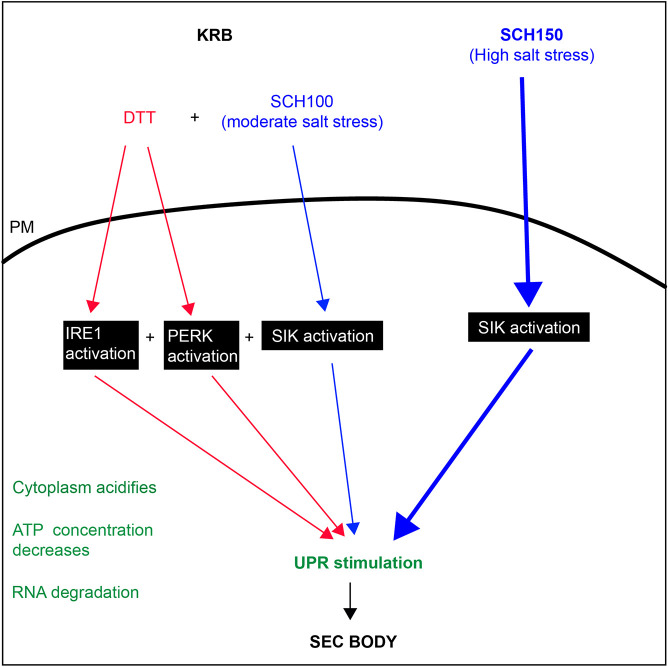
The phase separation of the non-membrane bound Sec bodies occurs in Drosophila S2 cells by coalescence of components of the endoplasmic reticulum (ER) exit sites under the stress of amino acid starvation. Here, we address which signaling pathways cause Sec body formation and find that two pathways are critical. The first is the activation of the salt-inducible kinases (SIKs; SIK2 and SIK3) by Na+ stress, which, when it is strong, is sufficient. The second is activation of IRE1 and PERK (also known as PEK in flies) downstream of ER stress induced by the absence of amino acids, which needs to be combined with moderate salt stress to induce Sec body formation. SIK, and IRE1 and PERK activation appear to potentiate each other through the stimulation of the unfolded protein response, a key parameter in Sec body formation. This work shows the role of SIKs in phase transition and re-enforces the role of IRE1 and PERK as a metabolic sensor for the level of circulating amino acids and salt. This article has an associated First Person interview with the first author of the paper.

Keywords: Drosophila S2 cells; Amino acid starvation; Phase separation; Salt stress; Sec body; Unfolded protein response.


Conflict of interest statement

Competing interests The authors declare no competing or financial interests.

Figures

Fig. 1.
Fig. 1.
Salt stress activates the SIKs, which are involved in Sec body formation. (A,A′) Immunofluorescence (IF) visualization of endogenous Sec16 in S2 cells growing in Schneider's medium (Sch) and in cells incubated in KRB (A). Note the difference in the Sec16 pattern; Sec16 is at ER exit sites in growing cells and in Sec bodies in cells incubated in KRB. Upon KRB incubation, ERES remodel into larger structures, the Sec bodies, that are brighter than ERES. (B) IF visualization of Sec body formation (marked by Sec16) in cells incubated in Schneider's medium supplemented with 10 mM sodium bicarbonate and 150 mM of NaCl (SCH150) for 4 h at 26°C. (C) Quantification of Sec body formation (marked by Sec16) in cells incubated in Sch, KRB, KRB with lower NaCl (containing only 60 mM NaCl) and SCH150 for 4 h at 26°C as well as SCH150 and then in Sch for 1 h (reversion), showing that SCH150-induced Sec bodies are formed reversibly. (D,D′) Western blot of S2 cells protein extract after incubation in Schneider's medium (Sch), KRB and SCH150 with and without HG-9-91-01 (5 µM) for 4 h at 26°C blotted for HDAC4-p and α-tubulin. Quantification of the ratio HDAC4-p to α-tubulin (D′). (E,E′) IF Visualization (E) and quantification (E′) of Sec body formation (marked by Sec16) in cells incubated in SCH150 supplemented or not with the SIK inhibitor HG-9-91-01 (HG, 5 µM), the Src inhibitor dasatinib (Da, 20 µM) and the p38 MAPK inhibitor SB203580 (SB, 30 µM) for 4 h at 26°C. Scale bars: 10 µm. Errors bars: s.e.m.
Fig. 2.
Fig. 2.
Amino acid starvation enhances cell salt stress-induced Sec body formation. (A,A′) Immunofluorescence (IF) visualization (A) and quantification (A′) of Sec body formation (marked by Sec16) in cells incubated in SCH84, KRB, KRB supplemented with 5–40 mM amino acids (AA) for 4 h at 26°C, as well as KRB for 4 h followed by addition of 5 mM amino acids for 1 h at 26°C. (B) Quantification of Sec body formation (marked by Sec16) in cells incubated in KRB and SCH150 with or without the SIK inhibitor HG-9-91-01(5 µM). (C) Quantification of Sec body formation (marked by Sec16) in cells incubated in KRB and SCH150 with or without the Src inhibitor dasatinib (Da, 20 µM), the p38 MAPK inhibitor SB203580 (SB, 30 µM), Dorsomorphin (1 µM) and ON123300 (10 µM) for 4 h at 26°C, as well in cells incubated in Schneider's medium (Sch) and Schneider's medium buffer supplemented with or without the AMPK activator AICAR (1 mM). ‘d’ indicates the mean±s.e.m. decrease in Sec body formation when compared to the absence of inhibitors. Scale bars: 10 µm. Errors bars: s.e.m.
Fig. 3.
Fig. 3.
KRB incubation activates IRE1. (A) Western blot visualization of IRE1-p (using the anti IRE1-p antibody, Genentech) in cells in Schneider's medium (Sch), Sch+DTT (5 mM), KRB, KRB+amino acids (AAs) (5 mM) and KRB+AMG18 (10 µM) for 4 h after blotting. Note that KRB incubation elicits IRE1-p more strongly than Sch+DTT, and that addition of AAs to KRB partially reverses this phosphorylation. Addition of the IRE1 kinase attenuator AMG18 (10 µM) strongly inhibits IRE1-p formation. Quantification underneath is the ratio of IRE1-p (middle band) to α-tubulin for the blot shown. (B) Visualization of the PCR products of ire1 and h2a mRNAs from cells incubated in Sch, KRB and SCH100+DTT for 4 h at 26°C. (C) Visualization of spliced (xbp1s) and unspliced (xbp1u) PCR products of xbp1 upon conditions indicated on the panel. (D,D′) Immunofluorescence visualization (D) of the protein Bip in cells incubated in the conditions indicated on the panel. Quantification is in D′. Note that the UPR is stimulated in KRB and many other conditions. (E) Quantification of Sec body formation (marked by Sec16) in cells incubated in KRB, SCH150 or SCH100+DTT with or without 4u8C (30 µM), AMG18 (10 µM), HG (5 µM) or AMG18+HG. ‘d’ indicates the mean±s.e.m. decrease in Sec body formation when compared to the absence of inhibitors. P-value (SCH150 and SCH150+AMG18) is 0.104 and the P-value (KRB and KRB+HG) is 0.0019. The other differences are highly significant (<10−4). Errors bars: s.e.m. Scale bar: 10 µm.
Fig. 4.
Fig. 4.
KRB incubation is mimicked by a moderate salt stress combined with activation of IRE1 and PERK. (A–C) Immunofluorescence (IF) micrographs of Sec16 in cells in Schneider's medium (Sch), KRB, Sch supplemented with DTT (5 mM) and thapsigargin (Thapsi, 2 µM) for 4 h at 26°C (A). Overexpression of the constitutively active (CA) IRE1 mutant tagged by V5 (in green) in cells incubated in Sch and Schneider's buffer (C). A quantification of the percentage of cells with Sec bodies is shown in B. Trans, transfected. (D) Western blot visualization of eIF2α-p in cells in Sch, Sch+DTT (5 mM) and KRB. (E) Quantification of Sec body formation (marked by Sec16) upon PERK depletion, PERK inhibition (5 µM), combined inhibition of PERK and IRE1 kinase (AMG18), and PERK and IRE1 nuclease (4u8C), as well as ATF6 depletion upon KRB incubation for 4 h at 26°C. ‘d’ indicates the mean±s.e.m. decrease in Sec body formation. (F,F′) Visualization (F) of Sec body formation (marked by Sec16) in cells incubated in SCH100 and SCH100+DTT (5 mM) for 4 h at 26°C. Quantification in F′. Errors bars: s.e.m. Scale bars: 10 µm.
Fig. 5.
Fig. 5.
The decrease of the intracellular ATP level is one driving factor for Sec body formation. (A) Luminescence intensity measuring the intracellular ATP concentration of S2 cells during incubation in Schneider's medium (Sch) and KRB. Note that the ATP concentration decreases by 48% after 4 h incubation in KRB. ns, not significant; ***P<0.001. (B) Quantification of the change in the intracellular ATP concentration (percentage when compared to Sch, which is set to 100%) after 4 h incubation in the different conditions presented on the panel (see Table 1 and Table S2). AA, amino acids; Iono, ionomycin; Ars, arenite. (C,C′) Visualization of Sec16 (C) and quantification (C′) of Sec body formation (marked by Sec16) in cells supplemented by CCCP (25 µM), ionomycin (2.8 µM) and 2-deoxyglucose (deoxG; 20 mM) for 4 h at 26°C. (D) Quantification of the change in the intracellular ATP concentration (percentage when compared to Sch, which is set to 100%) upon SIK inhibition with HG-9-91-01 (HG, 5 µM) in KRB and SCH150. Scale bar: 10 µm. Errors bars: s.e.m.
Fig. 6.
Fig. 6.
Addition of ATP to semi-intact cells prevents Sec body formation. (A) Visualization of S2 cells permeabilization using the non-membrane permeant TO-PRO-3 in intact cells in Schneider's medium (Sch) and in semi-intact cells (SICs;+10 µg/ml digitonin,+1% dextran) incubated in Sch and KRB for 2 h at 26°C. Note that TO-PRO-3 stains the nucleus only in the SIC system. (B) Effect of buffer composition in the formation of Sec bodies in SICs for 2 h at 26°C. Decreasing the pH of KRB from 7.4 to 6 decreases the efficiency of Sec body formation. Replacing Cl by acetate in the KRB and replacing KRB by the import buffer (20 mM HEPES, 110 mM KAc, 2 mM MgAc and 0.5 mM EGTA) abolishes Sec body formation. (C,C′) Immunofluorescence visualization of Sec16 (red, C) and quantification of Sec body formation (C′) (marked by Sec16) in the SIC system for cells incubated in Sch, in KRB and in KRB supplemented with 0.5 mM ATP, 0.5 mM AMP and 0.5 mM Adenosine. Cells in the white box are magnified 2.5 times. Scale bars: 10 µm. Errors bars: s.d. ns, not significant; *P<0.05, ***P<0.001.
Fig. 7.
Fig. 7.
Activation of SIK, IRE1 and PERK and SIK to form Sec bodies. Blue pathway, Sec bodies can form upon high-salt stress (SCH150) through SIK activation, which, when strong is sufficient. A moderate salt stress also activates SIKs, but it is not enough to stimulate Sec body formation. Red pathway: amino acid starvation in KRB leads to IRE1, PERK and SIK activation leading to Sec body formation (mimicked by SCH100+DTT). IRE1 and PERK activation are necessary but not sufficient. In green are features appearing upon KRB incubation, such as cytoplasm acidification, a decrease in the cytoplasmic ATP concentration and the stimulation of the UPR that we propose to be a key factor in Sec body formation.

References

    1. Aguilera-Gomez, A., van Oorschot, M. M., Veenendaal, T. and Rabouille, C. (2016). In vivo vizualisation of mono-ADP-ribosylation by dPARP16 upon amino-acid starvation. eLife 5, e21475. 10.7554/eLife.21475 - DOI - PMC - PubMed
    1. Aulas, A., Fay, M. M., Lyons, S. M., Achorn, C. A., Kedersha, N., Anderson, P. and Ivanov, P. (2017). Stress-specific differences in assembly and composition of stress granules and related foci. J. Cell Sci. 130, 927-937. - PMC - PubMed
    1. Bah, A. and Forman-Kay, J. D. (2016). Modulation of intrinsically disordered protein function by post-translational modifications. J. Biol. Chem. 291, 6696-6705. 10.1074/jbc.R115.695056 - DOI - PMC - PubMed
    1. Bounedjah, O., Hamon, L., Savarin, P., Desforges, B., Curmi, P. A. and Pastré, D. (2012). Macromolecular crowding regulates assembly of mRNA stress granules after osmotic stress: new role for compatible osmolytes. J. Biol. Chem. 287, 2446-2458. 10.1074/jbc.M111.292748 - DOI - PMC - PubMed
    1. Boyce, M. and Yuan, J. (2006). Cellular response to endoplasmic reticulum stress: a matter of life or death. Cell Death Differ. 13, 363-373. 10.1038/sj.cdd.4401817 - DOI - PubMed

Publication types

MeSH terms

Substances