. 2021 Oct 4;153(10):e202012778.
doi: 10.1085/jgp.202012778. Epub 2021 Aug 5.

Analysis methods and quality criteria for investigating muscle physiology using x-ray diffraction

Affiliations

Analysis methods and quality criteria for investigating muscle physiology using x-ray diffraction

John M Squire et al. J Gen Physiol. .

Abstract

X-ray diffraction studies of muscle have been tremendously powerful in providing fundamental insights into the structures of, for example, the myosin and actin filaments in a variety of muscles and the physiology of the cross-bridge mechanism during the contractile cycle. However, interpretation of x-ray diffraction patterns is far from trivial, and if modeling of the observed diffraction intensities is required it needs to be performed carefully with full knowledge of the possible pitfalls. Here, we discuss (1) how x-ray diffraction can be used as a tool to monitor various specific muscle properties and (2) how to get the most out of the rest of the observed muscle x-ray diffraction patterns by modeling where the reliability of the modeling conclusions can be objectively tested. In other x-ray diffraction methods, such as protein crystallography, the reliability of every step of the process is estimated and quoted in published papers. In this way, the quality of the structure determination can be properly assessed. To be honest with ourselves in the muscle field, we need to do as near to the same as we can, within the limitations of the techniques that we are using. We discuss how this can be done. We also use test cases to reveal the dos and don'ts of using x-ray diffraction to study muscle physiology.


Figures

Figure 1.
Figure 1.
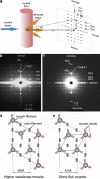
Schematic diagram of the geometry of a fiber x-ray diffraction pattern. (a) A narrow, monochromatic beam of x rays entering from the left impinges on the (vertical) fiber, which diffracts the x rays onto a screen or detector. Typical fiber diffraction patterns consist of a symmetrical pattern of horizontal lines of intensity known as “layer lines,” with the layer line through the pattern center known as the equator. The central vertical axis is the meridian. The axial positions of the layer lines (S) tell us about the axial periodicities of the diffracting objects in the fiber, provided the x-ray wavelength (λ) and the camera length (D) are known. The angle of diffraction (2θ) is tan−1 (S/D). This can be put into Bragg’s law (nλ = 2 d sin θ) to calculate the value of d, the spacing in the diffracting object. Bragg’s law shows that the larger d is, the smaller is 2θ; there is a reciprocal relationship between the spacings in diffracting objects and the positions of the diffraction spots that they give rise to. The middle of a diffraction pattern provides low-resolution information, and the resolution increases as spots occur farther away from the center. For fibers that are well ordered in 3-D, the horizontal layer lines will be broken up into spots of intensity that lie along vertical row lines. In diffraction patterns from well-ordered muscles, the equator and layer lines are all sampled on the same row lines, which provide information about the lattice of filaments in the muscle, particularly the A-band. Less well-ordered muscles may have sampling along the equator, but not along the layer lines. Fig. 1 a is reproduced from Squire and Knupp (2017). (b) Low-angle x-ray diffraction pattern from bony fish muscle in the relaxed state (Harford and Squire, 1986). Meridional peaks are labeled M3, M6, and so forth, and myosin layer lines are labeled ML1, ML2, and so forth. For details, see text. (c) Low-angle x-ray diffraction pattern from insect flight muscle in the relaxed state (courtesy of Prof. Mike Reedy, Duke University, Durham, NC). Labeling is similar to b. (d) The A-band lattice in higher-vertebrate fast muscles such as those in frog sartorius showing different rotations of the myosin filaments around their long axes, producing a superlattice structure (Huxley and Brown, 1967; Luther and Squire, 1980, 2014). (e) The equivalent lattice to d but for simple lattice muscles such as bony fish muscle, where all the myosin filaments have exactly the same rotations forming a regular, quasi-crystalline A-band (Harford and Squire, 1986; Luther and Squire, 1980). The quoted lattice dimensions are approximate; there is variation between muscles and with sarcomere length. Fig. 1, d and e, is modified from Luther and Squire (1980).
Figure 2.
Figure 2.
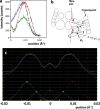
Fitting x-ray reflections. (a) Intensity profile along the sixth actin layer line at ∼59 Å from bony fish muscle in three different states: resting muscle (green), rigor muscle at 2.2-µm sarcomere length (blue), and rigor muscle at 2.5-µm sarcomere length (red). Reproduced from Eakins et al. (2018). (b) The simple geometry needed to model actin/tropomyosin filament structure out to ∼45 Å resolution: four spheres for actin, one for each subdomain, and a set of equal overlapping spheres for tropomyosin. The origin for measurement of the azimuthal angle (Ø) and the axial position Z was taken as the center of actin subdomain 3. For details, see text. Adapted from Al-Khayat et al., 1995. (c) Profile of the green trace in a showing both sides of the meridian (intensity vertical axis; position 0 is the meridian) and profile fitting by five overlapping Gaussian functions using PeakFit (http://sigmaplot.co.uk/products/peakfit/peakfit.php). For details, see text.
Figure 3.
Figure 3.
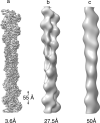
Space-filling representations of F-actin filaments at three different resolutions. (a) 3.6 Å resolution. (b) 27.5 Å resolution. (c) 50 Å resolution. Low-angle x-ray diffraction patterns from muscle actin usually show layer lines out to ∼51 Å resolution, sometimes out to the meridional reflection at 27.5 Å. Even at that higher resolution, the detail in the structure is not great. Modeling with the kind of simplified approximation in Fig. 2 b is quite justified. Courtesy of Danielle Paul and Marston Bradshaw.
Figure 4.
Figure 4.
Fourier difference synthesis and R-factor plots. (a) The best model of the bony fish muscle myosin filament in the relaxed state (data from the work of Hudson et al., 1997). Myosin heads are yellow on a gray backbone. The red and gray patches are from a Fourier difference synthesis (see text) showing where the difference density is positive (red) or negative (gray). The amplitudes of the difference densities are in fact very low, indicating that the model itself is a good one. (b and c) The sensitivity of the R-factor used in the modeling in a to variations in certain parameters. The central points (0) in the plots represent the R-factor values for the best model as in a, and the variations show the changes in the R-factor as one particular parameter is changed while all others are kept fixed at their optimal values. Very small parameter changes can cause large increases in the R-factor, showing that these parameters are important ones. If there had been no change, then the observations would not justify inclusion of that particular parameter in any modeling.
Figure 5.
Figure 5.
2-D diffraction patterns and Fourier syntheses. (a) The beautiful low-angle x-ray diffraction pattern from tarantula muscle from Padrón et al. (2020) showing myosin filament layer lines ML1, ML3, and ML6 and actin layer lines AL1 and AL6. Like vertebrate muscle, ML3 is at ∼145 Å, but the myosin filaments are four-stranded, not three-stranded as in Fig. 4 a. The layer lines are completely unsampled. Reprinted with permission from Padrón et al. (2020). (b) The symmetrical intensity profile along the equator of the low-angle x-ray diffraction pattern from bony fish muscle. The 10, 11, 20, 21, and 30 peaks come from the hexagonal unit cell of the myosin and actin filaments in the A-band, and the peak marked Z comes from the almost square lattice of actin filaments and α-actinin in the Z-band. (c and d) Electron density maps of bony fish muscle viewed down the fiber axis and calculated from the equatorial peaks out to the 30 peak: c from relaxed muscle and d from fully active muscle. Cross-bridge density (C) moves from around the myosin filaments (M) in resting muscle (c) toward the actin filaments (A) in active muscle (d). Data from Harford et al. (1994).
Figure 6.
Figure 6.
The changing populations of the three myosin head states modeled by Eakins et al. The tension time course follows a similar trend to the strong. Adapted from Eakins et al. (2016).
Figure 7.
Figure 7.
Time courses of the 10 and 11 equatorial reflections from bony fish muscle. (a) The different time courses of the equatorial 10 (blue dots) and 11 (red dots) peaks from contracting bony fish muscle relative to tension (solid line) from Eakins et al. (2016). (b) The time course of the intensity ratio I11/I10 (dots) compared with tension (solid lines) from bony fish muscle without sarcomere length control (black) and with partial sarcomere length control (red). In neither case does the intensity ratio coincide with the tension trace. Reproduced from Eakins et al. (2016).
Figure 8.
Figure 8.
Meridional reflections and interference effects. (a) Intensity profile along the meridian from frog muscle in the relaxed (top) and active states (bottom). a.u., arbitrary units. Reproduced from the work of Reconditi et al. (2014). Reflections from myosin are labeled M1, M2, and so forth. T1 comes from the troponin–tropomyosin complex. The fine sampling of the diffraction patterns comes from interference between the diffracted x rays from the two halves of the A-band as in e and f for C-protein. Peaks to the left of each trace are from the sarcomeres acting as diffraction gratings and give a direct measure of sarcomere length at least up to sarcomere length ∼3.0 µm. (b–d) 3-D reconstruction of the human cardiac muscle myosin filament shown at three different resolutions. b is the original map of AL-Khayat et al. (2013), c is the same structure shown at 72.5 Å resolution for active muscle, and d is shown at 145 Å resolution. c and d show the very low level of detail that might be expected from analysis of the M6 (∼72.5 Å) and M3 (∼145 Å) reflections alone. Figures courtesy of Dr. Edward Morris. (e and f) Analysis of the meridional peaks from C-protein around M1 along the meridian of diffraction patterns from some muscle types. The middles of the two C-zones in e are separated by the interference distance L. C-protein is a myosin filament protein and occurs on every third crown at a spacing of ∼430 Å in resting muscle. However, the outer part of C-protein can extend across to actin (Squire et al., 2003; Luther et al., 2011), where it binds, on average, at a slightly different spacing of ∼440 Å. The net effect is a C-protein meridional peak from one-half A-band at ∼434 Å. For some muscles, this is then sampled by the interference function to give two unequal peaks, one at ∼442 Å stronger than one ∼417 Å (f). In other muscles, with a slightly different interference spacing L, an interference peak is almost coincident with the center of the underlying C-protein peak, and a single strong M1 peak is seen (e.g., as in a). Reproduced from Squire et al. (2003).
Figure 9.
Figure 9.
Effects of axial perturbations on the meridional reflections. (a–c) Lower plots: Possible densities along myosin filaments in vertebrate striated muscles. (a) C-protein represented as Gaussian peaks every 434 Å (D, protein density; I, x-ray intensity). (b and c) Two different sets of myosin crown spacings a, b, and c, with systematic perturbations of the basic 143 Å crown repeat. Upper plots: Calculated diffraction intensities along the meridian for the different density profiles in the lower plots. Note that in a, there is a main C1 peak at 434 Å, but there may be C-protein contributions (C2) close to the M2 and beyond, depending on the C-protein density profile. Note in b and c that the relative intensities of the M2–M6 peaks depend very much on the particular axial perturbation that is involved. In both cases, the crown density profiles and weights are exactly the same. All the observed differences in the diffracted intensities are due to the relative axial shifts of the crowns. For discussion, see text. Reproduced from Squire et al. (1982).

Comment in

References

    1. AL-Khayat, H.A., and Squire J.M.. 2006. Refined structure of bony fish muscle myosin filaments from low-angle X-ray diffraction data. J. Struct. Biol. 155:218–229. 10.1016/j.jsb.2006.03.029 - DOI - PubMed
    1. Al-Khayat, H.A., Yagi N., and Squire J.M.. 1995. Structural changes in actin-tropomyosin during muscle regulation: computer modelling of low-angle X-ray diffraction data. J. Mol. Biol. 252:611–632. 10.1006/jmbi.1995.0524 - DOI - PubMed
    1. AL-Khayat, H.A., Hudson L., Reedy M.K., Irving T.C., and Squire J.M.. 2003. Myosin head configuration in relaxed insect flight muscle: x-ray modeled resting cross-bridges in a pre-powerstroke state are poised for actin binding. Biophys. J. 85:1063–1079. 10.1016/S0006-3495(03)74545-7 - DOI - PMC - PubMed
    1. AL-Khayat, H.A., Morris E.P., Kensler R.W., and Squire J.M.. 2008. Myosin filament 3D structure in mammalian cardiac muscle. J. Struct. Biol. 163:117–126. 10.1016/j.jsb.2008.03.011 - DOI - PMC - PubMed
    1. AL-Khayat, H.A., Kensler R.W., Squire J.M., Marston S.B., and Morris E.P.. 2013. Atomic model of the human cardiac muscle myosin filament. Proc. Natl. Acad. Sci. USA. 110:318–323. 10.1073/pnas.1212708110 - DOI - PMC - PubMed

Publication types