. 2021 Sep 6;153(9):e202112872.
doi: 10.1085/jgp.202112872. Epub 2021 Aug 5.

Evidence that toxin resistance in poison birds and frogs is not rooted in sodium channel mutations and may rely on "toxin sponge" proteins

Affiliations

Evidence that toxin resistance in poison birds and frogs is not rooted in sodium channel mutations and may rely on "toxin sponge" proteins

Fayal Abderemane-Ali et al. J Gen Physiol. .

Abstract

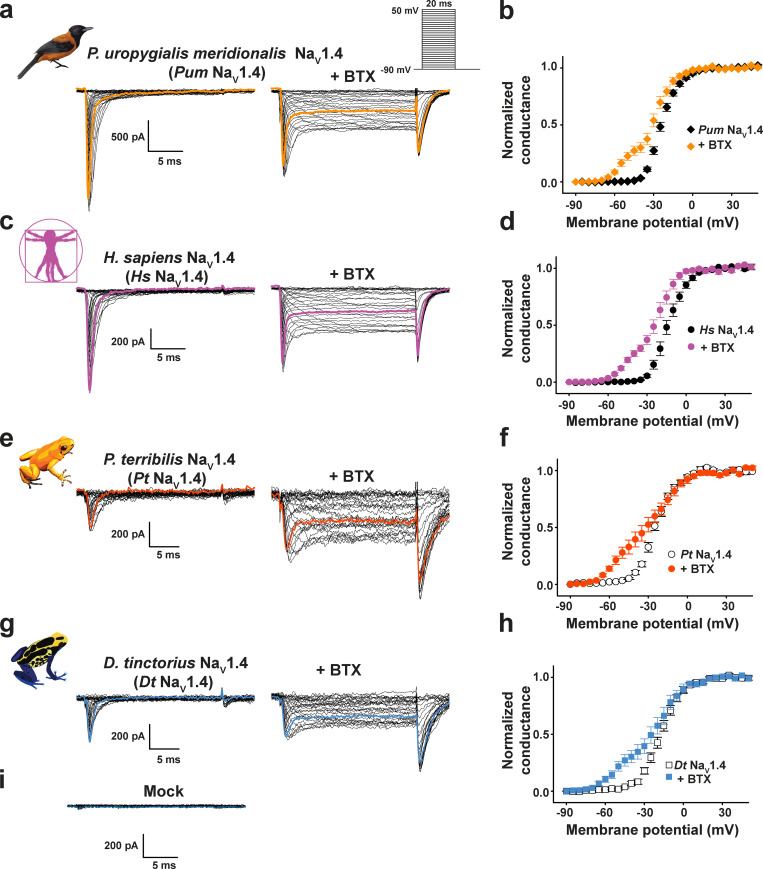
Many poisonous organisms carry small-molecule toxins that alter voltage-gated sodium channel (NaV) function. Among these, batrachotoxin (BTX) from Pitohui poison birds and Phyllobates poison frogs stands out because of its lethality and unusual effects on NaV function. How these toxin-bearing organisms avoid autointoxication remains poorly understood. In poison frogs, a NaV DIVS6 pore-forming helix N-to-T mutation has been proposed as the BTX resistance mechanism. Here, we show that this variant is absent from Pitohui and poison frog NaVs, incurs a strong cost compromising channel function, and fails to produce BTX-resistant channels in poison frog NaVs. We also show that captivity-raised poison frogs are resistant to two NaV-directed toxins, BTX and saxitoxin (STX), even though they bear NaVs sensitive to both. Moreover, we demonstrate that the amphibian STX "toxin sponge" protein saxiphilin is able to protect and rescue NaVs from block by STX. Taken together, our data contradict the hypothesis that BTX autoresistance is rooted in the DIVS6 N→T mutation, challenge the idea that ion channel mutations are a primary driver of toxin resistance, and suggest the possibility that toxin sequestration mechanisms may be key for protecting poisonous species from the action of small-molecule toxins.


Figures

Figure S1.
Figure S1.
Pitohui and poison frog NaV1.4 sequences. Sequence alignment of Pum NaV1.4, Pt NaV1.4, Dt NaV1.4, Hs NaV1.4 (RefSeq accession no. NP_000325.4), and Rn NaV1.4 (RefSeq accession no. NP_037310.1). Key NaV features are highlighted as follows: selectivity filter DEKA (red), IFM peptide (green), conserved S6 Asn (yellow), S4 voltage sensor arginines (orange), poison frog variants (cyan), and sites highlighted by Tarvin et al. (2016; magenta) are indicated. Conserved residues are highlighted in dark blue. Secondary structure elements were labeled using boundaries from Yan et al. (2017).
Figure S2.
Figure S2.
Pitohui NaV1.5 sequence. Sequence alignment of Pum NaV1.5, Hs NaV1.5 (RefSeq accession no. NP_932173.1), Rn NaV1.5 (RefSeq accession no. NP_037257.1), and Pum NaV1.4. Key NaV features are highlighted as follows: selectivity filter DEKA (red), IFM peptide (green), conserved S6 Asn (yellow), and S4 voltage sensor arginines (orange). Conserved residues are highlighted in dark blue. Secondary structure elements were labeled using boundaries from Yan et al. (2017).
Figure 1.
Figure 1.
Pitohui and poison frog NaV1.4 channels are BTX sensitive.(a, c, e, and g) Exemplar current recordings for Pum NaV1.4 (a), Hs NaV1.4 (c), Pt NaV1.4 (e), and Dt NaV1.4 (g) expressed in HEK293 cells in the absence (left) or presence (right) of 10 µM BTX. Trace at 0 mV is highlighted in each panel. Currents were evoked with the shown multistep depolarization protocol (inset in a). (b, d, f, and h) G-V relationships in the presence or absence of 10 µM BTX for Pum NaV1.4 (black diamonds), +BTX (orange diamonds; b), Hs NaV1.4 (black circles), +BTX (purple circles; d), Pt NaV1.4 (white circles), +BTX (dark orange circles; f), and Dt NaV1.4 (white squares), +BTX (blue squares; h). (i) Exemplar current recordings from mock-transfected HEK293 cells using the protocol from a.
Figure S3.
Figure S3.
Pitohui NaV1.5 and NaV1.4:NaVβ2 complexes are BTX sensitive. (a) Exemplar current recordings for Pum NaV1.5 expressed in HEK293 cells in the absence (left) or presence (right) of 10 µM BTX. Trace at 0 mV is highlighted in each panel. Currents were evoked with the shown multistep depolarization protocol (inset). (b) G-V relationships in the absence (black squares) or presence (green squares) of 10 µM BTX. (c) Sequence alignment of NaVβ2 from Pum, Hs (RefSeq accession no. NP_004579.1), and Rn (RefSeq accession no. NP_037009.1). Signal peptide (SP), secondary structural elements from Das et al. (2016), conserved disulfide bond (ss), and transmembrane domain (TM) are indicated. (d) Exemplar current recordings for Pum NaV1.4:NaVβ2 expressed in HEK293 cells in the absence (left) or presence (right) of 10 µM BTX. Trace at 0 mV is highlighted in each panel. Currents were evoked with the shown multistep depolarization protocol (inset in a). (e) G-V relationships in the absence (black hexagons) or presence (red hexagons) of 10 µM BTX.
Figure 2.
Figure 2.
Structural context for poison frog NaV amino acid changes. (aandb) Locations of poison frog NaV amino acid variants reported here (cyan) and shared with Tarvin et al. (2016) (magenta). Variants are denoted human residue:residue number:frog variant using Pt NaV1.4 numbering from Fig. S1. Residues are mapped on human NaV1.4 (Protein Data Bank accession no. 6ADF; Pan et al., 2018). NaV1.4 (white).
Figure S4.
Figure S4.
Poison frog NaV1.4s expressed in CHO cells and Xenopus oocytes are BTX sensitive.(a, c, and g) Exemplar current recordings for Dt NaV1.4 (a) and Dt NaV1.4 N1600T (c) expressed in CHO cells in the absence (left) or presence (right) of 10 µM BTX. Currents were evoked with the shown multistep depolarization protocol (inset in a). (e) Currents from mock-transfected cells using the same protocol as for a and c. Trace at 0 mV is highlighted in each panel. (b, and d) G-V relationships in the presence or absence of 10 µM BTX; Dt NaV1.4 (open squares), +BTX (light blue squares; b); and Dt NaV1.4 N1600T (purple inverted triangles; d), +BTX (light blue inverted triangles; j). (f) Current densities for mock-transfected cells (blue), Dt NaV1.4 (white), and Dt NaV1.4 N1600T (purple). (g and i) Exemplar two-electrode voltage clamp (TEVC) current recordings for Pt NaV1.4 (g) and Dt NaV1.4 (i) expressed in Xenopus oocytes in the absence (left) or presence (right) of 10 µM BTX. Trace at 0 mV is highlighted in each panel. Currents were evoked with the shown multistep depolarization protocol (inset in g). (h and j) G-V relationships in the presence or absence of 10 µM BTX, Pt NaV1.4 (black circles), +BTX (orange circles; for h); and Dt NaV1.4 (light blue squares), +BTX (green squares; j).
Figure 3.
Figure 3.
DIVS6 N→T mutation reduces BTX sensitivity of Pitohui and human but not poison frog NaV1.4s.(a, c, e, and g) Exemplar current recordings for Pum NaV1.4 N1609T (a), Hs NaV1.4 N1591T (c), Pt NaV1.4 N1600T (e), and Dt NaV1.4 N1600T (g) expressed in HEK293 cells in the absence (left) or presence (right) of 10 µM BTX. Trace at 0 mV is highlighted in each panel. Currents were evoked with the shown multistep depolarization protocol (inset in a). Cartoon shows a diagram of the identities of the S6 Asn for each construct. (b, d, f, and h) G-V relationships for Pum NaV1.4 N1609T (dark blue triangles), +BTX (orange triangles; b), Hs NaV1.4 N1591T (black triangles), +BTX (magenta triangles; d), Pt NaV1.4 N1600T (teal triangles), +BTX (dark orange triangles; f), and Dt NaV1.4 N1600T (magenta downward triangles), +BTX (cyan downward triangles; h) in the presence or absence of 10 µM BTX.
Figure S5.
Figure S5.
Functional costs of DIV-S6 Asn mutation in Rn NaV1.4.(a and c) Exemplar current recordings for Rn NaV1.4 (a) and Rn NaV1.4 N1584T (c) expressed in CHO cells in the absence (left) or presence (right) of 10 µM BTX. Trace at 0 mV is highlighted in each panel. Currents were evoked with the shown multistep depolarization protocol (inset in a). (b and d) G-V relationships in the presence or absence of 10 µM BTX, Rn NaV1.4 (open circles), +BTX (black circles; b); and Rn NaV1.4 N1584T (blue circles), +BTX (magenta circles; d). (e) G-V relationships. (f) Steady-state inactivation voltage dependencies for Rn NaV1.4 (open circles) and Rn NaV1.4 N1584T (blue circles). (g) Current densities for Rn NaV1.4 (white) and Rn NaV1.4 N1584T (blue).
Figure S6.
Figure S6.
Functional cost of DIV-S6 Asn mutation in Pum NaV1.4 and Hs NaV1.4.(a) Exemplar current recordings for Pum NaV1.4 (left), Pum NaV1.4 N1609T (middle), and Pum NaV1.4 N1609A (right) expressed in HEK293 cells. Trace at 0 mV is highlighted, and currents were evoked with the shown multistep depolarization protocol (inset). Cartoon shows a diagram of the identities of the S6 Asn for the Asn mutants. (b–d) G-V relationships (b). Steady-state inactivation voltage dependencies (c), and current densities (d) for Pum NaV1.4 (black diamonds), Pum NaV1.4 N1609T (blue triangles), and Pum NaV1.4 N1609A (teal inverted triangles). (e) Exemplar current recordings for Hs NaV1.4 (left), Hs NaV1.4 N1591T (right), expressed in HEK293 cells. Trace at 0 mV is highlighted. Currents were evoked with the shown multistep depolarization protocol from a. (f–h) G-V relationships (f), steady-state inactivation voltage dependencies (g), and current densities (h) for Hs NaV1.4 (black circles) and Hs NaV1.4 N1591T (blue diamonds). (i) Exemplar current recordings for Pum NaV1.4 N1609A (left) and in the presence of 10 µM BTX (right). (j) G-V relationships for Pum NaV1.4 N1609A (green inverted triangles) and in the presence of 10 µM BTX (orange inverted triangles).
Figure S7.
Figure S7.
Functional cost of DIV-S6 N→T mutation in poison frog NaV1.4s. (a–c) G-V relationships (a), steady-state inactivation voltage dependences (b), and current densities (c) for mock-transfected cells and Pt NaV1.4 (black circles), Pt NaV1.4 N1600T (cyan triangles), Dt NaV1.4 (grey squares), and Dt NaV1.4 N1600T (magenta downward triangles) expressed in HEK293 cells. (d–g) Exemplar current recordings for Pt NaV1.4 (d), Pt NaV1.4 N1600T (e), Dt NaV1.4 (f), and Dt NaV1.4 N1600T (g) expressed in Xenopus oocytes. 10× magnifications of Pt NaV1.4 N1600T and Dt NaV1.4 N1600T traces are shown in e and g, right panels. Trace at 0 mV is highlighted in each panel. Currents were evoked with the shown multistep depolarization protocol (inset in e). (h) Current amplitudes normalized to the amount of injected RNA for the indicated poison frog constructs.
Figure 4.
Figure 4.
Sodium channel modulation by BTX is associated with an asymmetry in the inner pore.(a, c, e, g, and i) Exemplar current recordings for Pum NaV1.4 (a), Pum NaV1.4 N432T (c), Pum NaV1.4 N830T (e), Pum NaV1.4 N1306T (g), and Pum NaV1.4 N1609T (i) expressed in HEK293 cells in the absence (left) or presence (right) of 10 µM BTX. Trace at 0 mV is highlighted in each panel. Currents were evoked with the shown multistep depolarization protocol (inset in a). Cartoon shows a diagram of the identities of the S6 Asn for each construct. (b, d, f, h, and j) G-V relationships in the presence or absence of 10 µM BTX for Pum NaV1.4 (black diamonds), +BTX (orange diamonds; b), Pum NaV1.4 N432T (dark blue squares), +BTX (orange squares; d), Pum NaV1.4 N830T (dark blue stars), +BTX (orange stars; f), Pum NaV1.4 N1306T (dark blue hexagons), +BTX (orange hexagons; h), and Pum NaV1.4 N1609T (dark blue triangles), +BTX (orange triangles; j). Data in a and b are from Fig. 1, a and b.
Figure S8.
Figure S8.
Functional studies of S6 Asn mutants support asymmetric properties of the channel pore. (a–d) Exemplar current recordings (a), G-V relationships (b), steady-state inactivation voltage dependences (c), and current densities (d) for Pum NaV1.4 (black diamonds), Pum NaV1.4 N432T (dark red squares), Pum NaV1.4 N830T (orange stars), Pum NaV1.4 N1306T (green hexagons), Pum NaV1.4 N1609T (dark blue triangles), and Pum NaV1.4 N1609A (cyan downward triangles) expressed in HEK293 cells. Trace at 0 mV is highlighted in each panel. Cartoon shows a diagram of the identities of the S6 Asn for each construct. (e and f) Side (e) and bottom (f) views of the locations the S6 conserved asparagines. Residues are mapped on the structure of human NaV1.4 (Protein Data Bank accession no. 6ADF; (Pan et al., 2018) and are labeled using the Pum NaV1.4 numbering.
Figure 5.
Figure 5.
Captivity-raised poison frogs are resistant to BTX and STX. (a–e) Challenge experiments for Xenopus (a), P. leucomystax (b), P. terribilis (c), D. tinctorius (d), and M. aurantiaca (e) with PBS (black circles), BTX (magenta circles), STX (orange triangles), or TTX (cyan diamond) injection. Gray area shows the period of anesthesia application. Active and paralyzed states of the frogs are indicated. (f) Summary of the sensitivity of the indicated species to BTX, STX, and TTX. Acc. Rec., accelerated recovery from anesthesia; Resistant, no toxin-induced death.
Figure 6.
Figure 6.
BTX competes with anesthetic agent tricaine in NaVs from poisonous species. (a–c) Exemplar two electrode voltage clamp (TEVC) recordings at 0 mV in control (black), after 0.5 mM tricaine application (orange), and after BTX injection (dark green) into the same Xenopus oocytes expressing Pt NaV1.4 (a), Dt NaV1.4 (b), and Pum NaV1.4 (c). BTX injection was performed after tricaine block of sodium current, and the recordings of the BTX effect were made while the oocyte was still exposed to tricaine. (d–f) Exemplar TEVC recordings at 0 mV before (black) or after BTX injection (light blue) into the same Xenopus oocytes expressing NaV1.4 from the indicated poisonous species. (g and h) Average peak current amplitudes normalized to the corresponding control peak current amplitude for tricaine and BTX (g) and BTX alone (h).
Figure 7.
Figure 7.
NaV1.4s from poisonous animals are STX and TTX sensitive. (a–c) Exemplar two-electrode voltage-clamp (TEVC) recordings at 0 mV before (black) and after 10 nM STX application to Xenopus oocytes expressing Pt NaV1.4 (purple; a), Dt NaV1.4 (red; b), or Pum NaV1.4 (orange; c). (d) STX dose–response curves for Pt NaV1.4 (purple circles), Dt NaV1.4 (red squares), and Pum NaV1.4 (orange diamonds). Curves show fits to the Hill equation. IC50 = 12.6 ± 1.4 nM, 14.6 ± 0.6 nM, and 7.3 ± 0.5 nM for Pt NaV1.4, Dt NaV1.4, and Pum NaV1.4, respectively. Error bars are SEM. n = 4. (e–g) Exemplar TEVC recordings at 0 mV before (black) and after 30 nM TTX application to Xenopus oocytes expressing Pt NaV1.4 (purple; e), Dt NaV1.4 (red; f), or Pum NaV1.4 (orange; g). (h) TTX dose–response curves for Pt NaV1.4 (purple circles), Dt NaV1.4 (red squares), and Pum NaV1.4 (orange diamonds). Curves show fits to the Hill equation. IC50 = 21.3 ± 1.0 nM, 40.8 ± 1.8 nM, and 6.2 ± 0.4 nM for Pt NaV1.4, Dt NaV1.4, and Pum NaV1.4, respectively. Error bars are SEM. n = 5–6.
Figure 8.
Figure 8.
Sxph rescues Pt NaV1.4 from STX block. (a) Exemplar two-electrode voltage-clamp (TEVC) recordings of Pt NaV1.4 expressed in Xenopus oocytes in the presence of 100 nM STX and [Sxph]:[STX] in the indicated molar ratios. Ctrl (black) shows response in the absence of STX. Inset shows the stimulation protocol. (b) [Sxph]:[STX] dose response from a. (c) Exemplar TEVC recordings of Pt NaV1.4 before (black) and after (red) application of 100 nM STX and then after application of Sxph at the indicated [Sxph]:[STX] molar ratio (blue-green). Inset shows the protocol. (d) Exemplar TEVC time course showing Pt NaV1.4 peak currents from c after application of 100 nM STX (red bar) and 200 nM Sxph (blue-green bar). (e) [Sxph]:[toxin] dose response for 100 nM STX (blue-green circles) and 300 nM TTX (orange diamonds). Normalized current in b and e was determined by I = (ISxph − IToxin)/(Ictrl − IToxin), where ISxph is the current after application of Sxph:STX mixtures in b or after Sxph addition for e, IToxin is the current after STX or TTX application, and ICtrl is the basal current. (f) Exemplar TEVC recordings of Pt NaV1.4 before (black) and after (magenta) application of 300 nM TTX and then after application of Sxph at the indicated [Sxph]:[TTX] molar ratio (orange). Inset shows the protocol. For all experiments, n = 5, and error bars indicate SEM.
Figure S9.
Figure S9.
Sxph reverses STX block of Pt NaV1.4. (a–f) Exemplar two-electrode voltage-clamp (TEVC) time courses showing Pt NaV1.4 peak currents after application of 100 nM STX (red bar) and the indicated concentrations of Sxph (blue-green bar). (g and h) Exemplar TEVC time courses showing Pt NaV1.4 peak currents after application of 300 nM TTX (magenta bar) and the indicated concentrations of Sxph (orange bar).

Comment in

References

    1. Albuquerque, E.X., Daly J.W., and Witkop B.. 1971. Batrachotoxin: chemistry and pharmacology. Science. 172:995–1002. 10.1126/science.172.3987.995 - DOI - PubMed
    1. Albuquerque, E.X., Warnick J.E., Sansone F.M., and Daly J.. 1973. The pharmacology of batrachotoxin. V. A comparative study of membrane properties and the effect of batrachotoxin on sartorius muscles of the frogs Phyllobates aurotaenia and Rana pipiens. J. Pharmacol. Exp. Ther. 184:315–329. - PubMed
    1. Almabruk, K.H., Dinh L.K., and Philmus B.. 2018. Self-resistance of natural product producers: past, present, and future focusing on self-resistant protein variants. ACS Chem. Biol. 13:1426–1437. 10.1021/acschembio.8b00173 - DOI - PubMed
    1. Andresen, B.M., and Du Bois J.. 2009. De novo synthesis of modified saxitoxins for sodium ion channel study. J. Am. Chem. Soc. 131:12524–12525. 10.1021/ja904179f - DOI - PMC - PubMed
    1. Arbuckle, K., Rodríguez de la Vega R.C., and Casewell N.R.. 2017. Coevolution takes the sting out of it: evolutionary biology and mechanisms of toxin resistance in animals. Toxicon. 140:118–131. 10.1016/j.toxicon.2017.10.026 - DOI - PubMed

Publication types