. 2021 Aug 1;148(15):dev199711.
doi: 10.1242/dev.199711. Epub 2021 Aug 5.

Single-cell transcriptome profiling of the human developing spinal cord reveals a conserved genetic programme with human-specific features

Affiliations

Single-cell transcriptome profiling of the human developing spinal cord reveals a conserved genetic programme with human-specific features

Teresa Rayon et al. Development. .

Abstract

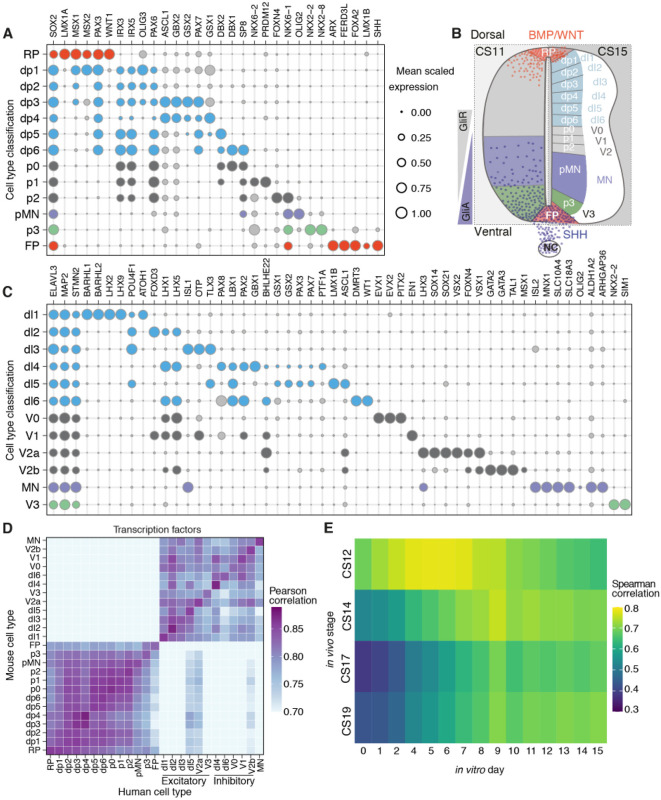
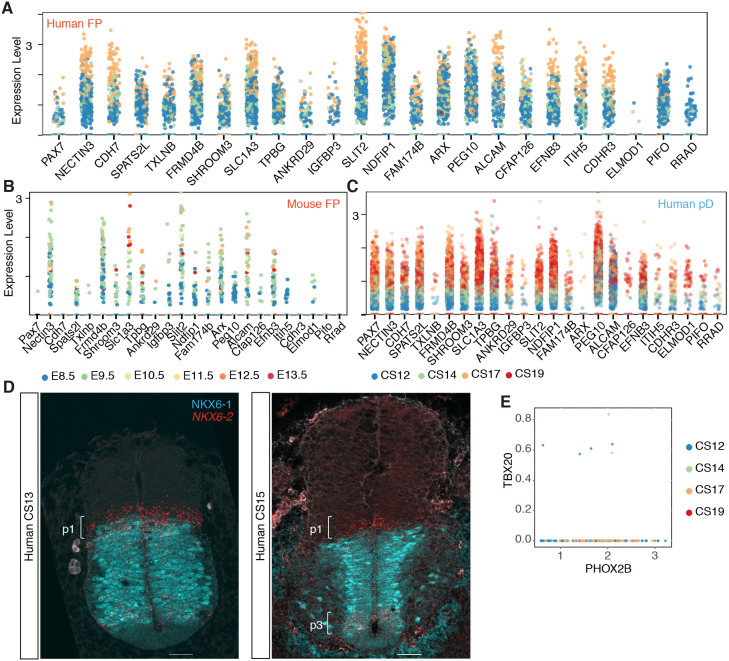
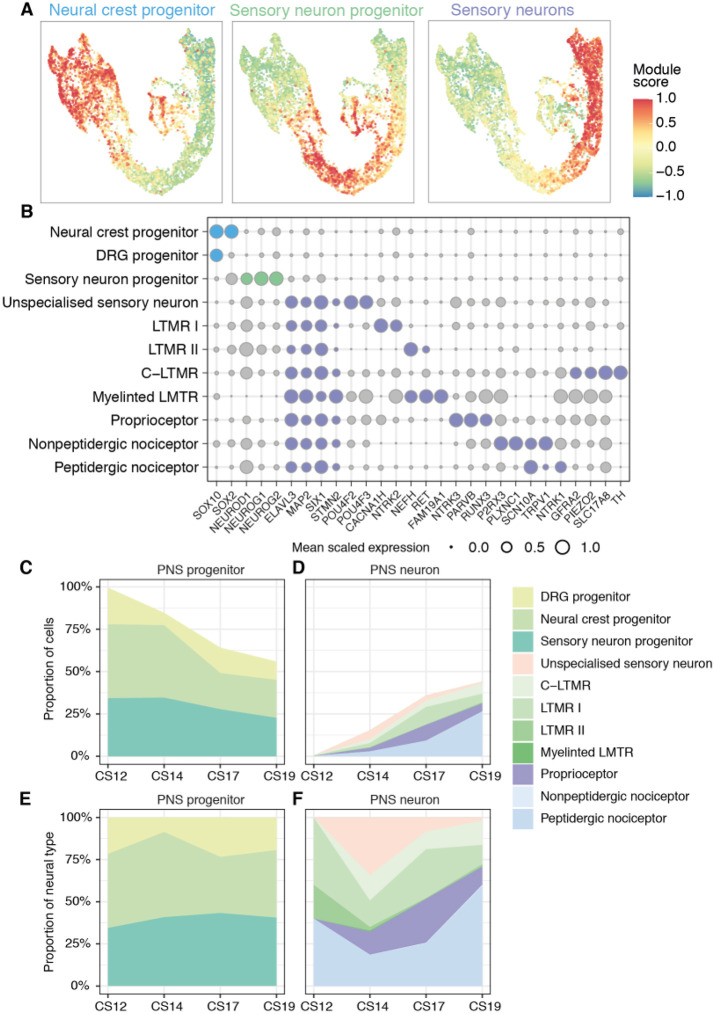
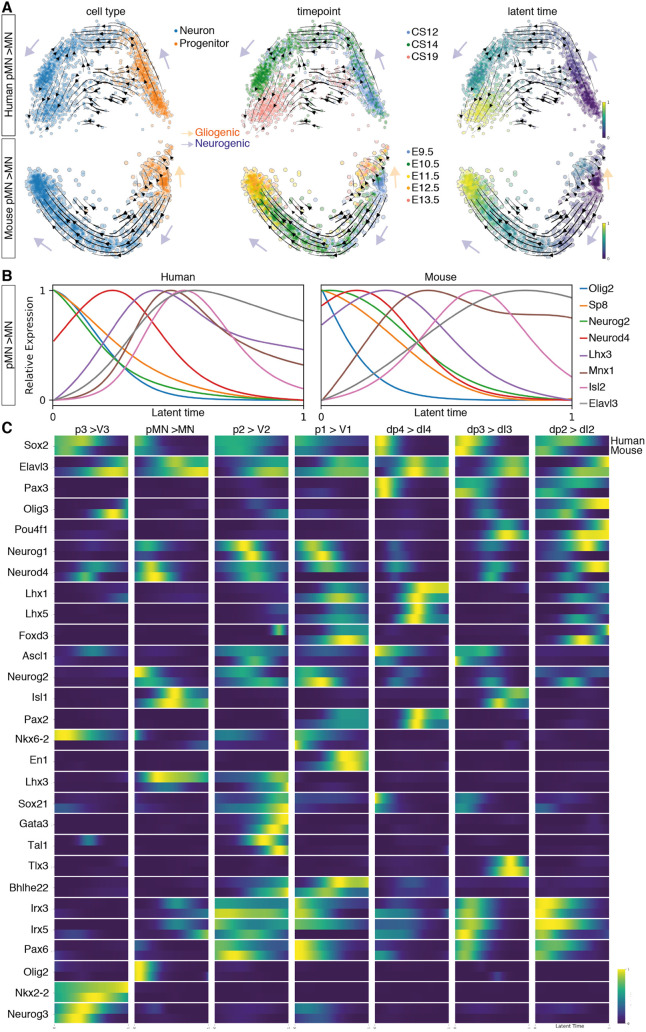
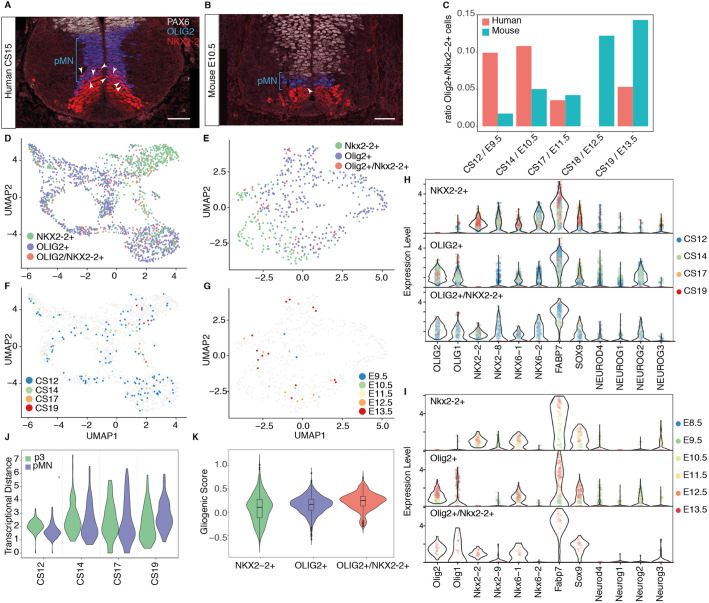
The spinal cord receives input from peripheral sensory neurons and controls motor output by regulating muscle innervating motor neurons. These functions are carried out by neural circuits comprising molecularly distinct neuronal subtypes generated in a characteristic spatiotemporal arrangement from progenitors in the embryonic neural tube. To gain insight into the diversity and complexity of cells in the developing human neural tube, we used single-cell mRNA sequencing to profile cervical and thoracic regions in four human embryos of Carnegie stages (CS) CS12, CS14, CS17 and CS19 from gestational weeks 4-7. Analysis of progenitor and neuronal populations from the neural tube and dorsal root ganglia identified dozens of distinct cell types and facilitated the reconstruction of the differentiation pathways of specific neuronal subtypes. Comparison with mouse revealed overall similarity of mammalian neural tube development while highlighting some human-specific features. These data provide a catalogue of gene expression and cell type identity in the human neural tube that will support future studies of sensory and motor control systems. The data can be explored at https://shiny.crick.ac.uk/scviewer/neuraltube/.

Keywords: Developmental patterning; Human; Neuronal subtype identity; Single-cell transcriptome; Spinal cord.


Conflict of interest statement

Competing interests The authors declare no competing or financial interests.

Figures

Fig. 1.
Fig. 1.
Single-cell RNA-seq from the human developing spinal cord. (A) UMAP of CS12, CS14, CS17 and CS19 samples annotated by gene module score. (B) Stacked bar chart indicating the cell type composition per time point (colour key as in A). (C) UMAP of the combined human neural dataset coloured by gene module score. Colour and brightness of cells reflects the representative gene module (n=43,485). (D) Feature plots of markers of neural progenitors (SOX2), neurons (ELAVL3) and neural crest progenitors (SOX10) and neurons (SIX1). (E) Feature plots of the spinal cord progenitor UMAP showing the patterned expression of the indicated DV patterning markers.
Fig. 2.
Fig. 2.
Classification of dorsoventral progenitors and neuronal classes in human. (A) Bubble plots indicating the expression of markers used to identify dorsoventral (DV) domains in human progenitors. (B) Diagram of the DV domains in the human developing spinal cord highlighting the opposing gradients of SHH and WNT/BMP and the patterning of the 11 DV domains, the floor plate (FP) and roof plate (RP). GliA, activator forms of Gli; GliR, Gli repressor forms; NC, notochord. (C) Bubble plots depicting the 11 neuronal classes in human. In A and C, genes chosen for cell assignment are coloured; grey circles correspond to markers not used for the selection of a specific population. Circle size indicates mean scaled gene expression levels. (D) Heatmap of the pairwise Pearson correlation coefficients of gene expression in mouse (vertical) and human (horizontal) progenitor and neural cells. (E) Heatmap of Spearman correlation coefficients per time point of the averaged gene expression of ventral progenitors and neurons in the human spinal cord in vivo (vertical) and in vitro (horizontal).
Fig. 3.
Fig. 3.
Human-specific features of neural progenitors and visceral motor neurons. (A-C) Genes most correlated with PAX7 in human FP (A), mouse FP (B) and in human pD (dp1-dp6) (C). (D) NKX6-1 (cyan) and NKX6-2 (red) expression in transverse sections of the human neural tube at shoulder levels in CS13 (n=1, three sections) and CS15 (n=1, three sections) embryos. Scale bars: 50 µm. (E) Scatter plot of the expression of PHOX2B and TBX20 in human transcriptomes (n=170 cells).
Fig. 4.
Fig. 4.
Expression of primate-specific genes. (A) Bubble plots indicating the expression of primate-specific genes in different cell types. Genes expressed at an average level of 0.10 transcripts/cell or higher in any cell type are highlighted in red. Circle size indicates mean scaled gene expression levels. (B) Violin plots for the expression of genes in neural cell types. Cells with null values for the genes were not included. (C) Proportion of cells within each cell type that express the indicated primate-specific genes.
Fig. 5.
Fig. 5.
Classification of peripheral nervous system cells in human. (A) Gene module scores for progenitors, sensory neuron progenitors, and postmitotic sensory neurons in the peripheral nervous system (PNS) UMAP. (B) Bubble plots indicating the expression of markers used to identify PNS cell types. Genes chosen for cell assignment are coloured; grey circles correspond to markers not used for the selection of a specific population. Circle size indicates mean scaled gene expression levels. (C-F) Fractions of progenitors (C,E) and neurons (D,F) in the PNS during gestational weeks 4 to 7. For C and D, the data are proportional to the total neurons and progenitors at each time point. E and F show the same data as shown in C for progenitors or D for neurons as a proportion of the number of neural cells.
Fig. 6.
Fig. 6.
Dynamics of progenitor and neuron proportions in the developing spinal cord. (A,B) Proportions of progenitors and neurons in the spinal cord during gestational weeks 4 to 7. The data are proportional to the total neurons and progenitors at each time point. (C) Comparison of the ratio of progenitors between mouse and human grouped in broad territories: pD (dp1-dp6); pI (p0-p2). Vertical bars indicate the range around the mean of proportions per sample. (D) Immunofluorescence of PAX3 (cyan), OLIG2 (red), NKX2-2 (cyan) and ARX (red) in transverse sections of mouse and human cervical neural tube at E9.5 and E11.5 in mouse embryos and CS12 and CS17 in human embryos. Scale bars: 50 µm. (E) Expression of gliogenic markers in progenitors and oligodendrocytes. (F) Expression of the temporal transcription factor code in neurons. In E and F, the size of the circles indicates the proportion of cells that express the gene per stage and domain, and the colour indicates the mean expression levels.
Fig. 7.
Fig. 7.
Neurogenic trajectories in the developing spinal cord. (A) PCA of the pMN-to-MN trajectory in human and mouse indicating the RNA-velocity trajectories depicted by black arrows in the PCA. PCAs are annotated by cell type (left), time point (middle) or latent time (right). The earliest latent time points are indicated in dark blue and latest in yellow on the latent time colour scale. Neurogenic trajectories are indicated with blue arrows, and the gliogenic trajectory in the mouse pMN is depicted by the orange arrow pointing away from the neurogenic trajectory. (B) Smoothed expression profile of the reconstructed motor neuron differentiation trajectory using the calculated latent times in human and mouse for selected genes. (C) Heatmap of the normalised gene expression (blue, low; yellow, high) of genes involved in neurogenesis for each neuronal class as a function of latent time in human (top bar) and mouse (bottom bar).
Fig. 8.
Fig. 8.
Overlapping expression of OLIG2 and NKX2-2. (A,B) Expression of the ventral progenitor markers PAX6 (white), OLIG2 (blue) and NKX2-2 (red) in transverse sections of human (A) and mouse (B) cervical neural tube at CS15 and E10.5, respectively. Scale bars: 50 µm. (C) Ratio of Olig2+/Nkx2-2+ double-positive cells within all cells expressing Nkx2-2 or Olig2. (D-G) Human UMAP of all cells expressing Nkx2-2 or Olig2 in human (D,F) and mouse (E,G). In F,G the double-positive progenitors are colour coded by time point. (H,I) Violin plots of selected genes involved in pMN and p3 neurogenesis and progenitor maturation in human (H) and mouse (I). Cells are labelled by time point. (J) Transcriptional distance of double-positive progenitors to pMN and p3 cells. Values closer to 1 indicate greater similarity to the population. (K) Gliogenic score of cells expressing OLIG2, NKX2-2 or both genes in human.

References

    1. Bergen, V., Lange, M., Peidli, S., Wolf, F. A. and Theis, F. J. (2020). Generalizing RNA velocity to transient cell states through dynamical modeling. Nat. Biotechnol. 38, 1408-1414. 10.1038/s41587-020-0591-3 - DOI - PubMed
    1. Berta, P., Hawkins, J. B., Sinclair, A. H., Taylor, A., Griffiths, B. L., Goodfellow, P. N. and Fellous, M. (1990). Genetic evidence equating SRY and the testis-determining factor. Nature 348, 448-450. 10.1038/348448a0 - DOI - PubMed
    1. Betters, E., Liu, Y., Kjaeldgaard, A., Sundström, E. and García-Castro, M. I. (2010). Analysis of early human neural crest development. Dev. Biol. 344, 578-592. 10.1016/j.ydbio.2010.05.012 - DOI - PMC - PubMed
    1. Briscoe, J., Sussel, L., Serup, P., Hartigan-O'Connor, D., Jessell, T. M., Rubenstein, J. L. R. and Ericson, J. (1999). Homeobox gene Nkx2.2 and specification of neuronal identity by graded Sonic hedgehog signalling. Nature 398, 622-627. 10.1038/19315 - DOI - PubMed
    1. Chiu, I. M., Barrett, L. B., Williams, E. K., Strochlic, D. E., Lee, S., Weyer, A. D., Lou, S., Bryman, G. S., Roberson, D. P., Ghasemlou, N.et al. (2014). Transcriptional profiling at whole population and single cell levels reveals somatosensory neuron molecular diversity. eLife 3, e04660. 10.7554/eLife.04660.034 - DOI - PMC - PubMed

Publication types