The biochemical basis of mitochondrial dysfunction in Zellweger Spectrum Disorder
- PMID: 34351705
- PMCID: PMC8490991
- DOI: 10.15252/embr.202051991
The biochemical basis of mitochondrial dysfunction in Zellweger Spectrum Disorder
Abstract
Peroxisomal biogenesis disorders (PBDs) are genetic disorders of peroxisome biogenesis and metabolism that are characterized by profound developmental and neurological phenotypes. The most severe class of PBDs-Zellweger spectrum disorder (ZSD)-is caused by mutations in peroxin genes that result in both non-functional peroxisomes and mitochondrial dysfunction. It is unclear, however, how defective peroxisomes contribute to mitochondrial impairment. In order to understand the molecular basis of this inter-organellar relationship, we investigated the fate of peroxisomal mRNAs and proteins in ZSD model systems. We found that peroxins were still expressed and a subset of them accumulated on the mitochondrial membrane, which resulted in gross mitochondrial abnormalities and impaired mitochondrial metabolic function. We showed that overexpression of ATAD1, a mitochondrial quality control factor, was sufficient to rescue several aspects of mitochondrial function in human ZSD fibroblasts. Together, these data suggest that aberrant peroxisomal protein localization is necessary and sufficient for the devastating mitochondrial morphological and metabolic phenotypes in ZSDs.
Keywords: mitochondria; mitochondrial quality control; peroxisomal biogenesis disorder; peroxisomal import; peroxisomes.
© 2021 The Authors.
Conflict of interest statement
The University of Utah has filed a patent related to ATAD1, of which E.N., Y.C.C, J.B., and J.R. are listed as co‐inventors. All other authors declare no competing interests.
Figures
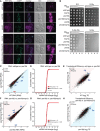
The indicated yeast strains (wild type, pex19Δ, pex3Δ, msp1Δ, pex19Δmsp1Δ, and pex3Δmsp1Δ) expressing RFP‐SKL (peroxisomal marker) and mitochondria‐targeted green fluorescent protein (mGFP) were grown to mid‐log phase and imaged by fluorescence microscopy. Representative images are shown, scale bar, 2 μm. DIC, differential interference contrast. Enhanced: the red signal intensity was set to “best‐fit” in ZENPro microscopy software analysis.
The indicated yeast strains (wild type, msp1Δ, pex19Δ, pex19Δmsp1Δ, pex3Δ, and pex3Δmsp1Δ) were grown to mid‐log phase, back‐diluted to OD600 = 1, and serial dilutions were spotted onto agar plates containing synthetic media supplemented with glucose (S‐D), glycerol (S‐Gly), glycerol and oleate (S‐Gly‐Ole), or oleate (S‐Ole).
Wild‐type versus pex19Δ RNA levels. Outliers are indicated. Peroxin genes are indicated in red. The blue shading emphasizes that the RNA levels of the indicated genes are lower in pex19Δ compared to wild type.
Cumulative distributions of fold changes (log2) in RNA between wild‐type and pex19Δ yeast (Kolmogorov–Smirnov test). Peroxin genes are indicated in red.
Translational efficiency (TE) of wild type versus pex19Δ. Outliers are indicated. Peroxin genes are indicated in red. The red shading emphasizes that the translation efficiency of the indicated genes is higher in pex19Δ compared to wild type.
pex19Δ versus pex19Δmsp1Δ RNA levels. Outliers are indicated. Peroxin genes are indicated in red. The red shading emphasizes that the RNA levels of the indicated genes are higher in pex19Δmsp1Δ compared to pex19Δ.
Cumulative distributions of fold changes (log2) in RNA between pex19Δ and pex19Δmsp1Δ yeast (Kolmogorov–Smirnov test). Peroxin genes are indicated in red.
Translational efficiency (TE) of pex19Δ versus pex19Δmsp1Δ. Outliers are indicated. Peroxin genes are indicated in red. The blue shading emphasizes that the translation efficiency of the indicated genes is lower in pex19Δmsp1Δ compared to pex19Δ.

Wild‐type versus pex19Δ RNA levels. All outliers are indicated.
Translational efficiency (TE) of wild type versus pex19Δ. All outliers are indicated.
pex19Δ versus pex19Δmsp1Δ RNA levels. All outliers are indicated.
Translational efficiency (TE) of pex19Δ versus pex19Δmsp1Δ. All outliers are indicated.
ZAP1 target genes abundance in wild type versus pex19Δ.
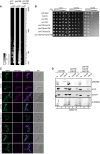
Heat map representing the protein abundance of control proteins Pex3, Pex19, and Msp1 in digitonin‐solubilized (3 g/g digitonin/protein ratio) mitochondrial membranes from the indicated yeast strains (wild type, pex19Δ, pex19Δmsp1Δ) expressing Pex13‐V5 (under its endogenous promotor).
The indicated strains (wild type, msp1Δ, pex19Δ, pex13Δ, pex19Δmsp1Δ, pex13Δpex19Δ, pex13Δmsp1Δ, and pex13Δmsp1Δpex19Δ) were grown to mid‐log phase, back‐diluted to OD600 = 1, and serial dilutions were spotted onto agar plates containing synthetic media with glucose (S‐D), glycerol (S‐Gly), or oleate (S‐Ole).
The indicated strains (wild type, msp1Δ, pex13Δ, pex19Δ, pex19Δmsp1Δ, pex13Δpex19Δ, pex13Δmsp1Δ, and pex13Δpex19Δmsp1Δ) expressing RFP‐SKL (peroxisomal marker) and mitochondria‐targeted green fluorescent protein (mGFP) were grown to mid‐log phase and visualized by fluorescence microscopy. Representative images are shown, scale bar, 2 μm. DIC, differential interference contrast.
Mitochondria from the indicated yeast strains (pex19Δ, pex19Δmsp1Δ, and pex19Δmsp1Δ pex13Δ) expressing Mdh3‐V5 (under its endogenous promotor) were either left untreated (nt) (lane 1, 4, 7) or were treated with proteinase K in high fidelity buffer (PK‐HF) (cutting control, lane 2, 5, 8) or low fidelity buffer (PK‐LF) (protease protection assay, lane 3, 6, 9) and separated by SDS–PAGE and immunoblotted for Mia40 (intermembrane space)(α‐Mia40), Mdh3‐V5 (α‐V5), porin (outer membrane) (α‐porin), and Tom22 (outer membrane but partially proteinase exposed) (α‐Tom22).

25 μg of cell lysate from cWT, cWT+ATAD1, PEX3−/−, and PEX3−/−+ATAD1 transfected with GFP or Pex13‐GFP were separated by SDS–PAGE and immunoblotted for ATAD1‐HA‐FLAG (α‐HA), Pex3‐V5 (α‐V5), and GFP (α‐GFP). VDAC (α‐VDAC) was used as a loading control.
Fluorescence microscopy of human fibroblast cell lines cWT expressing control‐GFP and stained with MitoTracker™ Deep Red FM. Representative images are shown, scale bar 10 μm.

35 μg of cell lysate from cWT, cWT‐ATAD1, PEX3−/−, and PEX3−/−‐ATAD1 cells were separated by SDS–PAGE and immunoblotted for ATAD1 (α‐ATAD1). Tubulin (α‐tubulin) was used as a loading control.
Scatter plot representation of phosphatidyl–ethanolamine (PE) lipidomics. The average (n = 4, biological replicates) normalized peak intensity of each of the 67 detected phosphoethanolamine (PE) species, log10 pareto‐scaled is visualized. Statistical significance was calculated using Welch’s test, P‐values are indicated as: **P ≤ 0.01, ****P ≤ 0.0001. The horizontal lines represent the mean peak intensity of all 67 PE species in each cell line.
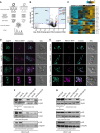
Experimental flow of sample generation for quantitative mass spectrometry.
Volcano plot showing the most enriched/decreased proteins in the mitochondrial proteome of pex19Δ versus pex19Δmsp1Δ strains as detected by quantitative mass spectrometry (n = 7, biological replicates; n = 2, technical replicates). Student’s t‐tests were performed using scipy.stats.ttest_ind() (Mckinney, 2010). Effect sizes were calculated for Cohen's d (Sawilowsky, ; Cohen, 2013). A protein's relevance was determined using a P‐value threshold of < 0.05 with an absolute effect size threshold of 1 or greater (large effect). Gray dots represent all measured proteins, and red dots highlight peroxisomal‐associated proteins.
Heat map of peroxin proteins from pex19Δ and pex19Δmsp1Δ stains as detected by quantitative mass spectrometry (n = 5). Protein classes are indicated in the row labels. Values were z‐score normalized by protein.
The indicated yeast strains expressing PEX13‐RFP and mitochondria‐targeted green fluorescent protein (mGFP) were grown to mid‐log phase and visualized by fluorescence microscopy. Representative images are shown, scale bar, 2 μm. DIC, differential interference contrast.
The indicated yeast strains expressing PEX11‐RFP and mitochondria‐targeted green fluorescent protein (mGFP) were grown to mid‐log phase and visualized by fluorescence microscopy. Representative images with enhanced contrast and brightness are shown, scale bar, 2 μm. DIC, differential interference contrast.
Total yeast cell lysate, post‐mitochondrial supernatant, and HistodenzTM‐purified mitochondria from the indicated strain (wild type, msp1Δ, pex19Δ, pex19Δmsp1Δ, pex3Δ, and pex3Δmsp1Δ) expressing Pex13‐V5 (under its endogenous promotor) were separated by SDS–PAGE and immunoblotted for Pex13 (α‐V5), cytochrome c (α‐cyt c), and HSP70 (α‐hsp70).
Total yeast cell lysate, post‐mitochondrial supernatant, and HistodenzTM‐purified mitochondria from the indicated strain (wild type, msp1Δ, pex19Δ, pex19Δmsp1Δ, pex3Δ, and pex3Δmsp1Δ) expressing Pex11‐V5 (under its endogenous promotor) were separated by SDS–PAGE and immunoblotted for Pex11 (α‐V5) and porin (α‐porin), cytochrome c (α‐cyt c), and HSP70 (α‐hsp70).

Volcano plot (log10) of the most enriched/decreased proteins in the mitochondrial proteome of pex3Δ versus pex3Δmsp1Δ strains as detected by quantitative mass spectrometry (n = 3, biological replicates, n = 1, technical replicate). Student’s t‐tests were performed using scipy.stats.ttest_ind() (Mckinney, 2010). Effect sizes were calculated for Cohen's d (Sawilowsky, ; Cohen, 2013). A protein's relevance to the model was determined using a P‐value threshold of < 0.05 with an absolute effect size threshold of 1 or greater (large effect). Gray dots represent all measured proteins. Red dots highlight peroxisomal‐associated proteins.
Heat map (log2) of peroxin protein levels from pex3Δ and pex3Δmsp1Δ as detected by quantitative mass spectrometry (n = 3). Protein classes are indicated in the row labels. Values were z‐score normalized by protein.
Mitochondria from the indicated yeast strains (wild type, pex19Δ, pex19Δmsp1Δ), expressing Pex13‐V5 (under its endogenous promotor) were either left untreated (lane 1, 2, 3) or exposed to Na2CO3 and separated into the membrane pellet (4, 5, 6) or supernatant fraction (7, 8, 9). After separation by SDS–PAGE the fractions were immunoblotted for Pex13‐V5 (α‐V5) and porin (α‐porin).

Total cell lysate (T), post‐mitochondrial supernatant (PMS), and HistodenzTM‐purified mitochondria (M + P, M) from the indicated yeast strains (wild type, pex19Δ, and pex19Δmsp1Δ) expressing Pex13‐V5 (under its endogenous promotor) were separated by SDS–PAGE and immunoblotted for PEX13‐V5 (α‐V5) and porin (α‐porin).
Digitonin‐solubilized (1 or 4 g/g digitonin/protein ratio, as indicated) mitochondrial membranes from the indicated yeast strains (wild type, pex19Δ, pex19Δmsp1Δ) expressing Pex13‐V5 (under its endogenous promotor) were separated by BN–PAGE with a 3–18% gradient and stained with Coomassie brilliant blue. BHM, bovine heart mitochondria; V2, complex V‐dimer; SL, supercomplex III2IV2; Ss, supercomplex III2IV1; V1, complex V‐monomer.
Digitonin‐solubilized (1 or 4 g/g digitonin/protein ratio, as indicated) mitochondrial membranes from the indicated yeast strains (wild type, pex19Δ, pex19Δmsp1Δ) expressing Pex13‐V5 (under its endogenous promotor) were separated by BN–PAGE with a 3–18% gradient and immunoblotted for PEX13‐V5 (α‐V5). Green box for wild type, orange box for pex19Δ, purple box for pex19Δmsp1Δ, indicates gel area of 300–130 kDa correlated with complexome profiling heat map.
Heat map representing the protein abundance of Pex11, 13, 14, 17, 25 in digitonin‐solubilized (3 g/g digitonin/protein ratio) mitochondrial membranes from the indicated yeast strains (wild type, pex19Δ, pex19Δmsp1Δ) expressing Pex13‐V5 (under its endogenous promotor). Green box for wild type, orange box for pex19Δ, purple box for pex19Δmsp1Δ, indicates gel area of 300‐130 kDa correlated to complexome profiling heat map.
Heat map representing the protein abundance of Mdh3 and Pot1 in digitonin‐solubilized (3 g/g digitonin/protein ratio) mitochondrial membranes from the indicated yeast strains (wild type, pex19Δ, pex19Δmsp1Δ) expressing Pex13‐V5 (under its endogenous promotor).
Mitochondria from the indicated yeast strains (pex19Δ, pex19Δmsp1Δ, and pex13Δmsp1Δpex19Δ) expressing Pex22‐V5 (under its endogenous promotor) (HistodenzTM‐purified) were separated by SDS–PAGE and immunoblotted for Pex22‐V5 (α‐Pex22‐V5) and porin (α‐porin).
Mitochondria from the indicated yeast strains (pex19Δ, pex19Δmsp1Δ, and pex13Δmsp1Δpex19Δ) expressing Pot1‐V5 (under its endogenous promotor) were separated by SDS–PAGE and immunoblotted for Pot1‐V5 (α‐Pot1‐V5) and porin (α‐porin).
Mitochondria from the indicated yeast strains (pex19Δ, pex19Δmsp1Δ, and pex13Δmsp1Δpex19Δ) expressing Mdh3‐V5 (under its endogenous promotor) (Histodenz™‐purified) were separated by SDS–PAGE and immunoblotted for Mdh3‐V5 (α‐Mdh3‐V5) and porin (α‐porin).
Mitochondria from the indicated yeast strains (pex19Δ, pex19Δmsp1Δ, and pex13Δmsp1Δpex19Δ) expressing Pot1‐V5 (under its endogenous promotor) were either left untreated (nt) (lane 1,4,7) or were treated with proteinase K in high fidelity buffer (PK‐HF) (cutting control, lane 2,5,8) or low fidelity buffer (PK‐LF) (protease protection assay, lane 3,6,9) and separated by SDS–PAGE and immunoblotted for Mia40 (intermembrane space) (α‐Mia40), Pot1‐V5 (α‐V5), porin (outer membrane) (α‐porin) and Tom22 (outer membrane but partially proteinase exposed) (α‐Tom22).
Cartoon representing the predicted topology of the peroxisomal importomer assembled on mitochondria.
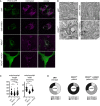
Fluorescence microscopy of human fibroblast cell lines derived from ZSD patients–cWT, cWT+ATAD1, PEX3−/−, and PEX3−/−+ATAD1–expressing PEX13‐GFP and stained with MitoTracker™ Deep Red FM. Representative images are shown, scale bar, 10 μm.
Electron microscopy of human fibroblast cell lines cWT, cWT+ATAD1, PEX3−/−, and PEX3−/−+ATAD1. Representative images are shown, scale bar 500 nm.
Quantification of electron microscopy imaging. Mitochondrial length and width were analyzed using the Fiji length analysis tool. Per cell line > 50 mitochondria were graphed. Statistical significance was calculated using a non‐paired t‐test, P‐values are indicated as: ns (not significant), **P ≤ 0.01, ***P ≤ 0.001, ****P ≤ 0.0001. The horizontal lines represent the mean length and width in each cell line, respectively.
Quantification of electron microscopy imaging. Three independent experiments were quantified. Mitochondria were counted (cWT n = 232, PEX3−/− n = 266, and PEX3−/−+ATAD1 n = 257) and binned into 3 categories: mitochondria with many cristae and low electron density (Type 1), mitochondria with fewer cristae (Type 2), and mitochondria with high electron density and/or almost no cristae (Type 3).
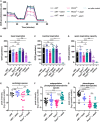
Bioenergetic profile of human fibroblast cell lines. OCR (pmol/min/norm.unit) for cWT, cWT+ATAD1, PEX3−/−, PEX3−/−+ATAD1, cWT‐ATAD1−/−, and PEX3−/− ATAD1−/− cells plotted against time (XF96e Extracellular Flux Analyzer, Mito‐Stress‐Test). 1 μM Oligomycin A, 0.15 μM FCCP, and 1 μM rotenone + 1 μM antimycin A (final concentrations) were sequentially delivered to the XF96e assay medium through injection ports in the sensor cartridge. The graph is the compilation of two independent assays, error bars show mean ± s.d. (n = 4, biological replicates).
Bar graph representation of basal respiration measured in (B) for cWT, cWT+ATAD1, PEX3−/−, PEX3−/−+ATAD1, cWT‐ATAD1, and PEX3−/−‐ATAD1 cells. Error bars show mean ± s.d. (n = 4, biological replicates). Statistical significance was calculated using Welch’s test, P‐values are indicated as: ns (not significant), **P ≤ 0.01, ***P ≤ 0.001.
Bar graph representation of maximal respiration measured in (B) for cWT, cWT+ATAD1, PEX3−/−, PEX3−/−+ATAD1, cWT‐ATAD1 and PEX3−/− ‐ATAD1 cells. Error bars show mean ± s.d. (n = 4, biological replicates). Statistical significance was calculated using Welch’s test, P‐values are indicated as: ns (not significant), *P ≤ 0.05, **P ≤ 0.01, ****P ≤ 0.0001.
Bar graph representation of calculated respiratory spare capacity (uncoupled respiration minus basal respiration) measured in (B) for cWT, cWT+ATAD1, PEX3−/−, PEX3−/−+ATAD1, cWT‐ATAD1, and PEX3−/−‐ATAD1 cells. Error bars show mean ± s.d. (n = 4, biological replicates). Statistical significance was calculated using Welch’s test, P‐values are indicated as: ns (not significant), *P ≤ 0.05, **P ≤ 0.01, ***P ≤ 0.001.
Scatter plot representation of cardiolipin lipidomics. The average (n = 4, biological replicates) normalized peak intensity of each of the 11 detected cardiolipin species, log10 pareto‐scaled is visualized. Statistical significance was calculated using Welch’s test, P‐values are indicated as: ns (not significant), *P ≤ 0.05, **P ≤ 0.01. The horizontal lines represent the mean peak intensity of all 11 caridiolipin species in each cell line.
Scatter plot representation of a subpopulation of the phosphoethanolamine (PE) lipidomics. The average (n = 4, biological replicates) normalized peak intensity of each of the 20 phosphoethanolamine (PE) species (decreased in PEX3−/−), log10 pareto‐scaled, is visualized. Statistical significance was calculated using Welch’s test, P‐values are indicated as: ns (not significant), *P ≤ 0.05, ***P ≤ 0.001, ****P ≤ 0.0001. The horizontal lines represent the mean peak intensity of all 20 PE species in each cell line.
Scatter plot representation of ether‐phospholipid lipidomics. The average (n = 4, biological replicates) normalized peak intensity of each of the 21 detected ether‐phospholipid (plasmalogen) species, log10 pareto‐scaled, is visualized. Statistical significance was calculated using Welch’s test, P‐values are indicated as: ns (not significant), ***P ≤ 0.001, ****P ≤ 0.0001. The horizontal lines represent the mean peak intensity of all 21 plasmalogen species in each cell line.
Comment in
-
Mitochondria as emergency landing for abandoned peroxins.EMBO Rep. 2021 Oct 5;22(10):e53790. doi: 10.15252/embr.202153790. Epub 2021 Aug 19. EMBO Rep. 2021. PMID: 34414648 Free PMC article.
References
-
- Argyriou C, Polosa A, Cecyre B, Hsieh M, Di Pietro E, Cui W, Bouchard JF, Lachapelle P, Braverman N (2019) A longitudinal study of retinopathy in the PEX1‐Gly844Asp mouse model for mild Zellweger Spectrum Disorder. Exp Eye Res 186: 107713 - PubMed
-
- Beausoleil SA, Villén J, Gerber SA, Rush J, Gygi SP (2006) A probability‐based approach for high‐throughput protein phosphorylation analysis and site localization. Nat Biotechnol 24: 1285–1292 - PubMed
Publication types
MeSH terms
Substances
Associated data
- Actions
Grants and funding
LinkOut - more resources
Full Text Sources
Molecular Biology Databases
Research Materials

