. 2021 Aug:5:789-804.
doi: 10.1200/CCI.21.00020.

Prognostic Model for De Novo and Recurrent Metastatic Breast Cancer

Affiliations

Prognostic Model for De Novo and Recurrent Metastatic Breast Cancer

Carlos H Barcenas et al. JCO Clin Cancer Inform. 2021 Aug.

Abstract

Purpose: Metastatic breast cancer (MBC) has a heterogeneous clinical course. We sought to develop a prognostic model for overall survival (OS) that incorporated contemporary tumor and clinical factors for estimating individual prognosis.

Methods: We identified patients with MBC from our institution diagnosed between 1998 and 2017. We developed OS prognostic models by Cox regression using demographic, tumor, and treatment variables. We assessed model predictive accuracy and estimated annual OS probabilities. We evaluated model discrimination and prediction calibration using an external validation data set from the National Comprehensive Cancer Network.

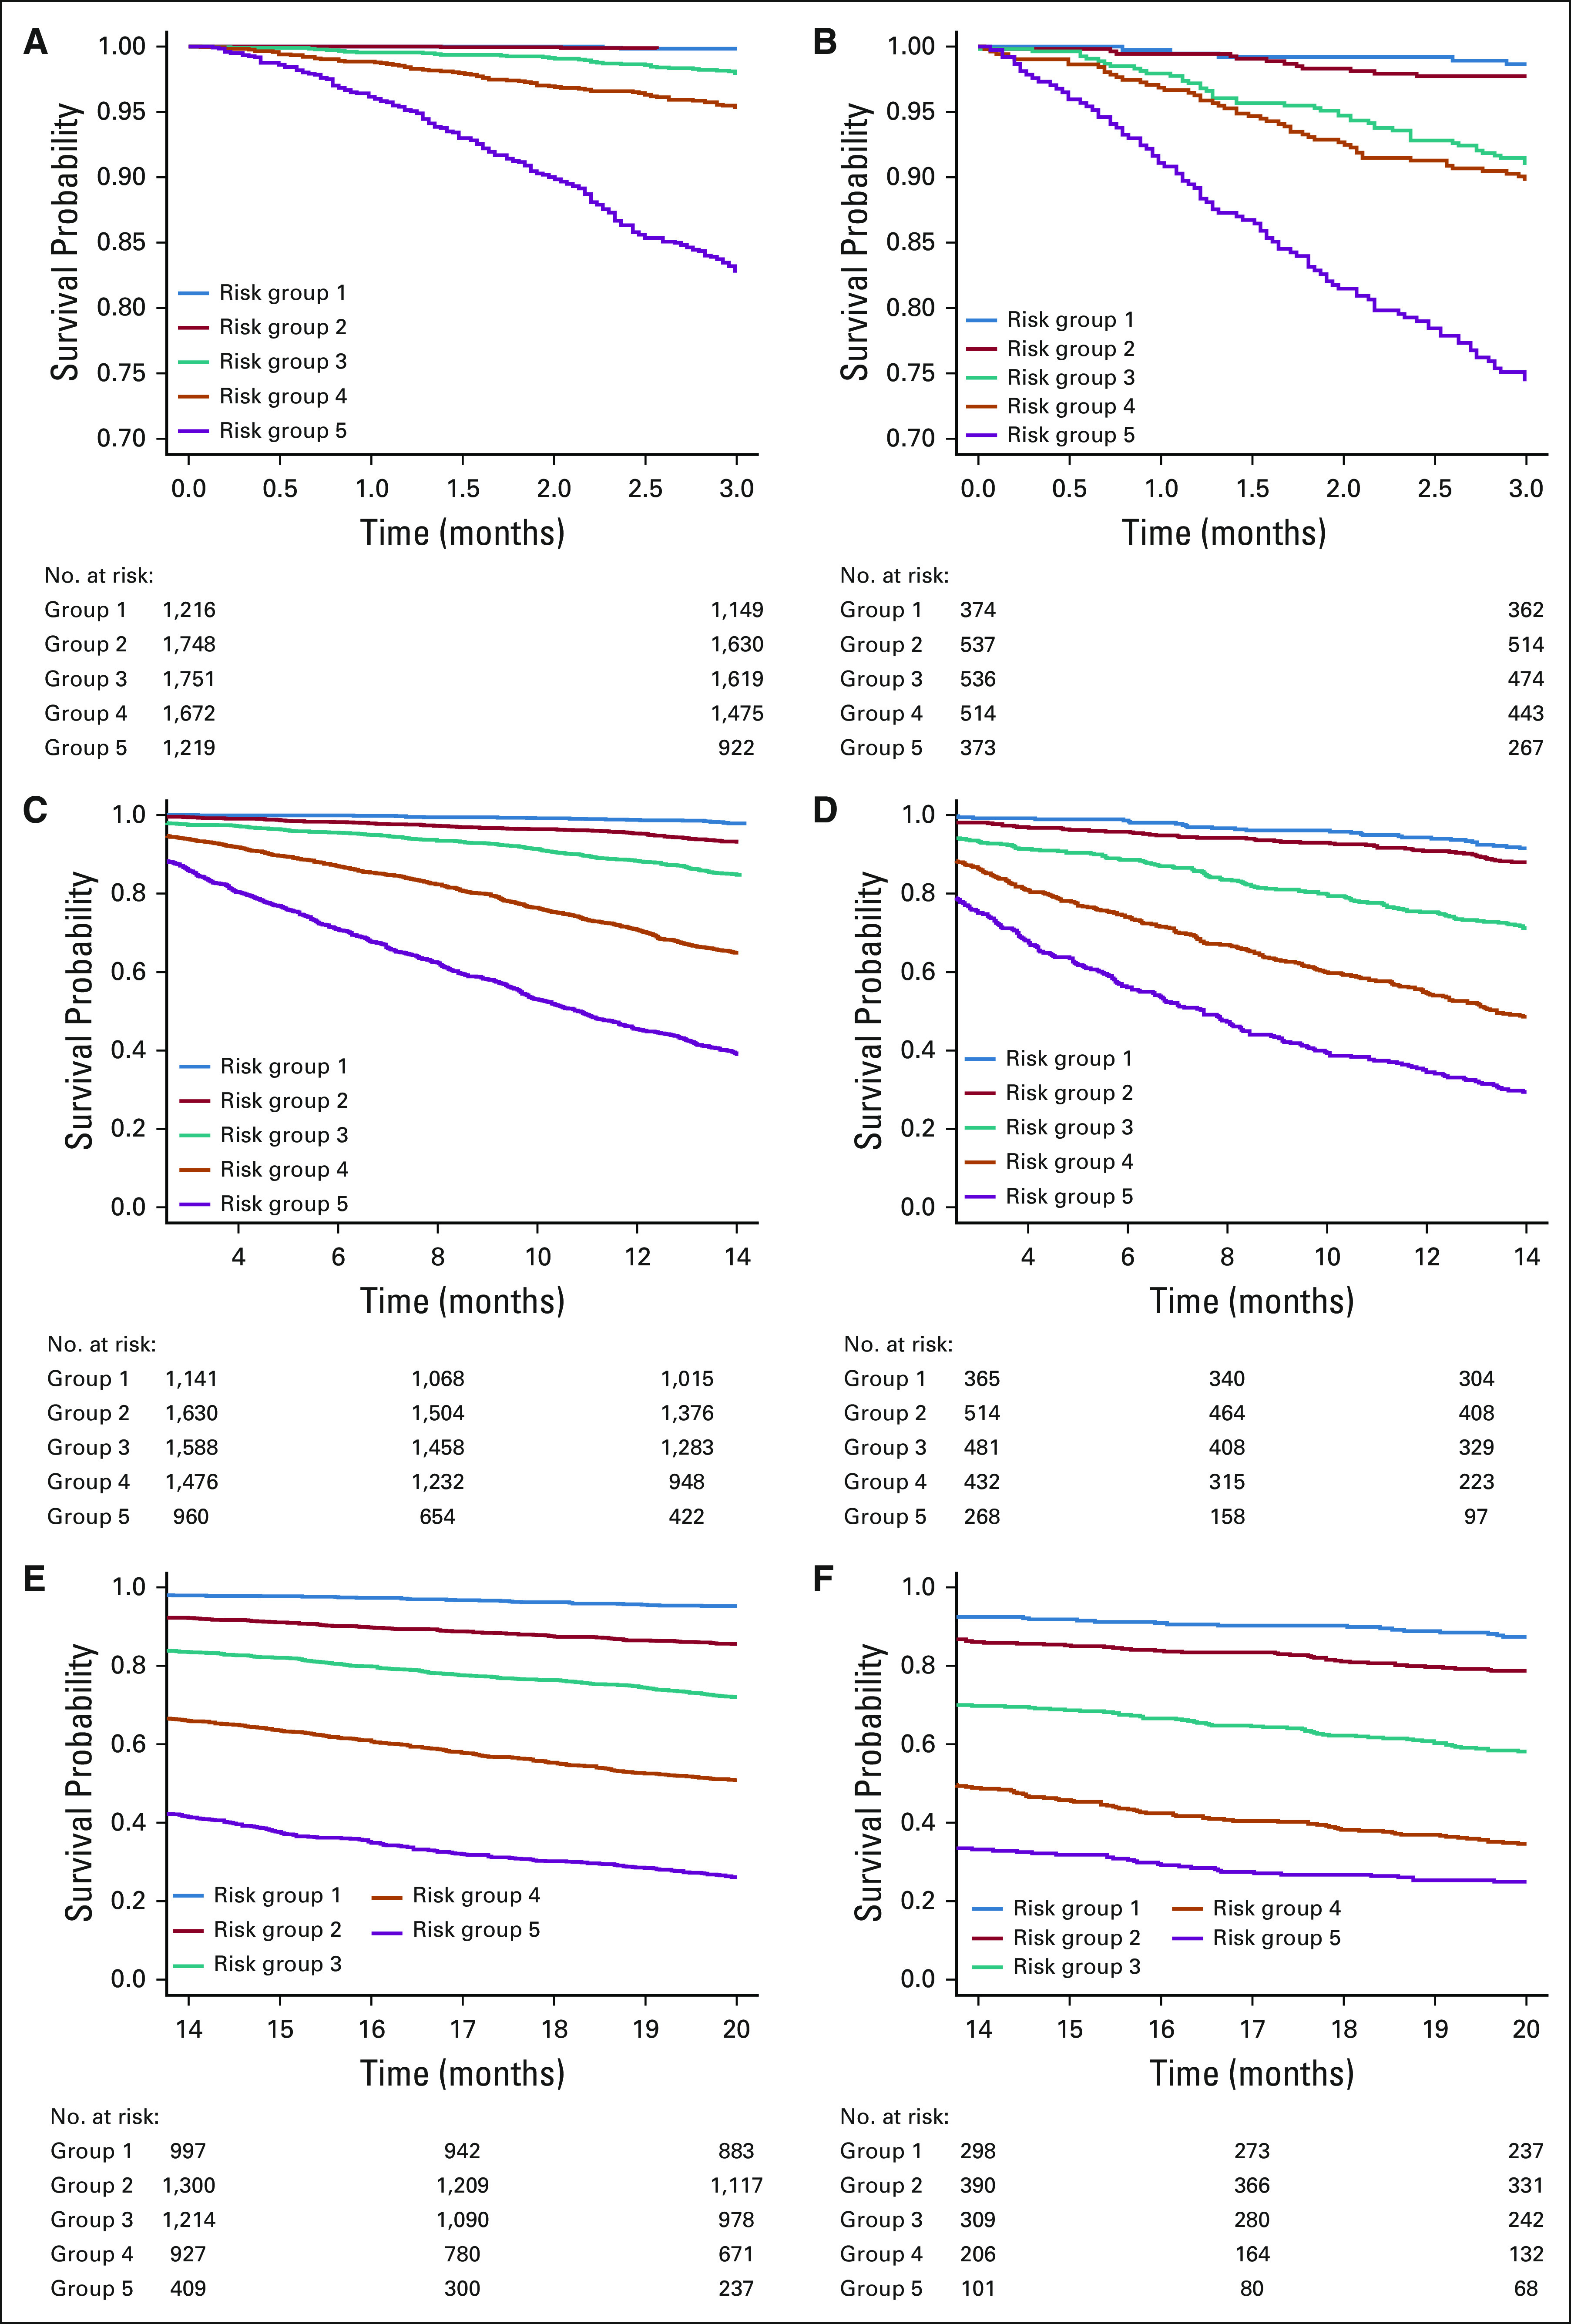
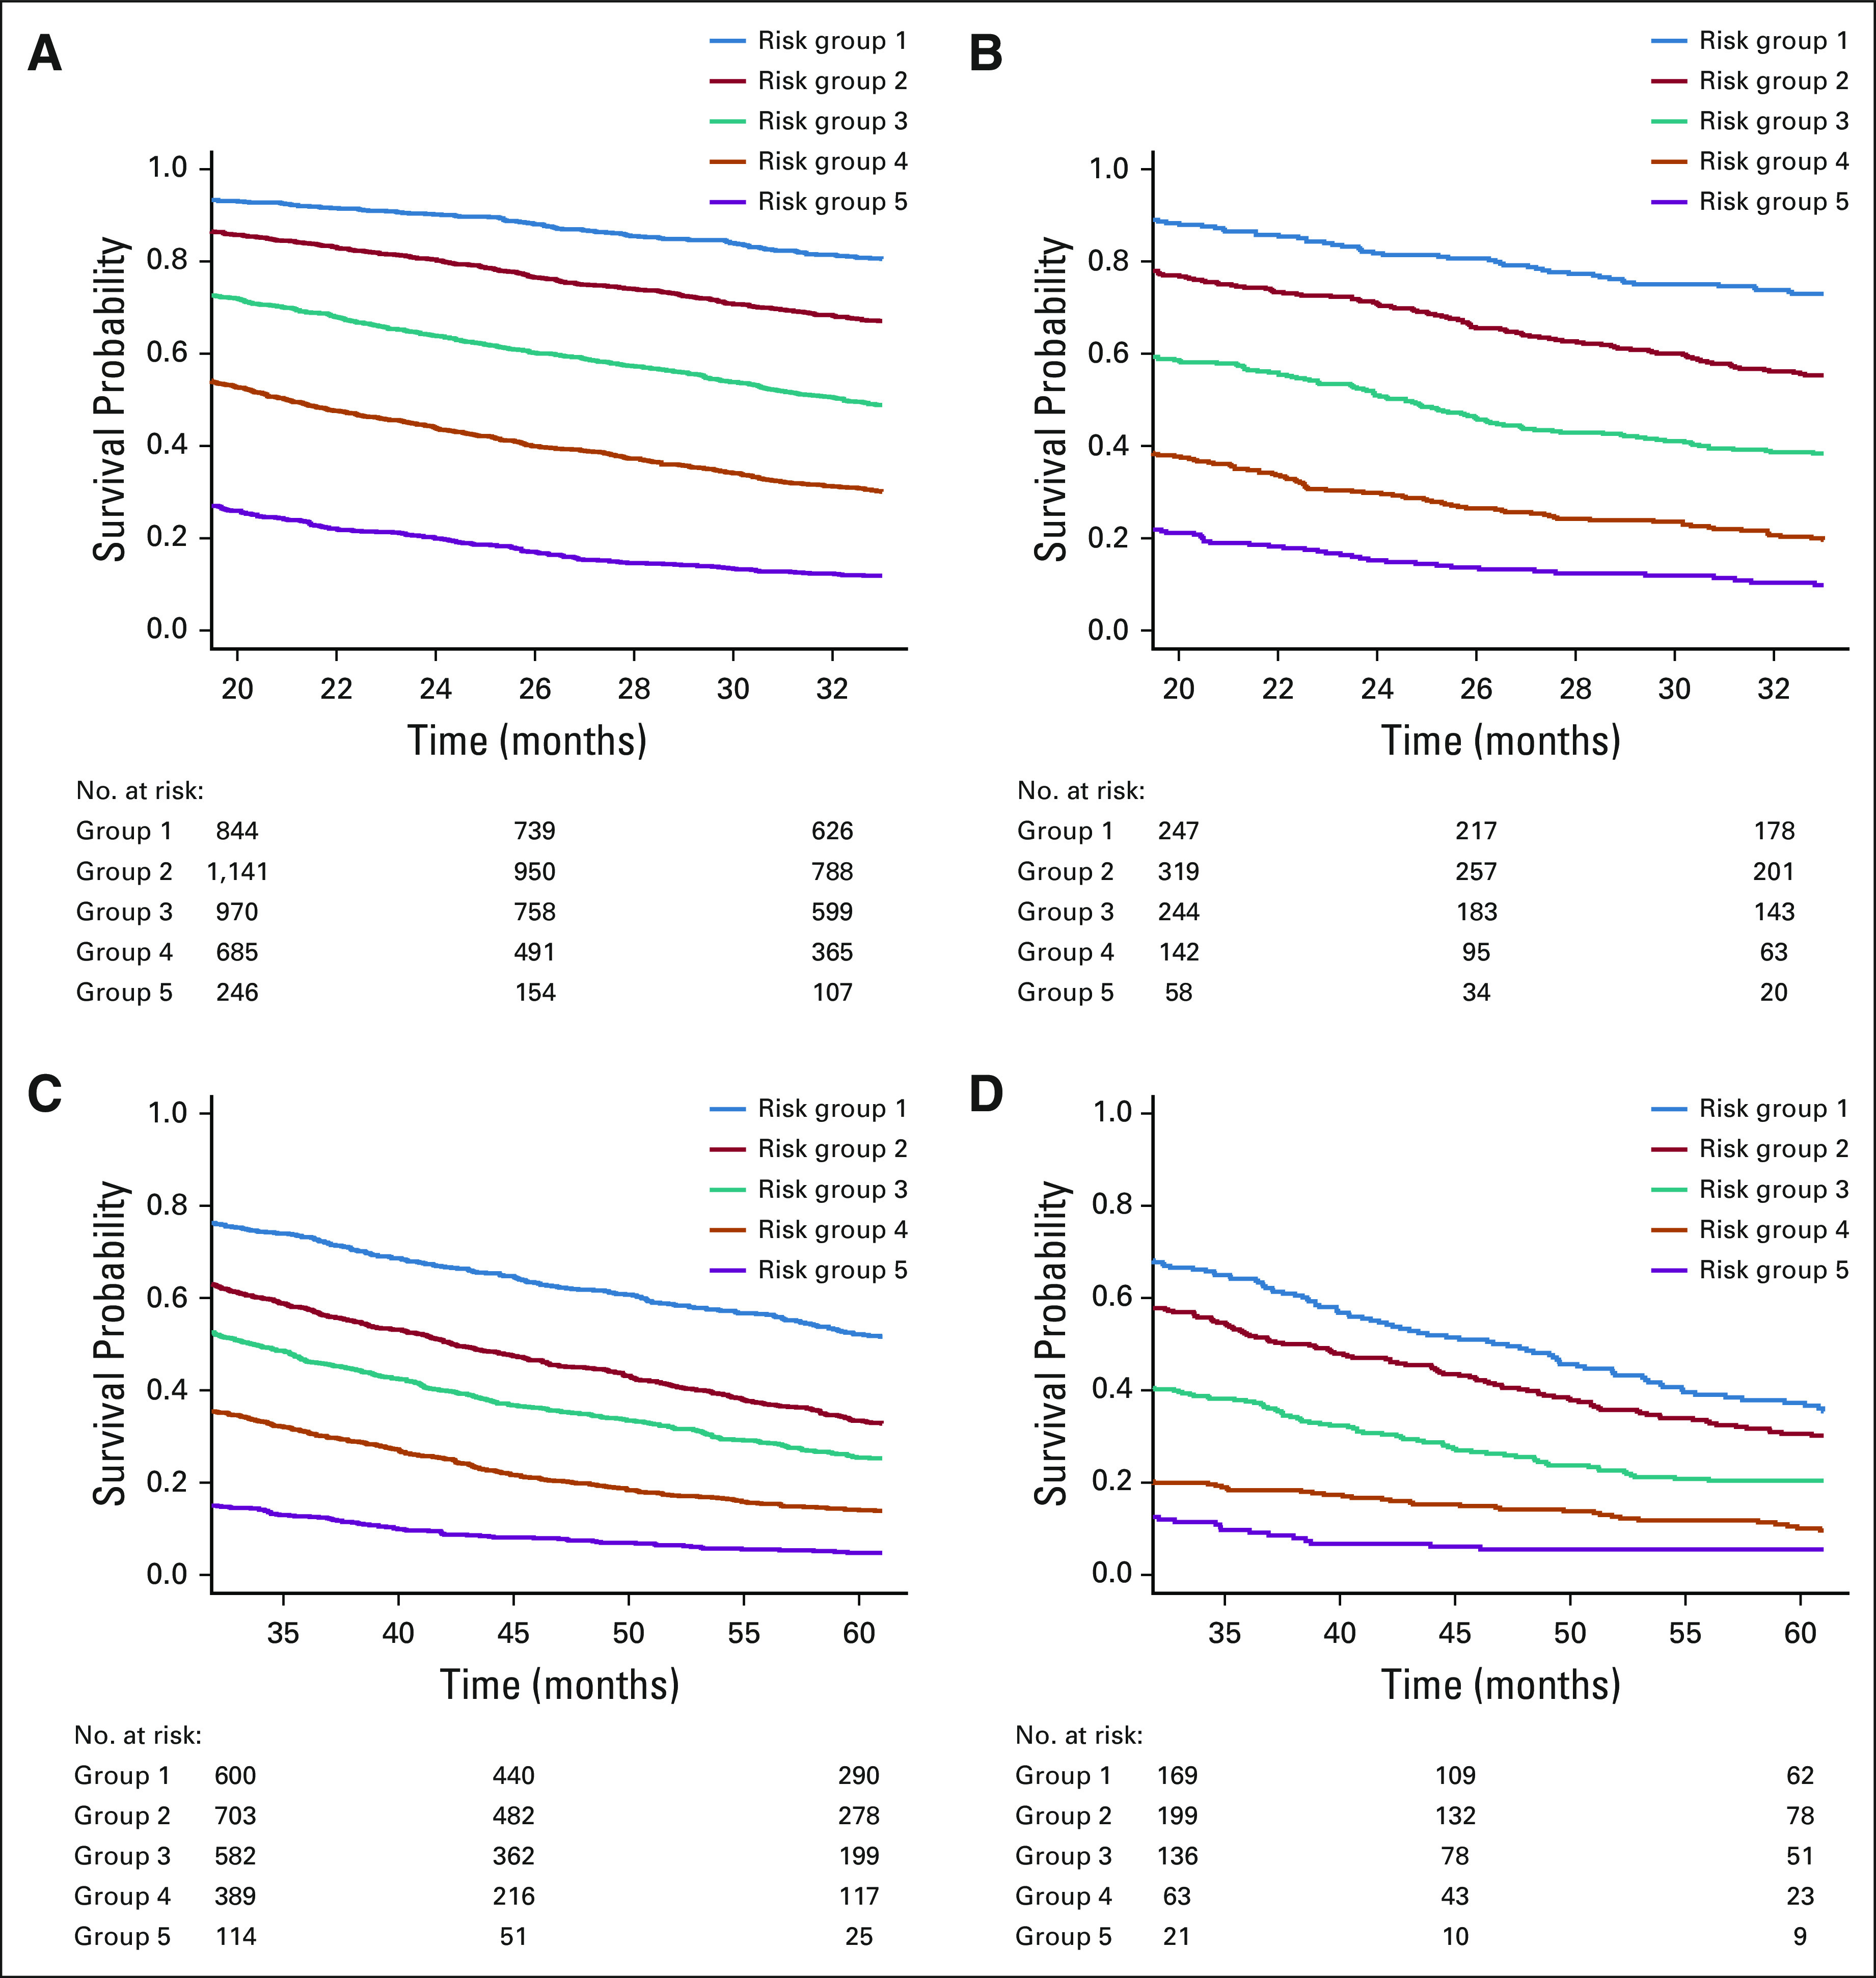
Results: We identified 10,655 patients. A model using age at diagnosis, race or ethnicity, hormone receptor and human epidermal growth factor receptor 2 subtype, de novo versus recurrent MBC categorized by metastasis-free interval, Karnofsky performance status, organ involvement, frontline biotherapy, frontline hormone therapy, and the interaction between variables significantly improved predictive accuracy (C-index, 0.731; 95% CI, 0.724 to 0.739) compared with a model with only hormone receptor and human epidermal growth factor receptor 2 status (C-index, 0.617; 95% CI, 0.609 to 0.626). The extended Cox regression model consisting of six independent models, for < 3, 3-14, 14-20, 20-33, 33-61, and ≥ 61 months, estimated up to 5 years of annual OS probabilities. The selected multifactor model had good discriminative ability but suboptimal calibration in the group of 2,334 National Comprehensive Cancer Network patients. A recalibration model that replaced the baseline survival function with the average of those from the training and validation data improved predictions across both data sets.

Conclusion: We have generated and validated a robust prognostic OS model for MBC. This model can be used in clinical decision making and stratification in clinical trials.


Conflict of interest statement

Carlos H. BarcenasResearch Funding: Puma Biotechnology Rashmi K. MurthyHonoraria: Puma Biotechnology, Genentech, Seattle Genetics, Novartis, AstraZenecaConsulting or Advisory Role: Genentech/Roche, Puma Biotechnology, Seattle Genetics, AstraZeneca, NovartisResearch Funding: Genentech/Roche, Daiichi Sankyo, Pfizer, EMD Serono, Seattle Genetics, AstraZenecaTravel, Accommodations, Expenses: Seattle Genetics, Genentech Robert W. CarlsonEmployment: Flatiron Health (I)Patents, Royalties, Other Intellectual Property: Patents relating to inventions as employee of NCCNOther Relationship: National Comprehensive Cancer Network Debu TripathyConsulting or Advisory Role: Novartis, Pfizer, GlaxoSmithKline, Genomic Health, AstraZeneca, OncoPepResearch Funding: Novartis, PolyphorTravel, Accommodations, Expenses: Novartis, AstraZeneca Gabriel N. HortobagyiConsulting or Advisory Role: NovartisResearch Funding: NovartisTravel, Accommodations, Expenses: NovartisNo other potential conflicts of interest were reported.

Figures

FIG 1.
FIG 1.
Kaplan-Meier overall survival curves for the training versus validation cohorts by risk groups formed by prognostic index percentiles on the basis of models e1, e2, and e3. (A) Kaplan-Meier curve for training cohort by risk groups formed by prognostic index percentiles on the basis of model e1. Solid blue line indicates risk group 1 (prognostic index ≤ 16th percentiles); solid red line indicates risk group 2 (16th percentiles < prognostic index ≤ 39th percentiles); solid green line indicates risk group 3 (39th percentiles < prognostic index ≤ 62th percentiles); solid orange line indicates risk group 4 (62th percentiles < prognostic index ≤ 84th percentiles); and solid purple line indicates risk group 5 (prognostic index > 84th percentiles); numbers at risk by risk group are presented (by the order of risk group); risk group 1 and risk group 2 are overlapping. (B) Kaplan-Meier curve for validation cohort by risk groups formed by prognostic index percentiles on the basis of model e1. (C) Kaplan-Meier curve for training cohort by risk groups formed by prognostic index percentiles on the basis of model e2. (D) Kaplan-Meier curve for validation cohort by risk groups formed by prognostic index percentiles on the basis of model e2. (E) Kaplan-Meier curve for training cohort by risk groups formed by prognostic index percentiles on the basis of model e3. (F) Kaplan-Meier curve for validation cohort by risk groups formed by prognostic index percentiles on the basis of model e3.
FIG 2.
FIG 2.
Kaplan-Meier overall survival curves for the training versus validation cohorts by risk groups formed by prognostic index percentiles on the basis of models e4 and e5. (A) Kaplan-Meier curve for training cohort by risk groups formed by prognostic index percentiles on the basis of model e4. Solid blue line indicates risk group 1 (prognostic index < 16th percentiles); solid red line indicates risk group 2 (16th percentiles < prognostic index < 39th percentiles); solid green line indicates risk group 3 (39th percentiles < prognostic index < 62th percentiles); solid orange line indicates risk group 4 (62th percentiles < prognostic index < 84th percentiles); and solid purple line indicates risk group 5 (prognostic index > 84th percentiles); numbers at risk by risk group are presented. (B) Kaplan-Meier curve for validation cohort by risk groups formed by prognostic index percentiles on the basis of model e4. (C) Kaplan-Meier curve for training cohort by risk groups formed by prognostic index percentiles on the basis of model e5. (D) Kaplan-Meier curve for validation cohort by risk groups formed by prognostic index percentiles on the basis of model e5.

Comment in

References

    1. Kaklamani VG, Gradishar WJ.Endocrine therapy in the current management of postmenopausal estrogen receptor‐positive metastatic breast cancer Oncologist 22507–5172017 - PMC - PubMed
    1. Mariotto AB, Etzioni R, Hurlbert M, et al. Estimation of the number of women living with metastatic breast cancer in the United States Cancer Epidemiol Prev Biomarkers 26809–8152017 - PMC - PubMed
    1. Ernst MF, van de Poll-Franse LV, Roukema JA, et al. Trends in the prognosis of patients with primary metastatic breast cancer diagnosed between 1975 and 2002 Breast 16344–3512007 - PubMed
    1. Caswell-Jin JL, Plevritis SK, Tian L, et al. Change in survival in metastatic breast cancer with treatment advances: Meta-analysis and systematic review. JNCI Cancer Spectr. 2018;2:pky062. - PMC - PubMed
    1. Bertaut A, Mounier M, Desmoulins I, et al. Stage IV breast cancer: A population‐based study about prognostic factors according to HER 2 and HR status Eur J Cancer Care 24920–9282015 - PubMed

Publication types