. 2021 Sep 16;81(18):3866-3876.e2.
doi: 10.1016/j.molcel.2021.07.014. Epub 2021 Aug 4.

Oxidative bursts of single mitochondria mediate retrograde signaling toward the ER

Affiliations

Oxidative bursts of single mitochondria mediate retrograde signaling toward the ER

David M Booth et al. Mol Cell. .

Abstract

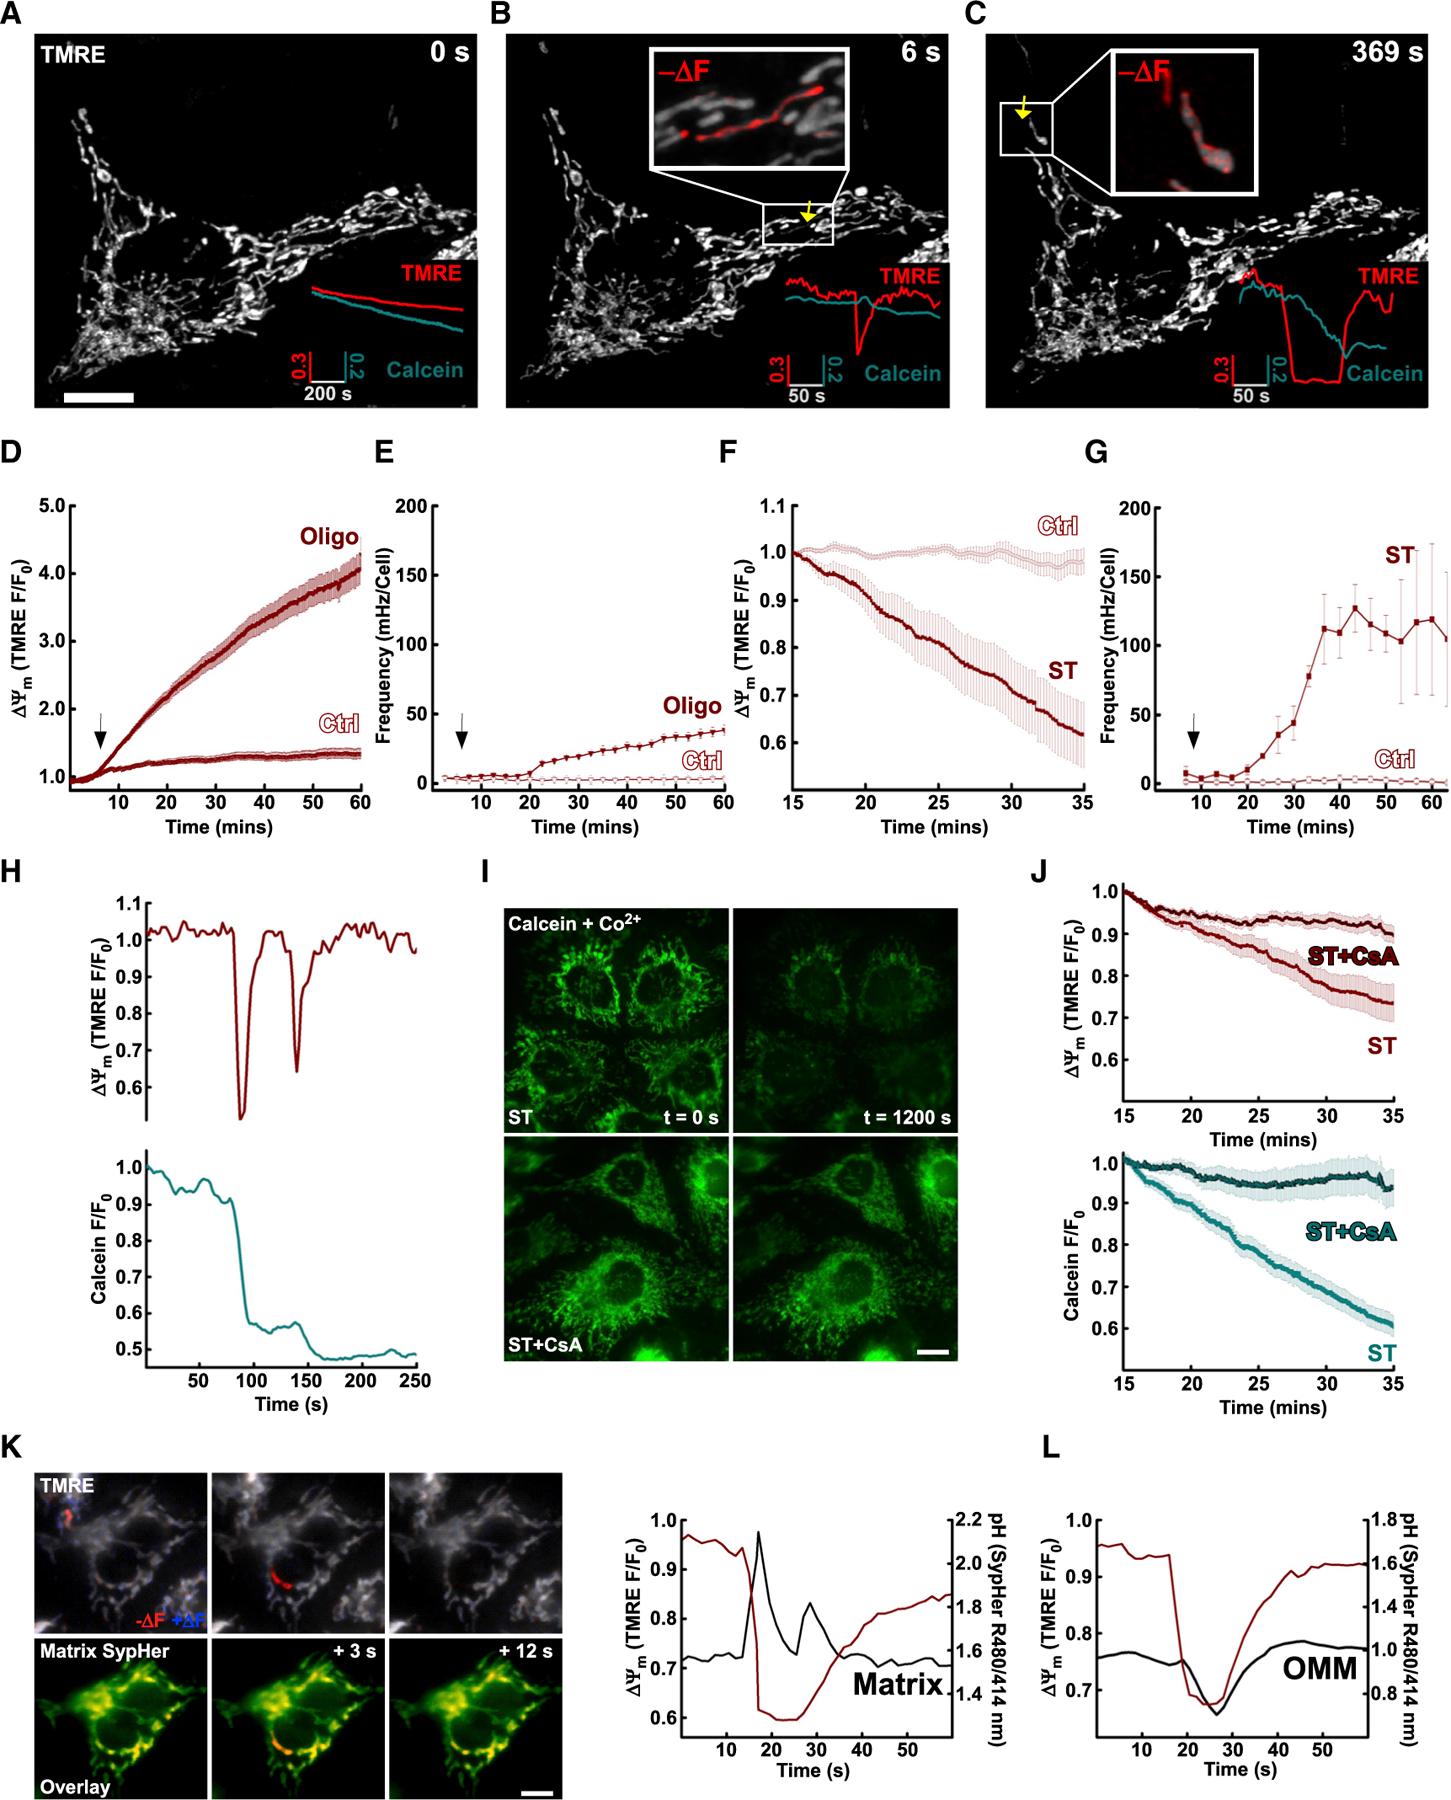
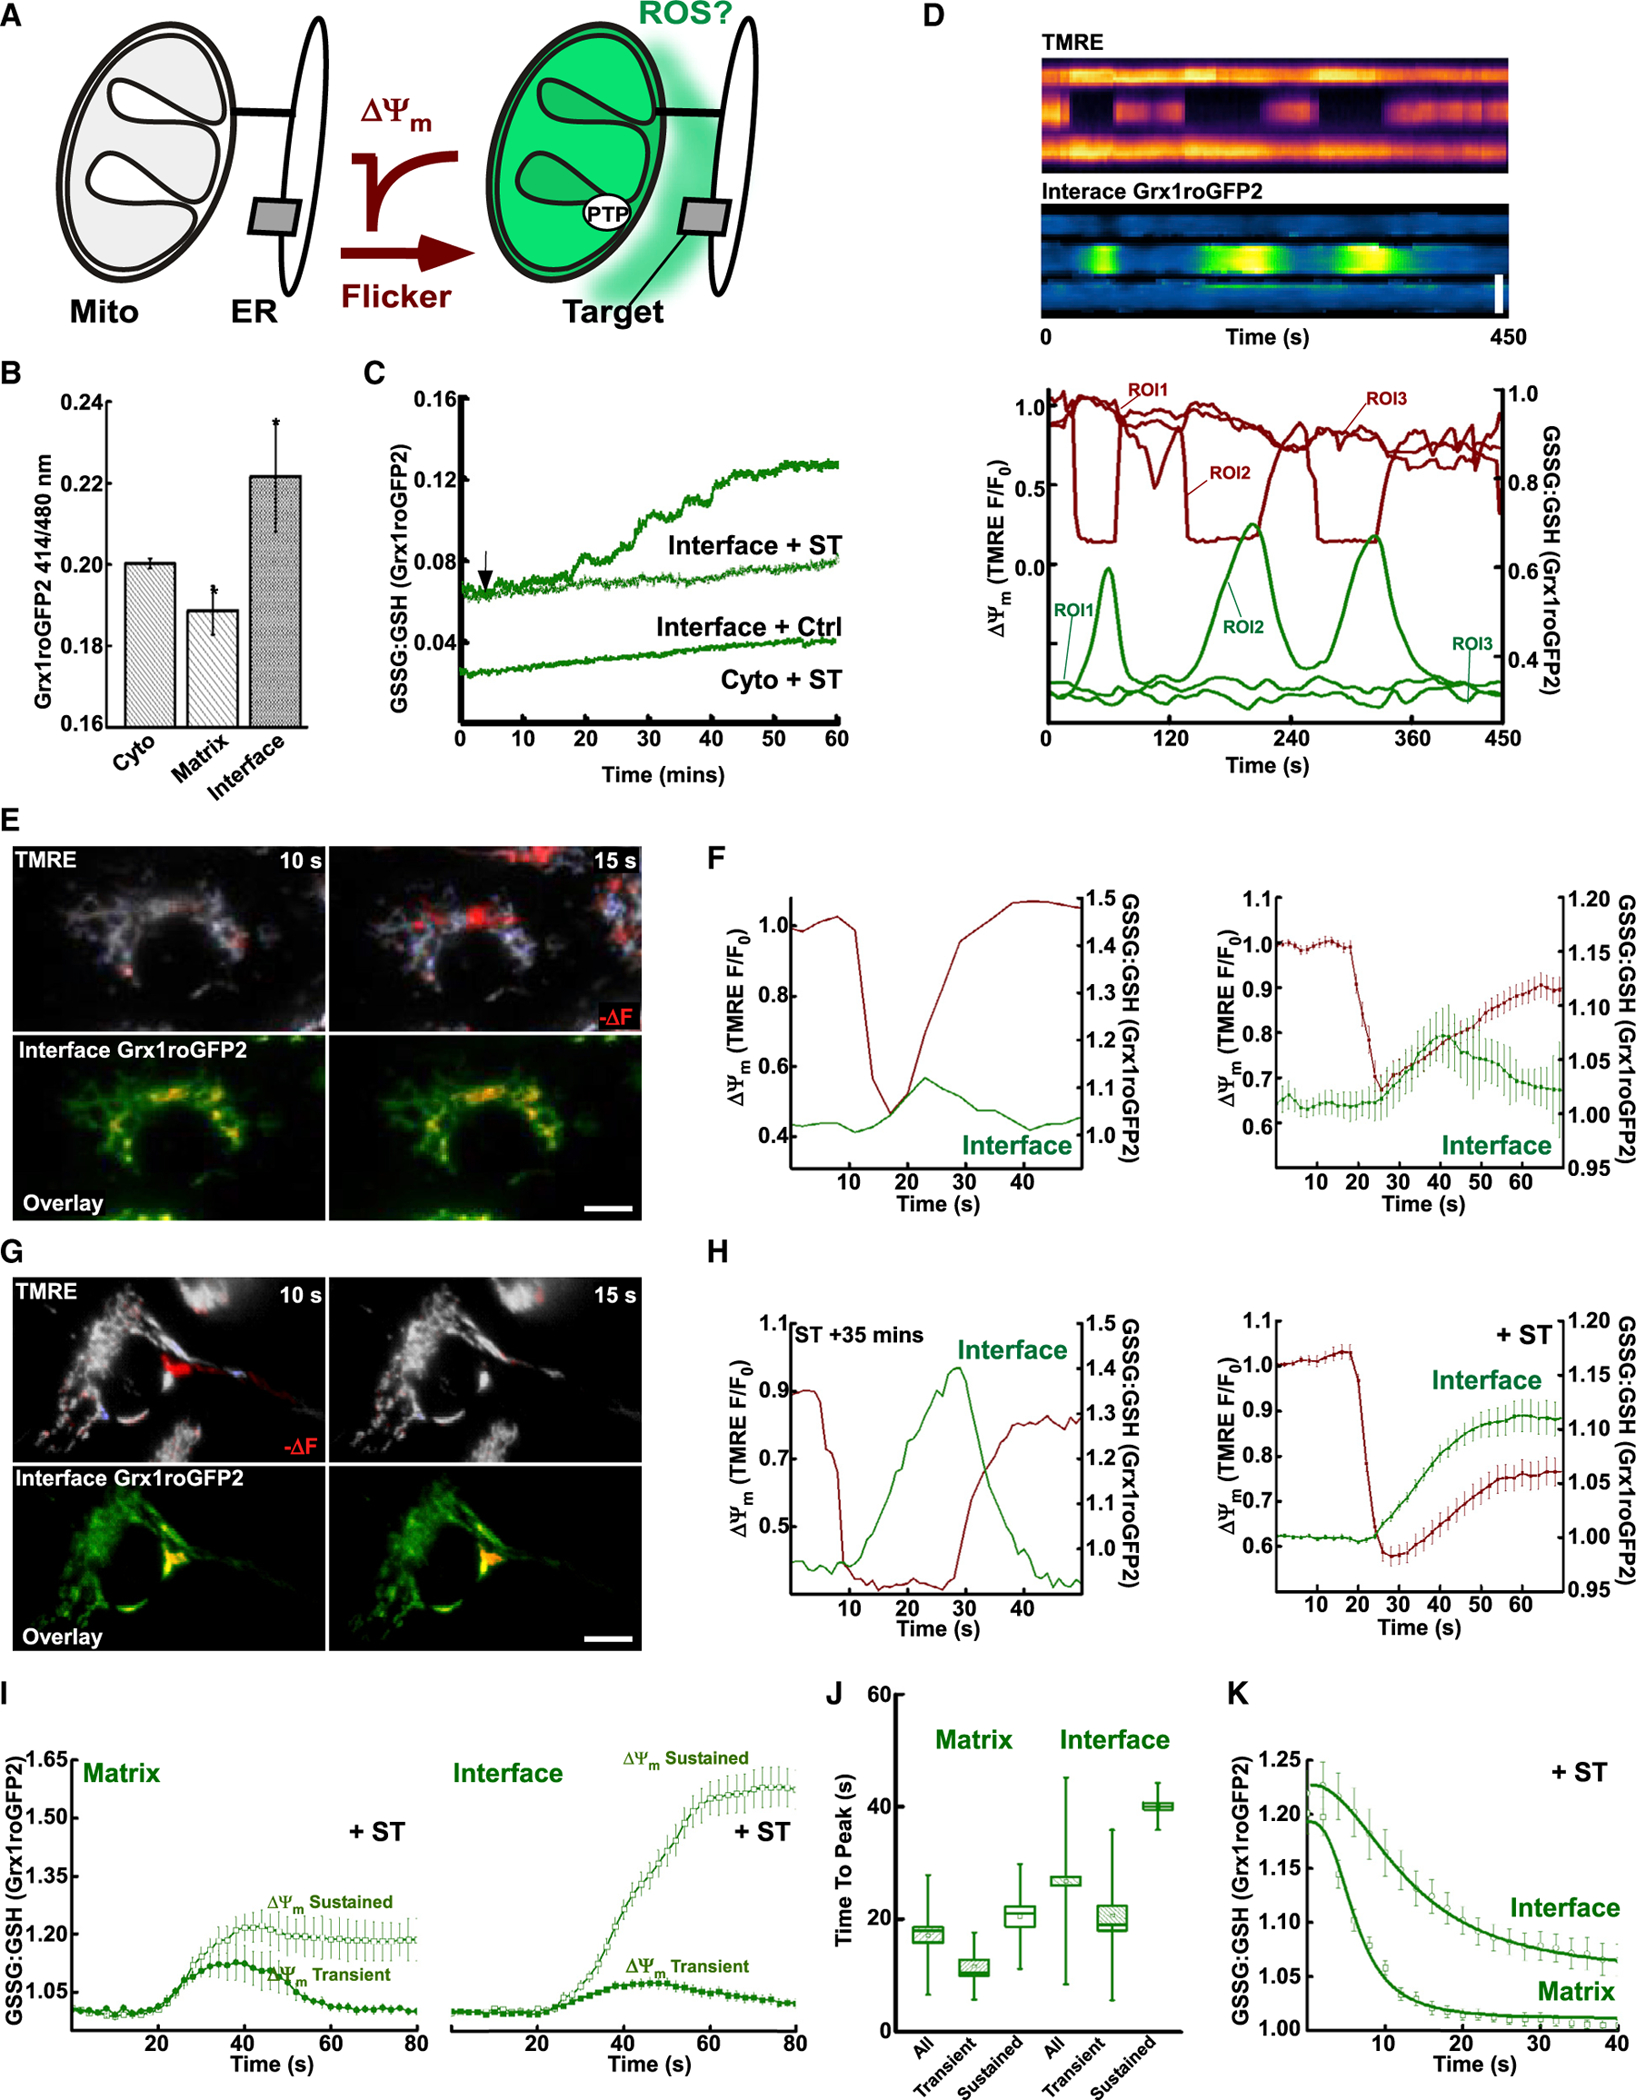
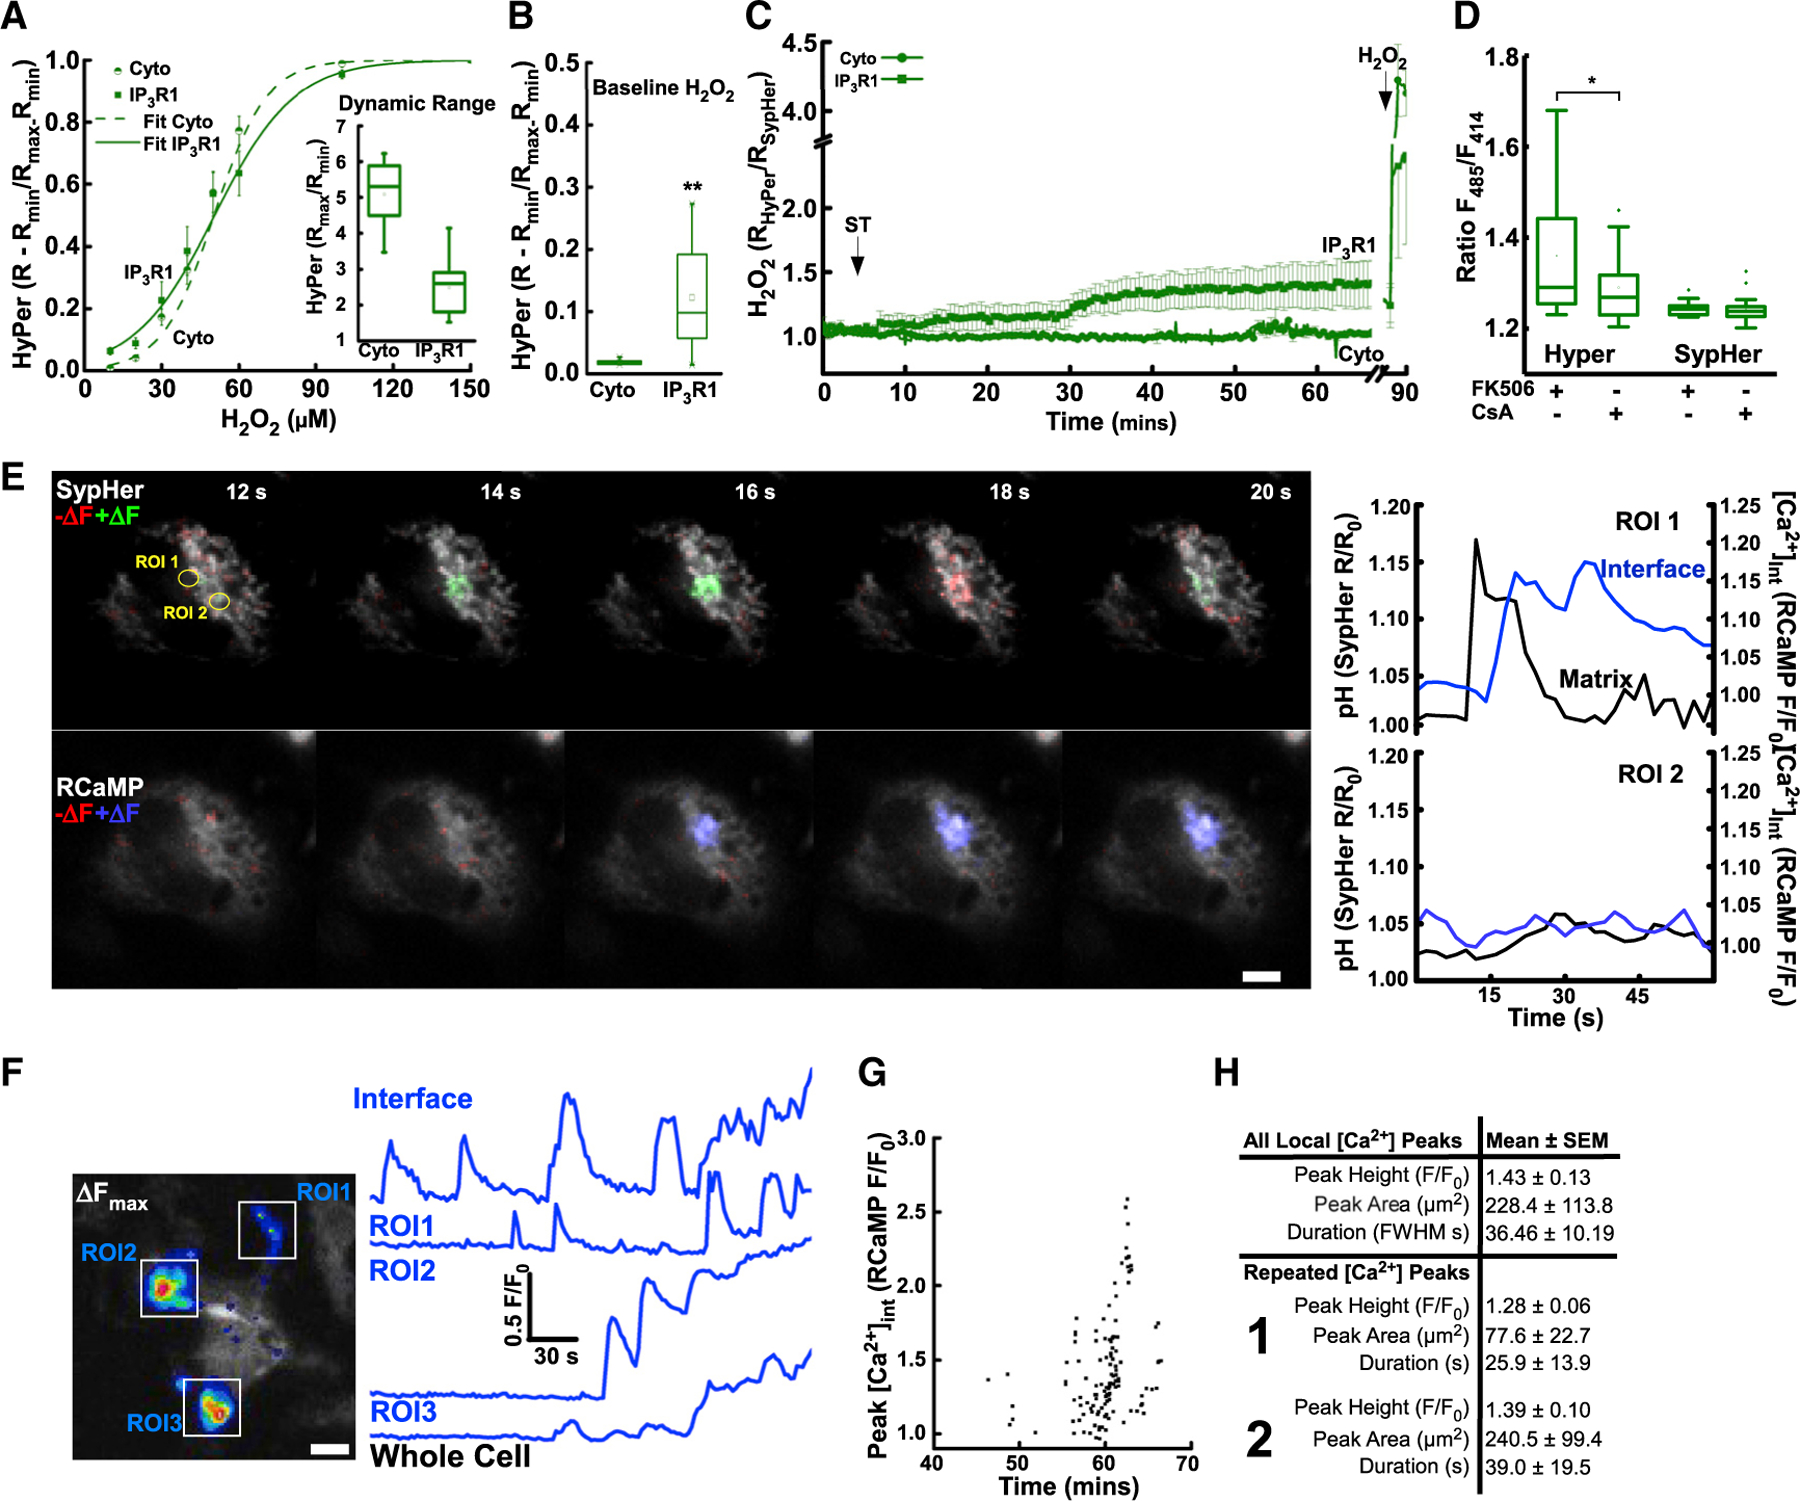
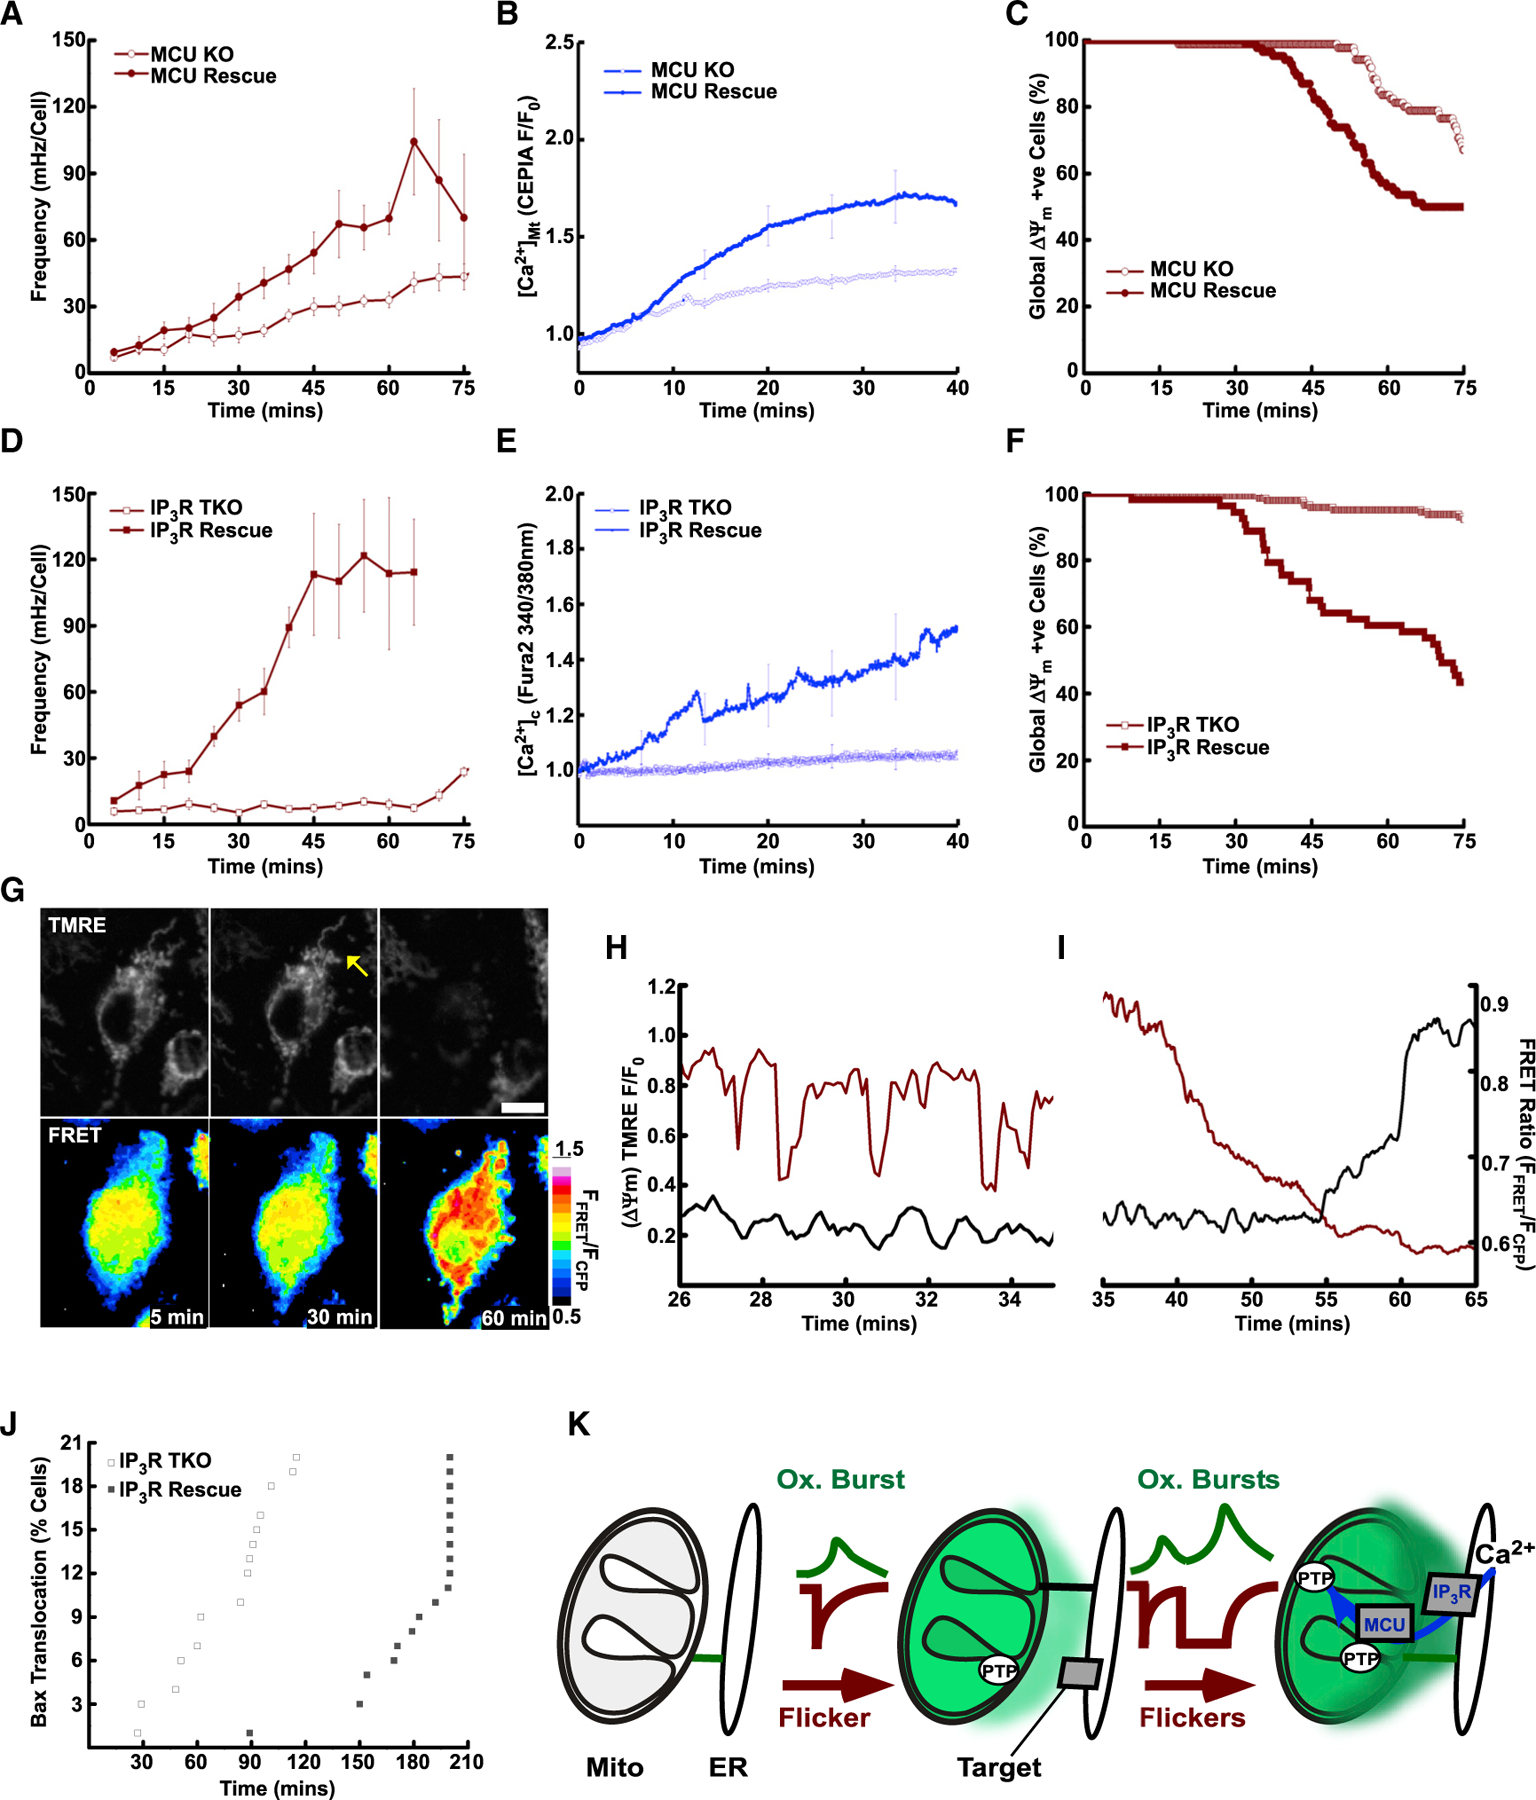
The emerging role of mitochondria as signaling organelles raises the question of whether individual mitochondria can initiate heterotypic communication with neighboring organelles. Using fluorescent probes targeted to the endoplasmic-reticulum-mitochondrial interface, we demonstrate that single mitochondria generate oxidative bursts, rapid redox oscillations, confined to the nanoscale environment of the interorganellar contact sites. Using probes fused to inositol 1,4,5-trisphosphate receptors (IP3Rs), we show that Ca2+ channels directly sense oxidative bursts and respond with Ca2+ transients adjacent to active mitochondria. Application of specific mitochondrial stressors or apoptotic stimuli dramatically increases the frequency and amplitude of the oxidative bursts by enhancing transient permeability transition pore openings. Conversely, blocking interface Ca2+ transport via elimination of IP3Rs or mitochondrial calcium uniporter channels suppresses ER-mitochondrial Ca2+ feedback and cell death. Thus, single mitochondria initiate local retrograde signaling by miniature oxidative bursts and, upon metabolic or apoptotic stress, may also amplify signals to the rest of the cell.

Keywords: Ca2+ microdomain; Inositol-1,4,5-trisphosphate receptor; Mitochondrial retrograde signaling; Organelle contacts; Redox nanodomain.


Conflict of interest statement

Declaration of interests The authors declare no competing interests.

Figures

Figure 1.
Figure 1.. Spontaneous and stimulated mPTP events underpin the intra- and extra-mitochondrial features of mitochondrial flickers
(A) Airyscan imaging of TMRE and calcein-labeled HepG2 cells. Plots of whole-cell ROI of TMRE (inset; red) and calcein (inset; teal). (B) Calcein decline following transient depolarization events in single mitochondria. (C) Decline in calcein proportional to duration of depolarization event. (D) Oligo increased mitochondrial membrane potential (ΔΨm). (E) Increased flicker frequency induced by Oligo. (F) ST promoted global depolarization. (G) Increased flicker frequency induced by ST (Pearson’s correlation: Ctrl, 0.4075; ST, 0.927). (H) ΔΨm flickers accompanied by stepwise declines in calcein fluorescence. (I) Mitochondrial calcein decreases sensitivity to CsA. (J) ΔΨm flickers and calcein decrease sensitivity to CsA. (K) ST-induced ΔΨm flickers accompanied by transient elevation in matrix pH measured by SypHer. (L) OMM-targeted SypHer reports acidification at the cytosolic surface of the OMM during flickers. (D)–(G) and (J) present mean ± SEM. Scale bars, 10 µm.
Figure 2.
Figure 2.. Mitochondrial flickers generate dynamic redox signals at the ER-mitochondrial interface
(A) Schematic of hypothesis, flicker-induced oxidative redox shift (green) of interface. (B) Redox poise (GSSG/GSH ratio) in unstimulated cells measured by Grx1-roGFP2 targeted to the cytosol (Cyto), mitochondrial matrix (Matrix), and ER-mitochondrial interface (Interface); *p < 0.05, two-way ANOVA. (C) Redox poise following addition of ST. (D) Kymograph of ΔΨm (TMRE, upper) and Interface GSSG/GSH ratio (Grx1roGFP2, lower) from a 1 × 4 µm ROI crossing three adjacent mitochondria. Line plots (lower) of the region split into three ROIs (ROI1–ROI3). (E) Spontaneous transient depolarization (−ve ΔΨm: −ve ΔF TMRE, red) of single mitochondrion (upper) during flicker. Interface GSSG/GSH ratio adjacent to the parent organelle (left, lower row: Grx1roGFP2 overlay; 415 nm, red; 485 nm, green). ΔΨm (right) (TMRE 577 nm F/F0, deep red) and GSSG/GSH (Grx1roGFP2, green). (F) ΔΨm and interface GSSG/GSH in unstimulated cells, single example event (left) and flickers synchronized to half ΔTMRE (TMRE F/F0 mean ± SEM, deep red; Grx1roGFP Ratio/Ratio0, green, right). (G) Flicker (−ve ΔΨm: −ve ΔF TMRE, red) of single mitochondrion (upper row) during ST treatment. Interface GSSG/GSH. (H) ΔΨm and interface GSSG/GSH during flicker. Example event (left) and synchronized events (right) to half ΔTMRE (TMRE F/F0, deep red; Grx1roGFP Ratio/Ratio0, green). (I) Matrix (left) and Interface (right) of GSSG/GSH responses to transient (filled) and sustained (empty) flickers. (J) Time to peak of Grx1roGFP2 response normalized to half ΔTMRE. Matrix (left) and Interface divided into responses from transient ΔΨm (<20 s) and sustained (>20 s) flickers. (K) Mean and logistic fits of Matrix and Interface GSSG/GSH normalized to half ΔTMRE recovery (F), (H) right, (I), and (K) present mean ± SEM. (J) Mean, median, 25th/75th percentile and outliers. Scale bars, 10 µm.
Figure 3.
Figure 3.. Mitochondrial flickers promote local Ca2+ signals via oxidation of the IP3R
(A) Functional calibration of HyPer-IP3R1 versus cytosolic HyPer (Cyto) oxidized with stepwise H2O2 and fully reduced with DTT, mean ± SEM, with dose response (logistic) curve (fit). Inset: sensor dynamic range, ratio (Rmin: DTT) to (Rmax: H2O2). (B) Baseline oxidation of HyPer cytosol (Cyto) or IP3R (IP3R1) in HepG2. **Significance, Mann-Whitney U = 9, p = 0.003. (C) IP3R and cytosolic H2O2 levels following ST-induced flickers. (D) ST-induced flicker oxidation of HyPer-IP3R and SypHer-IP3R control in the presence of CsA versus FK506 control. (E) Flicker and local Ca2+ transient. Difference image analysis of matrix pH (SypHer480nm +ve and −ve change: first row +DF, green; −ΔF, blue). Difference imaging of interface Ca2+ (second row [Ca2+]Int RCaMP577nm +ve +DF, blue). pH (SypHer R/R0; black) and [Ca2+]Int (RCaMP F/F0; blue) (ROI 1, right upper; ROI 2, right lower). Lower: 3D renderings of matrix pH (SypHer 480/414 nm) and [Ca2+]Int (RCaMP, F577 nm) at 16 s time point. (F) Independent subcellular release sites, maximum [Ca2+]Int in 300 s period increase (RCaMP577nm, ΔFmax). Traces of three independent release sites (ROI1–ROI3; and whole cell; lowest). (G) Individual [Ca2+]Int transients, amplitude versus time. (H) [Ca2+]Int amplitude (peak height, F/F0), area of [Ca2+]Int transient (peak area, µm2), and duration at half maximum amplitude. Repeated [Ca2+]Int with first (upper) and second iteration (lower) assessed separately. (A) inset, (B), and (D), mean, median, 25th/75th percentile and outliers. Scale bars, 10 µm.
Figure 4.
Figure 4.. Mitochondrial flicker activity interacts with ER-mitochondrial Ca2+ transport
(A) Flicker frequency in MCU-KO and cells rescued with MCU-FLAG (MCU-Rescue; filled) following stimulation with ST. (B) Matrix Ca2+ rise assessed with mtCEPIA3 ([Ca2+]Mt: CEPIA 485 nm F/F0) in MCU KO (empty) and Rescue (filled). (C) Kaplan-Meier plots of cell survival indicated by permanent global depolarization of ΔΨm in MCU-KO (empty) and MCU-Rescue cells (filled). (D) Flicker frequency in IP3R-TKO without (empty) and with YFP-IP3R1 rescue (IP3R Rescue; filled) following stimulation with ST (addition: 5 min). (E) Changes in cytoplasmic Ca2+ measured with Fura2 ([Ca2+]Cyt Fura2 340/380 nm). (F) Kaplan-Meier plots global ΔΨm loss in IP3R TKO and IP3R1 Rescue. (G) ΔΨm (top) flicker (arrow) and terminal depolarization (right) of the mitochondrial network and oligomerization of Bax CFP-Bax and YFP-Bax FRET pair (lower). (H) ΔΨm flickers (TMRM F/F0 red) with Bax FRET (FFRET/FCFP, black). (I) Continuation of (H), Bax FRET increase (black) coincident with global ΔΨm loss (red). (J) Bax oligomerization in IP3R TKO and IP3R Rescue cells treated with ST. (K) Schematic of flicker-induced oxidation of the interface (green) engaging targets of the Ca2+ signaling network (IP3R&MCU). Scale bars, 10 µm. (A), (B), (D), and (E) present mean ± SEM.

References

    1. Akerboom J, Carreras Calderón N, Tian L, Wabnig S, Prigge M, Tolö J, Gordus A, Orger MB, Severi KE, Macklin JJ, et al. (2013). Genetically encoded calcium indicators for multi-color neural activity imaging and combination with optogenetics. Front. Mol. Neurosci 6, 2. - PMC - PubMed
    1. Alzayady KJ, Wang L, Chandrasekhar R, Wagner LE 2nd, Van Petegem F, and Yule DI (2016). Defining the stoichiometry of inositol 1,4,5-trisphosphate binding required to initiate Ca2+ release. Sci. Signal 9, ra35. - PMC - PubMed
    1. Aon MA, Cortassa S, Marbán E, and O’Rourke B. (2003). Synchronized whole cell oscillations in mitochondrial metabolism triggered by a local release of reactive oxygen species in cardiac myocytes. J. Biol. Chem 278, 44735–44744. - PubMed
    1. Aryaman J, Johnston IG, and Jones NS (2019). Mitochondrial heterogeneity. Front. Genet 9, 718. - PMC - PubMed
    1. Bánsághi S, Golenár T, Madesh M, Csordás G, RamachandraRao S, Sharma K, Yule DI, Joseph SK, and Hajnóczky G. (2014). Isoform- and species-specific control of inositol 1,4,5-trisphosphate (IP3) receptors by reactive oxygen species. J. Biol. Chem 289, 8170–8181. - PMC - PubMed

Publication types

MeSH terms

LinkOut - more resources