. 2021 Aug 19;81(16):3323-3338.e14.
doi: 10.1016/j.molcel.2021.06.031. Epub 2021 Aug 4.

METTL1-mediated m7G modification of Arg-TCT tRNA drives oncogenic transformation

Affiliations

METTL1-mediated m7G modification of Arg-TCT tRNA drives oncogenic transformation

Esteban A Orellana et al. Mol Cell. .

Abstract

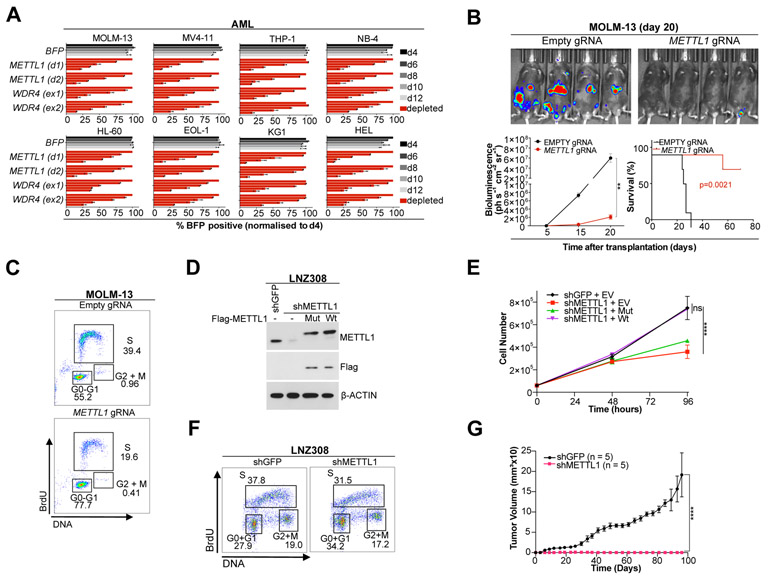
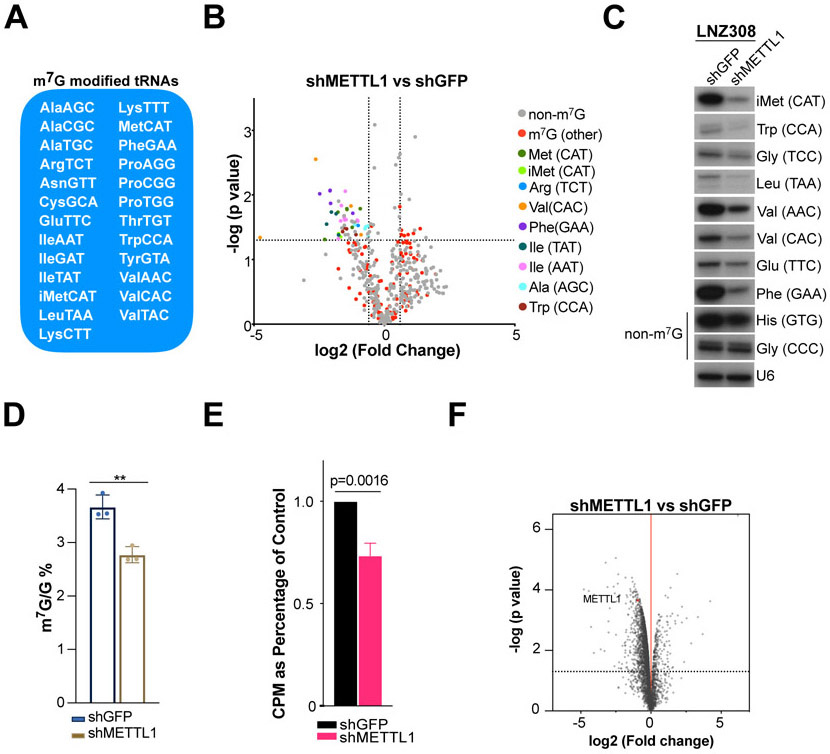
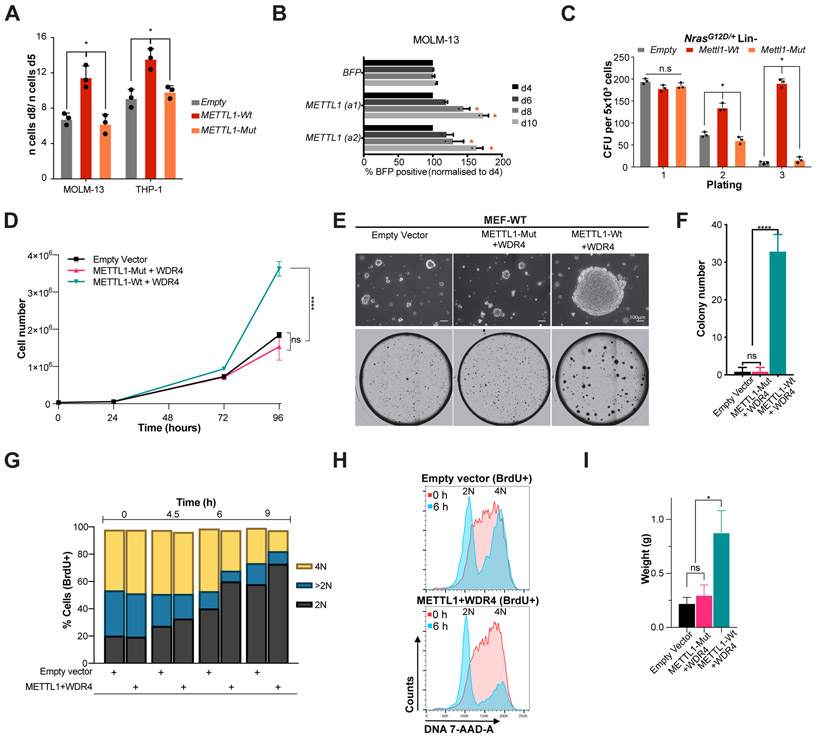
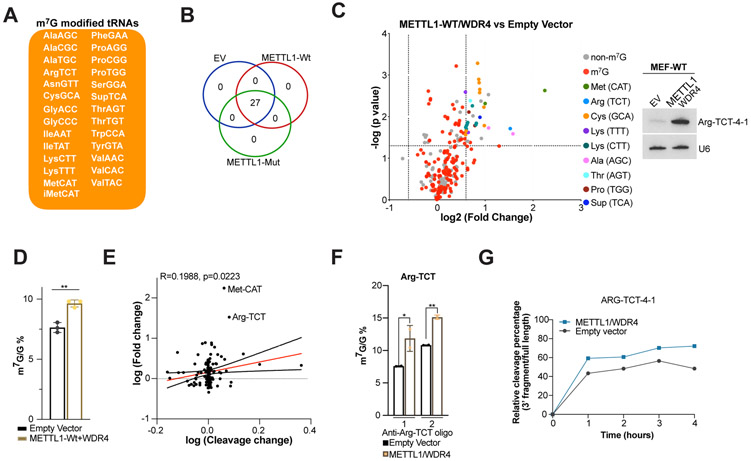
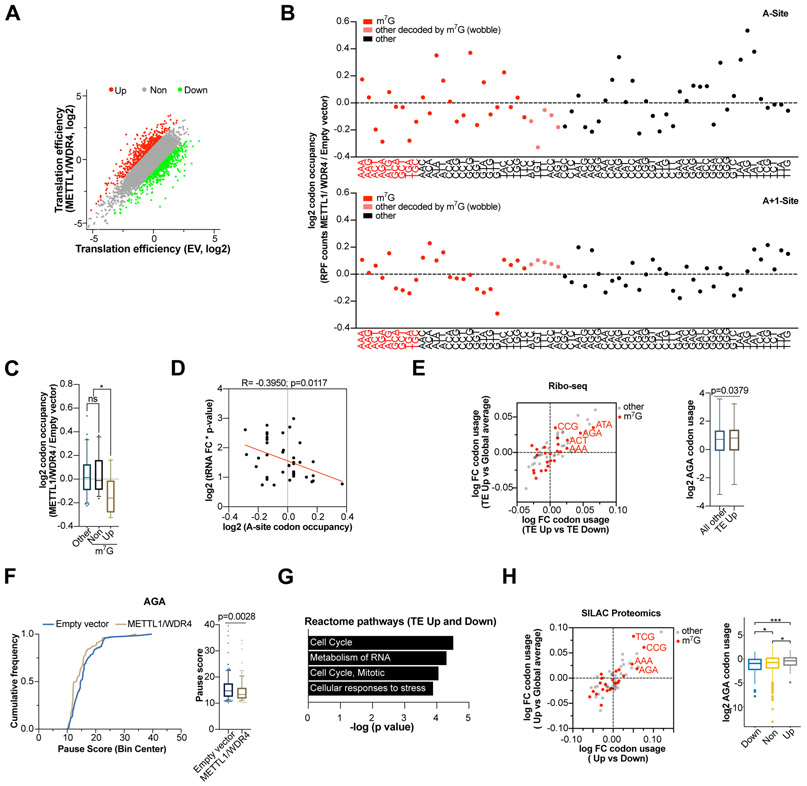
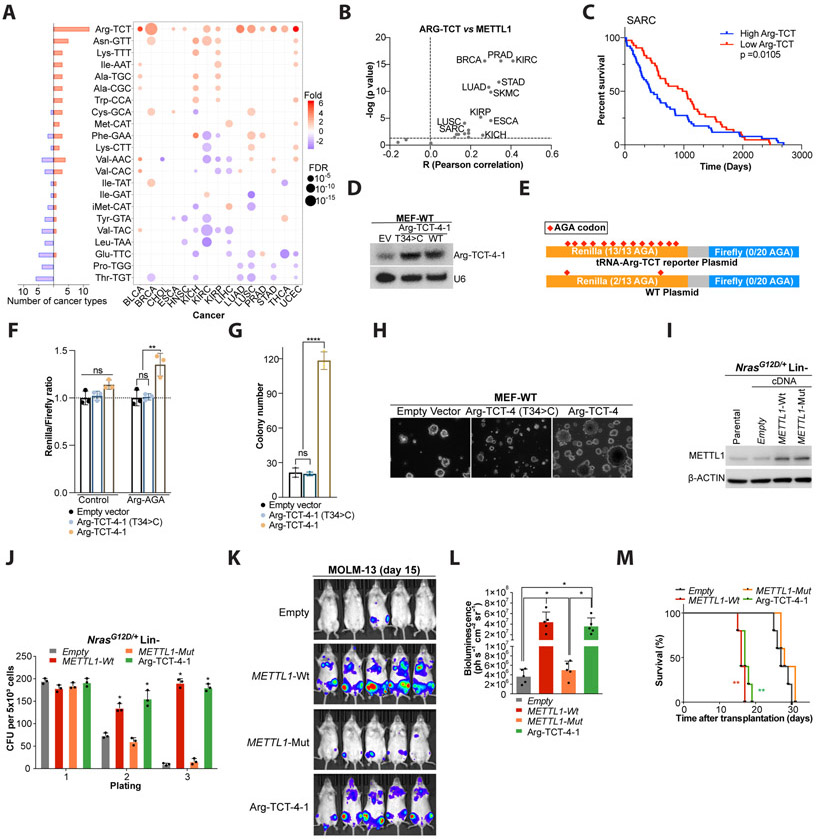
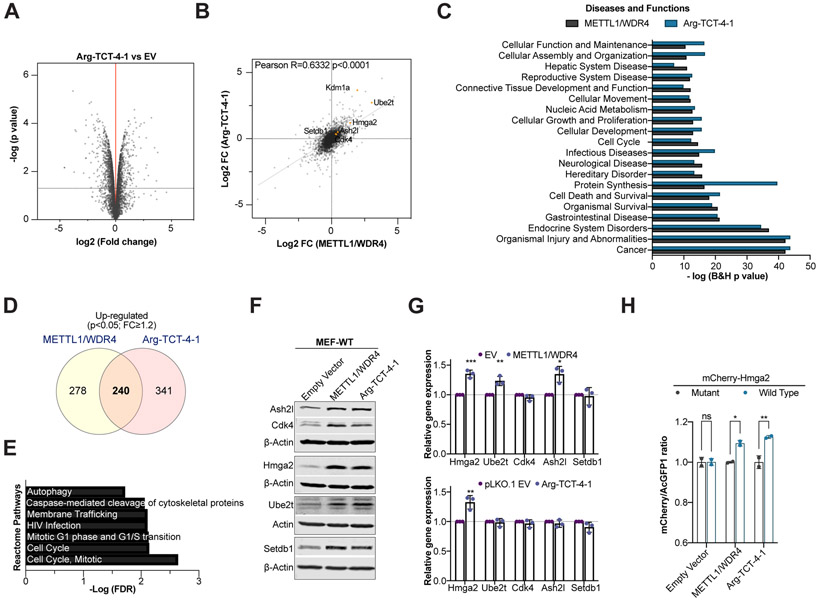
The emerging "epitranscriptomics" field is providing insights into the biological and pathological roles of different RNA modifications. The RNA methyltransferase METTL1 catalyzes N7-methylguanosine (m7G) modification of tRNAs. Here we find METTL1 is frequently amplified and overexpressed in cancers and is associated with poor patient survival. METTL1 depletion causes decreased abundance of m7G-modified tRNAs and altered cell cycle and inhibits oncogenicity. Conversely, METTL1 overexpression induces oncogenic cell transformation and cancer. Mechanistically, we find increased abundance of m7G-modified tRNAs, in particular Arg-TCT-4-1, and increased translation of mRNAs, including cell cycle regulators that are enriched in the corresponding AGA codon. Accordingly, Arg-TCT expression is elevated in many tumor types and is associated with patient survival, and strikingly, overexpression of this individual tRNA induces oncogenic transformation. Thus, METTL1-mediated tRNA modification drives oncogenic transformation through a remodeling of the mRNA "translatome" to increase expression of growth-promoting proteins and represents a promising anti-cancer target.

Keywords: Arg-TCT; METTL1; N(7)-methylguanosine; cancer; m(7)G; oncogene; tRNA; translation.


Conflict of interest statement

Declaration of interests R.I.G. and F.J.S. are co-founders and scientific advisory board members of 28-7 Therapeutics. R.I.G. is a co-founder and scientific advisory board member of Theon Therapeutics. E.Y. is co-funded by STORM Therapeutics.

Figures

Figure 1.
Figure 1.. METTL1 is necessary for cancer cell growth and oncogenicity.
(A) Competitive co-culture of lentiviral METTL1 or WDR4 or Empty gRNA-transfected (BFP positive) vs untransfected panel of human AML cell lines normalized to %BFP on day 4 (mean ± s.d., n = 2). (B) Bioluminescence imaging of mice transplanted with luciferase-expressing MOLM-13 cells, at the indicated timepoints, upon transduction with METTL1 or control gRNAs. Quantification of bioluminescence and Kaplan–Meier plot showing the mouse survival. A log-rank test was performed. (n = 5 animals per group). **P < 0.01. (C) BrdU staining and in vivo cell cycle analysis in gRNA transduced MOLM-13 cells at day 10 post-transplantation. (D) Western blot showing METTL1 ectopic expression in stable METTL1 knockdown (KD) human GBM cells (LNZ308). (E) Cell proliferation analysis of KD cells expressing wild type or mutant METTL1. Error bars: means ± s.d. Each experiment corresponds to n=3, Each experiment was repeated 3 times. ****P < 0.0001, ns, not significant. Two-way analysis of variance (ANOVA) and Bonferroni correction. (F) Cell cycle analysis of LNZ308 cells comparing sh-METTL1 versus shGFP control. (G) In vivo tumor formation of LNZ308 cells (n = 5; error bars: means ± SEM). ****P < 0.0001. Two-way analysis of variance (ANOVA) and Bonferroni correction.
Figure 2.
Figure 2.. METTL1 depletion leads to decreased levels of m7G-modified tRNAs and global translation defects.
(A) Subset of m7G modified tRNAs identified in human GBM cells LNZ308. (B) Changes in tRNA abundance upon METTL1 knockdown. (C) tRNA levels measured via Northern blot. (D) HPLC-MS/MS analysis of total RNA comparing sh-METTL1 samples versus shGFP control samples. Error bars: means ± s.d. Each experiment corresponds to n=3. P-value from Paired Student’s t-test. (E) [35S] Methionine incorporation measured via liquid scintillation. CPM: counts per minute. N = 3, Paired Student’s t-test. (F) Changes in protein abundance between METTL1/WDR4 (heavy) overexpressing cells and empty vector (light) control cells measured by SILAC-based proteomics n=3, moderated t-test.
Figure 3.
Figure 3.. METTL1 overexpression is highly oncogenic.
(A) Proliferation assay using MOLM-13 and THP-1 cells after overexpression of METTL1 (WT and catalytic-dead) and compared to empty control (mean ± s.d., n = 3). *P < 0.05. (B) Competitive co-culture of human AML MOLM-13-dCas9 cells post-transduction with either METTL1 or Empty gRNA (BFP positive) vs untransfected panel, normalized to %BFP on day 4 (mean ± s.d., n = 2). (C) Colony formation assay of primary non-leukemic NrasG12D/+ lineage negative HSPCs, upon ectopic expression of WT and catalytic-mutant METTL1 compared to empty control. CFU, colony forming units; n.s., not significant; *p < 0.01 (t-test). (D) Representative cell proliferation analysis of METTL1-Wt/WDR4 overexpressing cells compared to METTL1-Mut/WDR4 and empty vector cells negative control cells. Error bars: means ± s.d. Each experiment corresponds to n=3, Each experiment was repeated 3 times. ****P < 0.0001, ns, not significant. Two-way analysis of variance (ANOVA) and Bonferroni correction. (E) Colony formation in soft agar: representative pictures. (F) Quantification of colony formation in soft agar. Error bars: means ± s.d. Each experiment corresponds to n=3, Each experiment was repeated 3 times. ****P < 0.0001, ns, not significant. One-way analysis of variance (ANOVA) and Bonferroni correction. (G) Cell cycle analysis of METTL1/WDR4 overexpressing cells versus empty control. DNA content (2N, >2N or 4N) was analyzed at different time points after BrdU labeling. Bars indicate the percentage of BrdU+ cells (0 hours) that transitioned from 2N DNA content to 4N DNA (G2) and after undergoing mitosis transitioned to 2N DNA. (H) DNA content analysis of BrdU+ cells of METTL1/WDR4 overexpressing cells versus empty vector control at 0 and 6 hours post labeling. (I) In vivo tumor formation (n = 5; error bars: means ± SEM). Error bars: means ± s.d. *P < 0.05, ns, not significant. One-way analysis of variance (ANOVA) and Bonferroni correction.
Figure 4.
Figure 4.. METTL1 overexpression accumulates a subset m7G-modified tRNAs
(A) Subset of m7G modified tRNAs identified in mouse MEF-WT cells. (B) Overlap of m7G tRNAs among different conditions. (C) Changes in tRNA abundance upon overexpression of METTL1-WtWDR4. On the right, Arg-TCT-4 levels measured via Northern blot. (D) HPLC-MS/MS analysis of total RNA comparing METTL1/WDR4 overexpressing samples versus empty vector control samples. Error bars: means ± s.d. Each experiment corresponds to n=3. P-value from Paired Student’s t-test. (E) Correlation between tRNA abundance change and change in m7G methylation status measured as a change in NaBH4/Aniline cleaved tRNA fragments in METTL1-Wt/WDR4 vs Empty vector. Pearson correlation. (F) HPLC-MS/MS analysis of isolated Arg-TCT tRNA comparing METTL1/WDR4 overexpressing samples versus empty vector control samples. Oligo 1: Arg-TCT-1,2,3,5; Oligo 2: Arg-TCT-4. Error bars: means ± s.d. Each experiment corresponds to n=2. P-value from Paired Student’s t-test. (G) Quantification of m7G levels in Arg-TCT-4-1 using time-dependent NaBH4/Aniline cleavage followed by Northern blot in empty vector and METTL1/WDR4 OE samples (ratio between 3'fragment/full length).
Figure 5.
Figure 5.. METTL1/WDR4 overexpression leads to translational changes.
(A) Scatterplot of translation efficiency (TE) in METTL1-Wt/WDR4 OE versus empty vector cells. TE was calculated by dividing the ribosome-protected fragments (RPF) signals to the input RNA-seq signals. (B) Ribosome occupancy at individual codons at A sites and A+1 sites. Plots represent the relative ribosome protected fragment signals from METTL1/WDR4 relative to empty vector control cells. The codons are separated into m7G (red) and not m7G-modified (black) groups. The codons in red correspond to the group of codons with corresponding tRNAs increased in abundance upon METTL1/WDR4 overexpression. Dots in pink represent codons decoded by m7G tRNAs by wobble effect due to the undetected levels of their corresponding tRNAs. (C) Overall codon occupancy among the group of codons with corresponding tRNAs increased in abundance (Up), other m7G decode codons whose tRNAs don’t show changes in abundance (Non) and non-m7G dependent codons (Other). P values from one -way ANOVA, *P < 0.05; n.s. not significant. (D) Pearson correlation analysis between A site occupancy and tRNA abundance changes. (E) Scatterplot of codon usage changes in the differentially translated genes (Up vs Down and Up-vs All other) in METTL1/WDR4 OE cells. Dots in red indicate m7G decoded codons. On the right, comparison of AGA codon usage between TE-Up genes versus all other genes. P value from Student’s t-test. (F) Analysis of ribosome pausing in AGA codons between empty vector and METTL1/WDR4 OE cells. P value was calculated from a two-sided Mann-Whitney test. (G) Gene ontology analysis of Reactome pathway enrichment using the TE downregulated and upregulated genes upon METTL1-Wt/WDR4 overexpression. (H) Scatterplot of codon usage changes in up-regulated (FC≥1.2) proteins in METTL1-Wt/WDR4 OE cells (Up vs Down and Up-vs All other) in METTL1/WDR4 OE cells. Dots in red indicate m7G decoded codons. On the right, comparison of AGA codon usage between up-regulated proteins versus down and non-change. P value from one-way ANOVA, ***P < 0.001; *P < 0.05.
Figure 6.
Figure 6.. tRNA-Arg-TCT-4-1 overexpression promotes malignant transformation.
(A) Altered tRNA (m7G subset) expression in human tumors compared to normal counterparts. Orange denotes up-regulation and blue down-regulation. Boxplot on right summarizes tumor types with up or down-regulation. (B) Pearson correlation analyses between METTL1 and Arg-TCT expression levels in 22 human tumors (see Fig. S11A). (C) Kaplan-Meier survival curve of SARC patients with low vs high Arg-TCT expression levels. Mean cut-off. Data: TCGA. Wilcoxon test. (D) Northern Blot showing Arg-TCT-4-1 overexpression in MEF-WT cells. (E) Scheme of Renilla sensor enriched with AGA codons. (F) Renilla reporter activity upon Arg-TCT overexpression. Renilla light units were normalized to firefly luciferase and empty vector was set to 1. Error bars: means ± s.d. Each experiment corresponds to n=3, Each experiment was repeated 3 times. One-way analysis of variance (ANOVA) with Bonferroni correction. **, p<0.01; ns, not significant. (G) Quantification of colony formation in soft agar. Error bars: means ± s.d. Each experiment corresponds to n=3, Each experiment was repeated 3 times. ****P < 0.0001, ns, not significant. One-way analysis of variance (ANOVA) and Bonferroni correction. (H) Representative pictures of colony formation in soft agar of MEF-WT cell overexpressing Arg-TCT-4-1 wild type or Arg-TCT-4-1 T34>C mutant. (I) Western blot analysis for METTL1 post-overexpression of WT or catalytic-dead METTL1 in primary non-leukemic NrasG12D/+ HSPCs. (J) Colony formation assay of primary non-leukemic NrasG12D/+ lineage negative HSPCs, upon ectopic expression of either METTL1 (WT and catalytic-dead) or Arg-TCT-4-1 compared to empty control (mean ± s.d., n = 3). CFU, colony forming units; n.s., not significant; *p < 0.01 (t-test). (K) Bioluminescence imaging of mice transplanted with luciferase-expressing MOLM-13 cells upon overexpression of either METTL1 (WT and catalytic-dead) or Arg-TCT-4-1 compared to empty control at the indicated timepoint. (L) Quantification of whole-body bioluminescence related to Figure 6K (mean ± s.d., n = 5). *P < 0.01. (M) Kaplan–Meier plot showing the survival time of the mice related to Figure 6K. A log-rank test was performed. (n = 5 animals per group). **P < 0.01.
Figure 7.
Figure 7.. tRNA-Arg-TCT-4-1 overexpression recapitulates METTL1/WDR4-mediated proteome changes.
(A) Changes in protein abundance between Arg-TCT-4-1 (heavy) overexpressing cells and empty vector (light) control cells measured by SILAC-based proteomics n=3, moderated t-test. (B) Pearson correlation analysis between fold changes in METTL1/WDR4 and Arg-TCT-4-1 overexpressing cells (3,873 proteins that were detected in both groups were included in the analysis). (C) Gene ontology analysis of differentially expressed proteins in METTL1/WDR4 and Arg-TCT-4-1 overexpressing cells. (D) Venn diagram showing the overlap of METTL1/WDR4 and Arg-TCT-4-1 proteomic datasets (p<0.05 and FC≥1.2). (E) Gene ontology analysis of the proteins in the overlap from (D). Representative western blot analysis of a set of proteins found to be up-regulated in METTL1/WDR4 and Arg-TCT-4-1 datasets in MEF-WT cells. (G) Relative mRNA expression measured via RT-qPCR in MEF-WT cells. RPLP0 was used as normalizer and EV samples were set to 1. n=3 with three technical triplicates, p values from unpaired Student’s t-test, ***P < 0.001; **P < 0.01; *P < 0.05. (H) mCherry/acGFP1 ratios measured by flow cytometry between mCherry-Hmga2-WT (5 out of 12 AGA codons) and mCherry-Hmga2-MUT (0 out of 12 AGA codons) reporters. Data are mean ± s.d. n=2. P values from two-way ANOVA with Šídák correction; **P < 0.01; *P < 0.05.

Comment in

Similar articles

Cited by

References

    1. Alexandrov A, Chernyakov I, Gu W, Hiley SL, Hughes TR, Grayhack EJ, and Phizicky EM (2006). Rapid tRNA decay can result from lack of nonessential modifications. Mol Cell 21, 87–96. - PubMed
    1. Alexandrov A, Grayhack EJ, and Phizicky EM (2005). tRNA m7G methyltransferase Trm8p/Trm82p: evidence linking activity to a growth phenotype and implicating Trm82p in maintaining levels of active Trm8p. RNA 11, 821–830. - PMC - PubMed
    1. Alexandrov A, Martzen MR, and Phizicky EM (2002). Two proteins that form a complex are required for 7-methylguanosine modification of yeast tRNA. RNA 8, 1253–1266. - PMC - PubMed
    1. Anders S, Pyl PT, and Huber W (2015). HTSeq--a Python framework to work with high-throughput sequencing data. Bioinformatics 31, 166–169. - PMC - PubMed
    1. Bahr A, Hankeln T, Fiedler T, Hegemann J, and Schmidt ER (1999). Molecular analysis of METTL1, a novel human methyltransferase-like gene with a high degree of phylogenetic conservation. Genomics 57, 424–428. - PubMed

Publication types