. 2021 Sep 13;56(17):2427-2439.e4.
doi: 10.1016/j.devcel.2021.07.009. Epub 2021 Aug 4.

Chromosomal instability accelerates the evolution of resistance to anti-cancer therapies

Affiliations

Chromosomal instability accelerates the evolution of resistance to anti-cancer therapies

Devon A Lukow et al. Dev Cell. .

Abstract

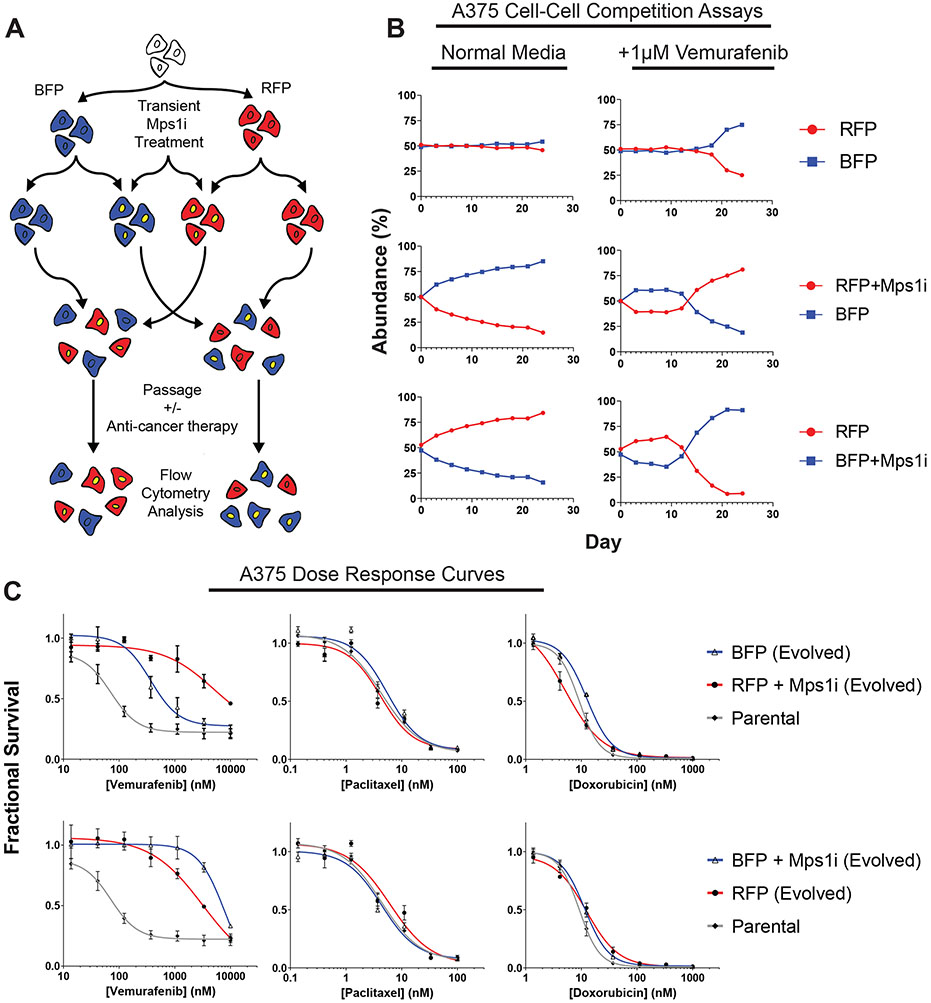
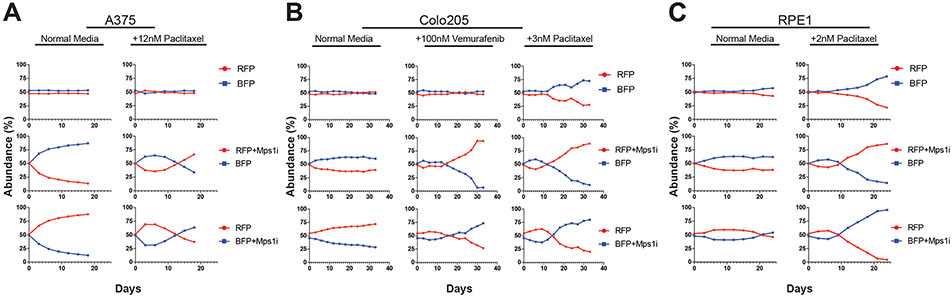
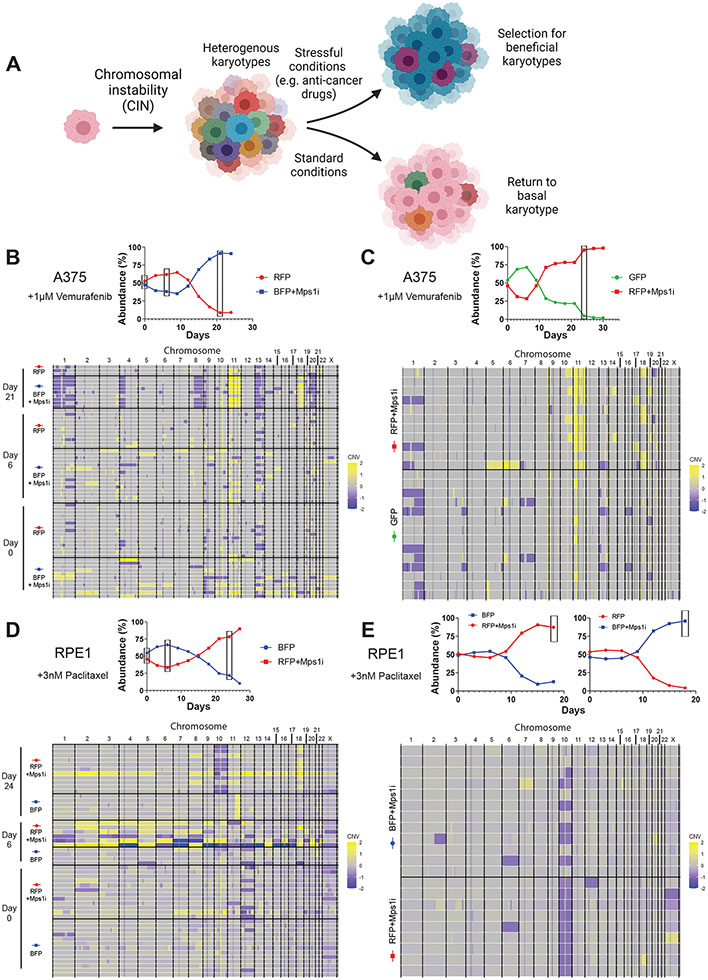
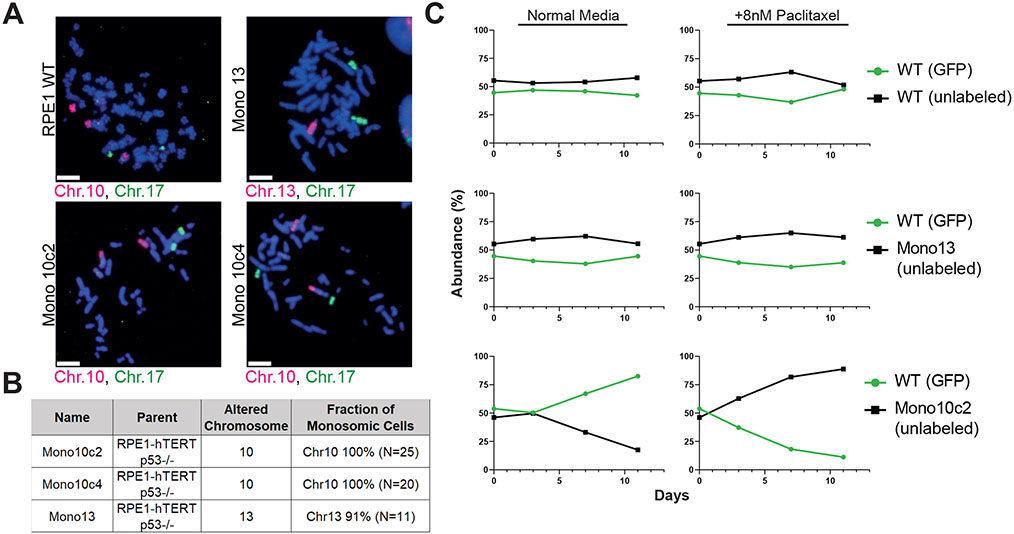
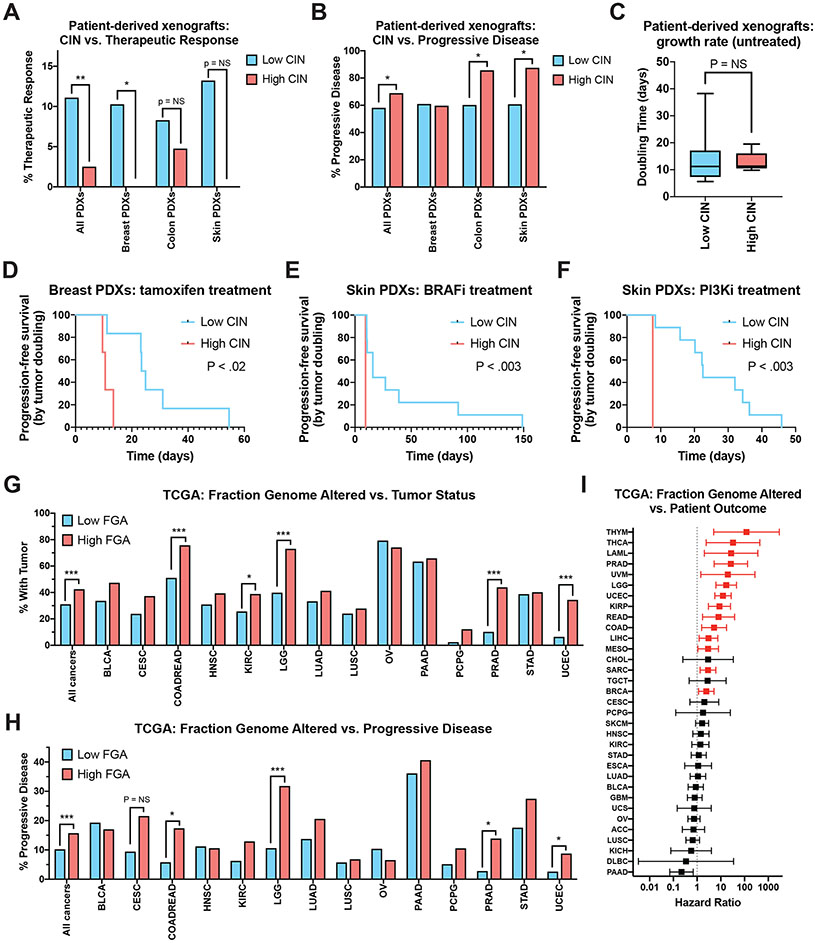
Aneuploidy is a ubiquitous feature of human tumors, but the acquisition of aneuploidy typically antagonizes cellular fitness. To investigate how aneuploidy could contribute to tumor growth, we triggered periods of chromosomal instability (CIN) in human cells and then exposed them to different culture environments. We discovered that transient CIN reproducibly accelerates the acquisition of resistance to anti-cancer therapies. Single-cell sequencing revealed that these resistant populations develop recurrent aneuploidies, and independently deriving one chromosome-loss event that was frequently observed in paclitaxel-resistant cells was sufficient to decrease paclitaxel sensitivity. Finally, we demonstrated that intrinsic levels of CIN correlate with poor responses to numerous therapies in human tumors. Our results show that, although CIN generally decreases cancer cell fitness, it also provides phenotypic plasticity to cancer cells that can allow them to adapt to diverse stressful environments. Moreover, our findings suggest that aneuploidy may function as an under-explored cause of therapy failure.

Keywords: CIN; aneuploidy; cancer; drug resistance; evolution.


Conflict of interest statement

Declaration of interests J.C.S. is a co-founder of Meliora Therapeutics, a member of the advisory board of RTP Ventures, and an employee of Google. This work was performed outside of her affiliation with Google and used no proprietary knowledge or materials from Google. J.M.S. has received consulting fees from Ono Pharmaceuticals and Merck, is a member of the advisory board of Tyra Biosciences and is a co-founder of Meliora Therapeutics.

Figures

Figure 1.
Figure 1.. Transient inhibition of Mps1 accelerates the acquisition of resistance to a BRAF inhibitor.
(A) Schematic outline of the competition experiment. (B) Relative abundance of each A375 cell population under the indicated growth conditions, as determined by flow cytometry. (C) Dose-response curves of the parental A375 cell line or A375 cells purified by flow cytometry from day 24 of the competition experiments in (B), exposed to the indicated drug. N = 3 replicates.
Figure 2.
Figure 2.. Transient inhibition of Mps1 accelerates the acquisition of drug resistance in multiple genetic backgrounds.
(A) Relative abundance of A375 cell populations +/− paclitaxel. See also Figures S2E-F. (B) Relative abundance of Colo205 cell populations +/− vemurafenib, or +/− paclitaxel. See also Figure S2H. (C) Relative abundance of RPE1 cell populations +/− paclitaxel. See also Figure S2G.
Figure 3.
Figure 3.. Cells that develop drug resistance following Mps1i exposure display recurrent aneuploidies.
(A) Diagram modeling selection for beneficial aneuploidies under stressful conditions. (B-C) (Top) Plot of A375 competition in vemurafenib from which cells were isolated for single cell sequencing. Boxes indicate time points when cells were isolated. (Bottom) Heatmap displaying the karyotypic alterations of single cells isolated from the above competitions. See also Figure S3B. (D-E) (Top) Plot of RPE1 competition in paclitaxel from which cells were isolated for single cell sequencing. Boxes indicate time points when cells were isolated. (Bottom) Heatmap displaying the karyotypic alterations of single cells isolated from various time points of the above competition. N.B. – Competition plots shown in (B), (C), and (E) were previously shown in Figures 1B, S2A, and S2G, respectively.
Figure 4.
Figure 4.. A recurrent aneuploidy recovered in cellular competition experiments is sufficient to confer resistance to paclitaxel.
(A) Micrographs of chromosome paints for chromosomes 10, 13, and 17 in RPE1 clones to confirm monosomies. Scale bar – 10μm. (B) Summary of the chromosome painting experiments. (C) Relative abundance of GFP-expressing RPE1 cells competed against unlabeled monosomies +/− paclitaxel. See also Figure S6.
Figure 5.
Figure 5.. High levels of endogenous CIN are associated with poor drug responses in a set of patient-derived xenografts.
(A) The percent of PDXs that displayed a partial or complete therapeutic response to systemic therapy, sorted according to their degree of CIN. (B) The percent of PDXs that displayed progressive disease in response to systemic therapy, sorted according to their degree of CIN. (C) Box-plots showing the time required for an untreated PDX to double in volume, sorted according to their degree of CIN. Boxes indicate the 25th, 50th, and 75th percentiles, while the bars represent the 10th and 90th percentiles. (D-F) Kaplan-Meier survival analysis of progression-free survival, defined as the time required for a treated PDX to double in volume, for (D) breast cancer PDXs treated with tamoxifen, (E) skin cancer PDXs treated with a BRAF inhibitor, (F) skin cancer PDXs treated with a PI3K inhibitor. (G) The percent of patients from the TCGA who were classified as “not tumor free” at the end of the observation period, sorted according to their degree of FGA. (H) The percent of patients from the TCGA who were classified as exhibiting disease progression following their frontline therapy, sorted according to their degree of FGA. (I) A forest plot showing hazard ratios and 95% confidence intervals for Cox proportional hazards regression between FGA and patient outcome for each of the indicated cancer types. The hazard ratios plotted in red represent those that are significant at a P < .05 threshold. Statistical comparisons in 5A, 5B, 5G, and 5H were performed using Fisher’s exact test. Statistical comparisons in 5C were performed using a two-sided t-test. Statistical comparisons between survival curves in 5D, 5E, and 5F were performed using a log-rank test. *, p < .05; **, p < .005; ***, p < .0005.

Comment in

References

    1. Andrews PA, Iossifov I, Kendall J, Marks S, Muthuswamy L, Wang Z, Levy D, and Wigler M (2016). MUMdex: MUM-based structural variation detection. BioRxiv 078261.
    1. Bakhoum SF, and Cantley LC (2018). The Multifaceted Role of Chromosomal Instability in Cancer and Its Microenvironment. Cell 174, 1347–1360. - PMC - PubMed
    1. Bakhoum SF, Ngo B, Laughney AM, Cavallo J-A, Murphy CJ, Ly P, Shah P, Sriram RK, Watkins TBK, Taunk NK, et al. (2018). Chromosomal instability drives metastasis through a cytosolic DNA response. Nature 553, 467–472. - PMC - PubMed
    1. Baslan T, Kendall J, Rodgers L, Cox H, Riggs M, Stepansky A, Troge J, Ravi K, Esposito D, Lakshmi B, et al. (2012). Genome wide copy number analysis of single cells. Nat Protoc. 7, 1024–1041. - PMC - PubMed
    1. Baudino TA (2015). Targeted Cancer Therapy: The Next Generation of Cancer Treatment. Curr. Drug Discov. Technol 12, 3–20. - PubMed

Publication types