. 2021 Aug 10;36(6):109504.
doi: 10.1016/j.celrep.2021.109504. Epub 2021 Jul 23.

Systemic IL-15, IFN-γ, and IP-10/CXCL10 signature associated with effective immune response to SARS-CoV-2 in BNT162b2 mRNA vaccine recipients

Affiliations

Systemic IL-15, IFN-γ, and IP-10/CXCL10 signature associated with effective immune response to SARS-CoV-2 in BNT162b2 mRNA vaccine recipients

Cristina Bergamaschi et al. Cell Rep. .

Abstract

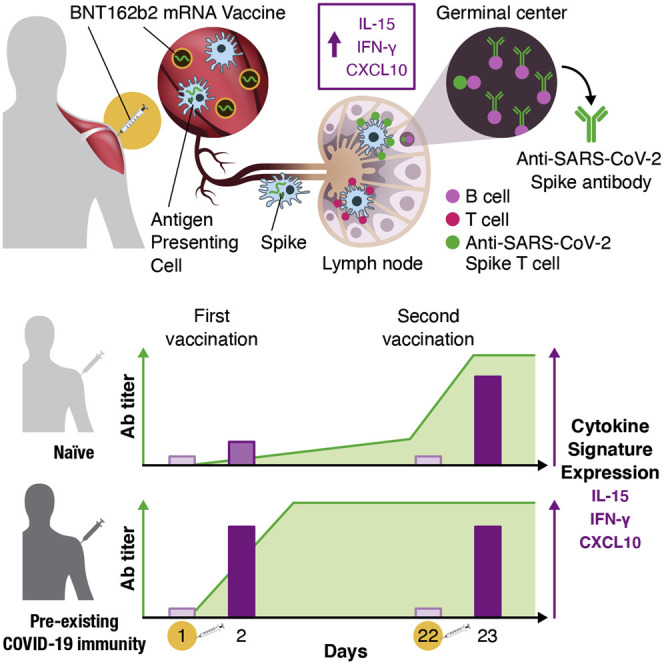
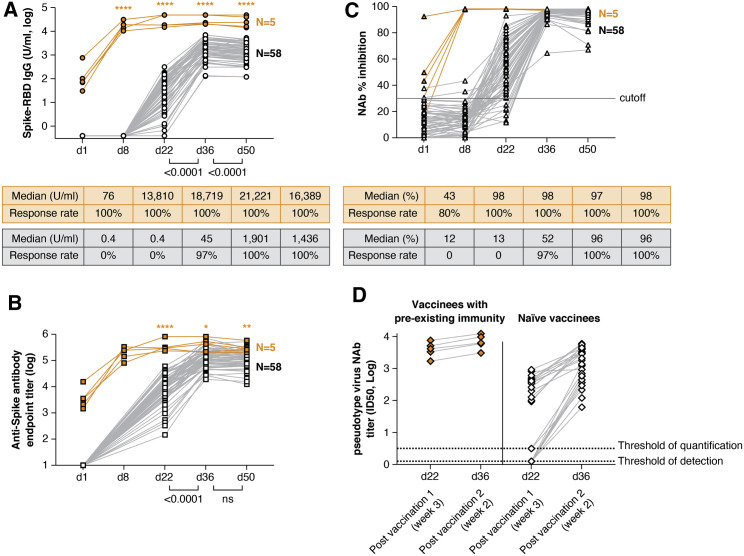
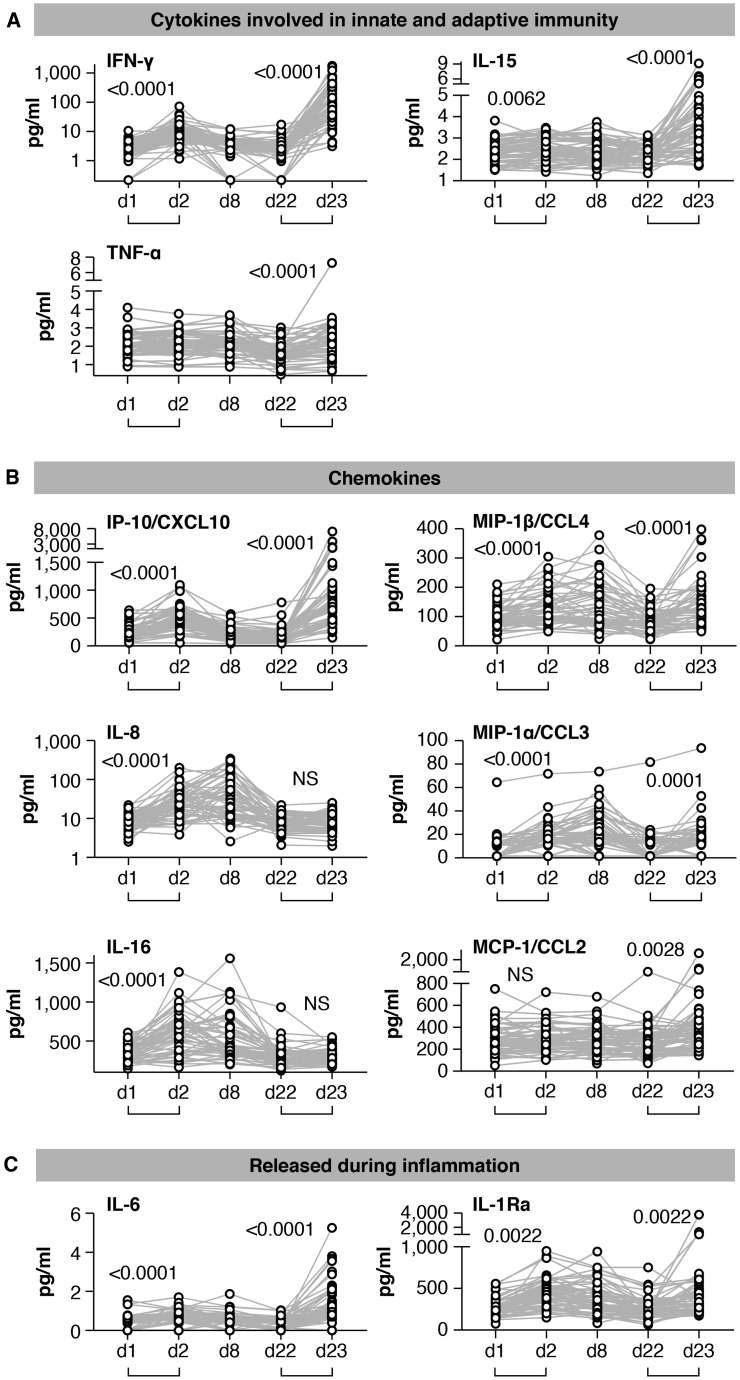
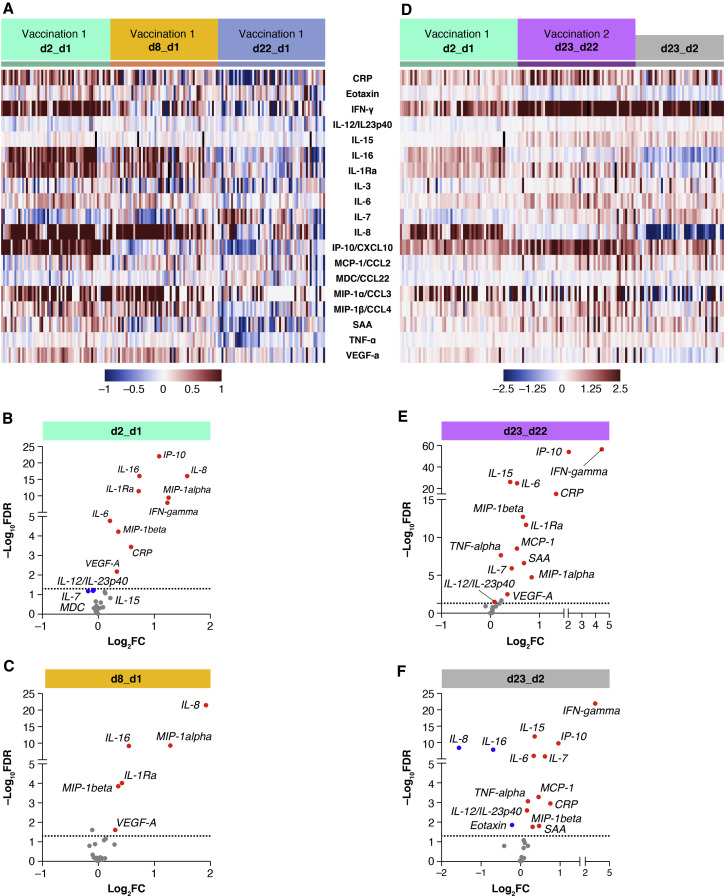
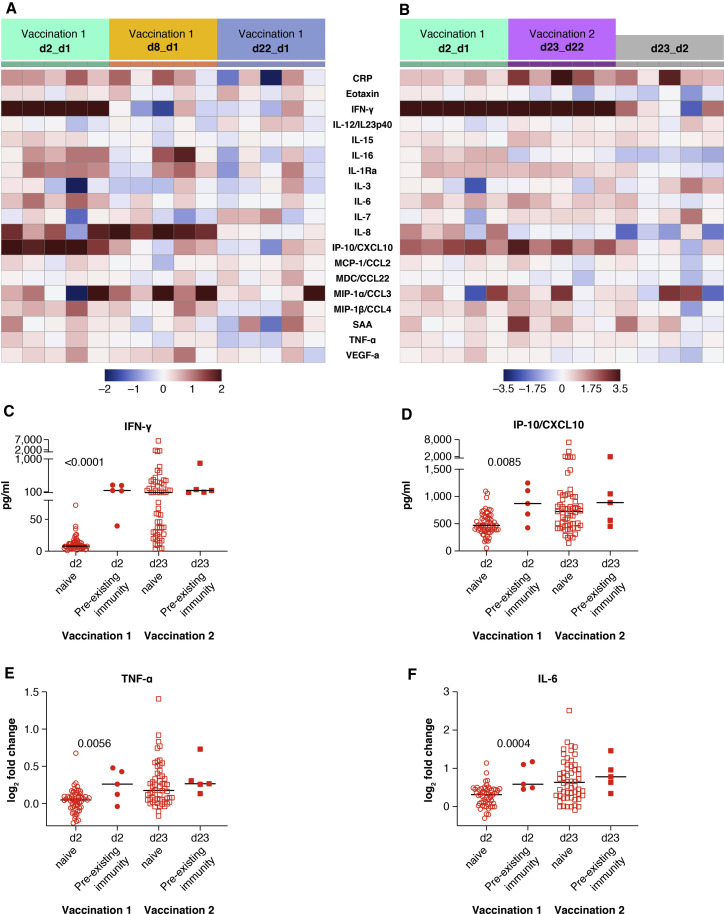
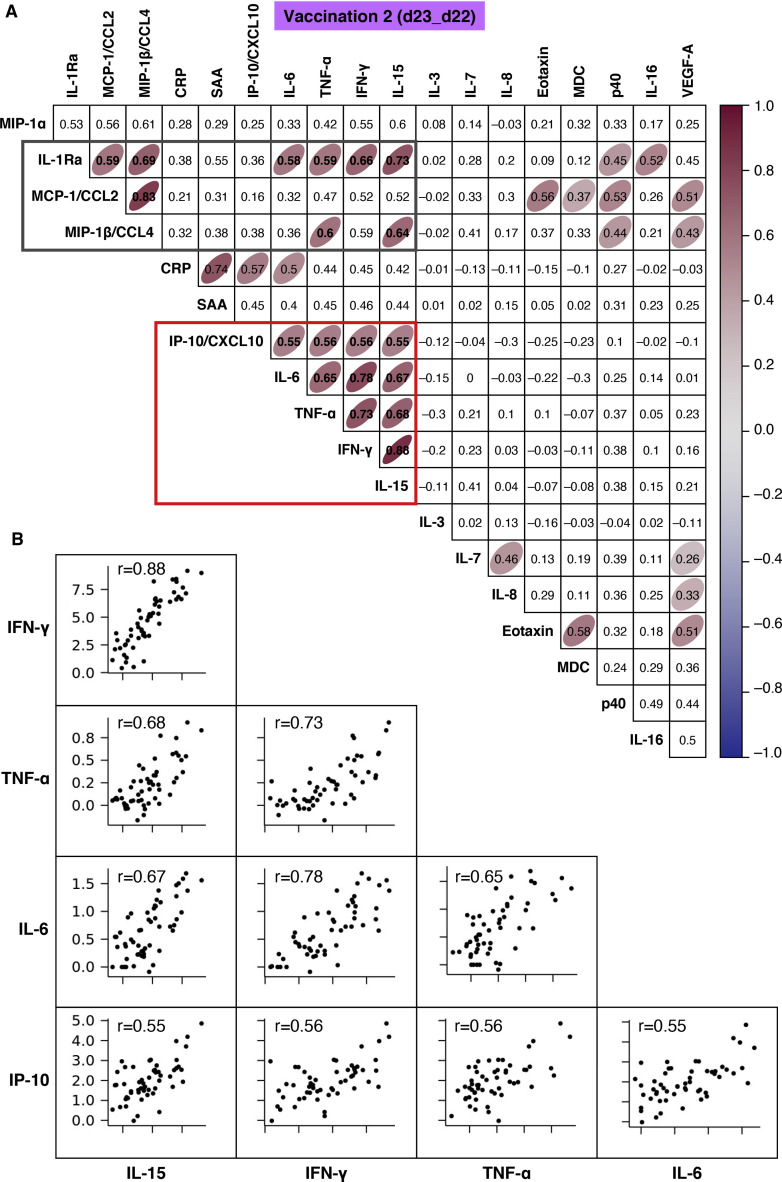
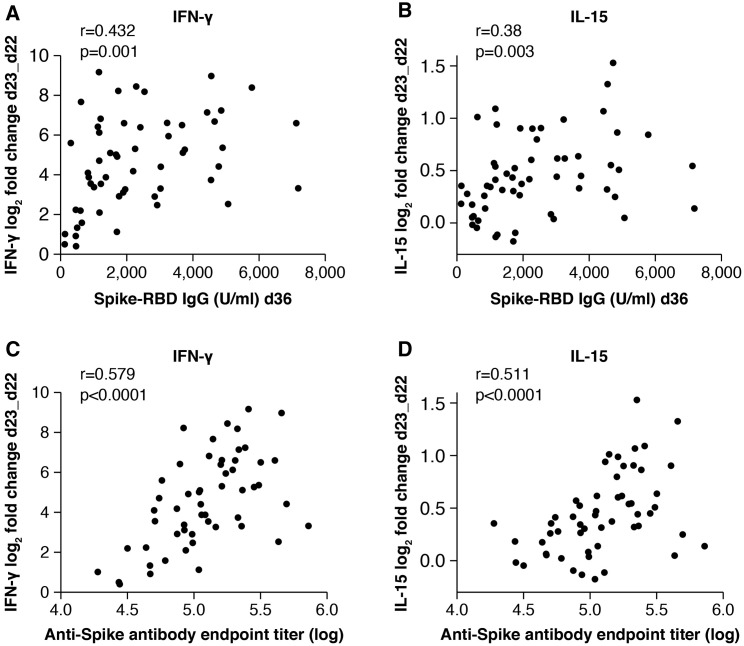
Early responses to vaccination are important for shaping both humoral and cellular protective immunity. Dissecting innate vaccine signatures may predict immunogenicity to help optimize the efficacy of mRNA and other vaccine strategies. Here, we characterize the cytokine and chemokine responses to the 1st and 2nd dose of the BNT162b2 mRNA (Pfizer/BioNtech) vaccine in antigen-naive and in previously coronavirus disease 2019 (COVID-19)-infected individuals (NCT04743388). Transient increases in interleukin-15 (IL-15) and interferon gamma (IFN-γ) levels early after boost correlate with Spike antibody levels, supporting their use as biomarkers of effective humoral immunity development in response to vaccination. We identify a systemic signature including increases in IL-15, IFN-γ, and IP-10/CXCL10 after the 1st vaccination, which were enriched by tumor necrosis factor alpha (TNF-α) and IL-6 after the 2nd vaccination. In previously COVID-19-infected individuals, a single vaccination results in both strong cytokine induction and antibody titers similar to the ones observed upon booster vaccination in antigen-naive individuals, a result with potential implication for future public health recommendations.

Keywords: IFN-γ; IL-15; IP10/CXCL10; SARS-CoV-2; Spike antibody; cytokines; innate immunity; mRNA vaccine.


Conflict of interest statement

Declaration of interests The authors declare no competing interests.

Figures

None
Graphical abstract
Figure 1
Figure 1
Anti-SARS-CoV2 antibody development upon BNT162b2 mRNA vaccination Vaccine recipients were monitored after the 1st vaccination (day 1, day 8, and day 22) and at weeks 2 and 4 after the 2nd vaccination (day 36 and day 50). Responses are shown for recipients with pre-existing immunity due to prior infection (orange symbols) and vaccine recipients naive to SARS-CoV-2 (black symbols). (A and B) Over time, an analysis of binding antibodies recognizing anti-Spike-RBD IgG (ROCHE, U/ml in log) (A) and the full-length trimeric Spike (ELISA, endpoint titer in log) (B) are shown. The Spike-RBD IgG antibody assay (ROCHE) has a range of >0.4 −2,500 U/ml and was run with serial dilutions for some samples reaching >50,000 U/ml. (C and D) Neutralizing antibodies (NAbs) were assessed by a surrogate virus neutralization test (GenScript) (C) and pseudotype NAb assays (D) using HIV-1NLΔEnv-NanoLuc-derived pseudotype virus carrying Wuhan-Hu-1 Spike. Pseudotype neutralization was performed in sera from 5 vaccinees with pre-existing immunity and a subset of samples selected to cover a range of low to high responses (n = 25 naive vaccinees; black symbols) at day 22 and day 36. Sera from vaccinees with pre-existing immunity showed pseudotype NAb titers (50% inhibitory dose, ID50) with a median 3.6 log (range, 3.2–3.9) upon a single vaccination with similar levels after the booster vaccination (median, 3.8 log; range, 3.5–4.1). Naive vaccinees showed NAb ID50 titers ranging from 0.1 to 2.94 log at day 22 and from 1.79 to 3.78 log at day 36. The surrogate virus inhibition assay showed median 96% inhibition levels after the 2nd dose (>90% inhibition by 95% of day 36 sera and by 83% of day 50 sera, respectively). (A and C) Median Spike-RBD antibody and % inhibition and response rate (%) are listed. Orange asterisks indicate significant difference between vaccine recipient with or without prior immunity to SARS-CoV-2 (Mann-Whitney test). See also Figures S1 and S2 and Table S1.
Figure 2
Figure 2
Serum cytokine and chemokine levels after the 1st and 2nd vaccination in COVID-19-naive vaccine recipients Cytokine and chemokine levels were measured over time using the MSD assay after the 1st vaccination (day 1, day 2, day 8, and day 22) and at 1 day after the 2nd vaccination (day 23) in the 58 COVID-19-naive vaccine recipients. (A–C) Serum levels of 11 selected analytes among 19 analytes showing changes upon vaccination are plotted over time. (A) Cytokines involved in both innate and adaptive immunity. (B) Chemokines. (C) Molecules released during inflammation. See also Figure S3 and Tables S2 and S3. p values are from paired t test.
Figure 3
Figure 3
Comparison of serum cytokine and chemokine levels Cytokine and chemokine levels were measured using the MSD assay after the 1st and 2nd vaccination in 58 COVID-19 naive recipients (as described for Figure 2). (A and D) Heatmaps depicted log2 fold changes in 19 analytes upon the 1st vaccination (green: d2_d1; orange: d8_d1; blue: d22_d1) (A) and after both the 1st (green: d2_d1) and 2nd vaccinations (purple: d23_d22) (D). The comparison of the effects induced by the 2nd vaccination over the 1st (d23_d22 over d2_d1) is shown in gray in (D). Different scales are used in (A) and (D) to better visualize the distinct changes upon the 1st and 2nd vaccination. (B, C, E, and F) Volcano plots of data shown in (A) and (D) depict differentially expressed analytes upon the 1st vaccination at day 2 in comparison to day 1 (B) and at day 8 in comparison to day 1 (C) and after the 2nd vaccination at day 23 in comparison to day 22 (E). (F) Differentially affected analytes after the 2nd vaccination in comparison to the 1st vaccination (1 day after each vaccine dose). Red dots indicate significant upregulation; blue dots indicate significant downregulation (FDR < 0.05 represented by the broken horizontal line). See also Figure S4 and Tables S2 and S3.
Figure 4
Figure 4
Serum cytokine and chemokine levels after the 1st and 2nd vaccination in COVID-19 vaccine recipients with pre-existing immunity Cytokine and chemokine levels were measured using the MSD assay after the 1st and 2nd vaccination in 5 recipients with pre-existing immunity (as described for Figure 2). (A and B) Heatmaps representing the 19 analytes that showed significant changes upon the 1st (A) and the 1st and 2nd vaccinations (B), and comparison of both vaccinations are shown. Different scales are used in (A) and (B) to better visualize the distinct changes upon the 1st and 2nd vaccination. (C–F) Comparison of changes between the 58 COVID-19-naive individuals and the 5 individuals with prior COVID-19 infection in serum levels (pg/ml) of IFN-γ (C) and IP-10/CXCL10 (D) and in log2 fold changes for TNF-α (E) and IL-6 (F). p values are from unpaired non-parametric t test (Mann-Whitney). See also Tables S2 and S3.
Figure 5
Figure 5
Correlation of chemokine and cytokine changes Pairwise correlations were calculated among the log2 fold changes at day 23 (after the 2nd vaccination) for the 19 biomarkers that were affected by the vaccination by using the Spearman correlation coefficient (adjusted p < 0.05). The analysis was performed for the 58 COVID-19-naive vaccine recipients. (A) Correlation matrix for the 2nd vaccination is plotted as a heatmap. Spearman r values of correlations are indicated in the grid cells, and ellipses identified significant correlations. The color and shape of ellipses correspond to the value of the Spearman correlation coefficient, with red color indicating a positive correlation. The red box identifies the cluster of positive associations featuring IFN-γ, IL-15, TNF-α, IL-6, and IP-10/CXCL10. The gray box data are described in Figure S6. (B) Correlation plots for the selected analytes from (A) (red box). Each dot represents a single vaccine recipient response. r is shown in plots; all correlations are characterized by an adjusted p < 0.05. See also Figure S5 and Tables S2 and S3.
Figure 6
Figure 6
Biomarkers of effective vaccination Correlations of log2 fold changes after the 2nd vaccination (d23_d22) of IFN-γ (A and C) and IL-15 (B and D) and levels of antibodies against Spike-RBD (U/ml) (A and B) and trimeric Spike (ELISA, endpoint titer) (C and D). The analysis was performed at 2 weeks after the 2nd vaccination (day 36). Spearman r and p values are given (GraphPad Prism). See also Table S4.

References

    1. Andersen-Nissen E., Fiore-Gartland A., Ballweber Fleming L., Carpp L.N., Naidoo A.F., Harper M.S., Voillet V., Grunenberg N., Laher F., Innes C., et al. Innate immune signatures to a partially-efficacious HIV vaccine predict correlates of HIV-1 infection risk. PLoS Pathog. 2021;17:e1009363. - PMC - PubMed
    1. Arunachalam P.S., Wimmers F., Mok C.K.P., Perera R.A.P.M., Scott M., Hagan T., Sigal N., Feng Y., Bristow L., Tak-Yin Tsang O., et al. Systems biological assessment of immunity to mild versus severe COVID-19 infection in humans. Science. 2020;369:1210–1220. - PMC - PubMed
    1. Baden L.R., El Sahly H.M., Essink B., Kotloff K., Frey S., Novak R., Diemert D., Spector S.A., Rouphael N., Creech C.B., et al. COVE Study Group Efficacy and Safety of the mRNA-1273 SARS-CoV-2 Vaccine. N. Engl. J. Med. 2021;384:403–416. - PMC - PubMed
    1. Barrett J.R., Belij-Rammerstorfer S., Dold C., Ewer K.J., Folegatti P.M., Gilbride C., Halkerston R., Hill J., Jenkin D., Stockdale L., et al. Oxford COVID Vaccine Trial Group Phase 1/2 trial of SARS-CoV-2 vaccine ChAdOx1 nCoV-19 with a booster dose induces multifunctional antibody responses. Nat. Med. 2021;27:279–288. - PubMed
    1. Bastard P., Rosen L.B., Zhang Q., Michailidis E., Hoffmann H.H., Zhang Y., Dorgham K., Philippot Q., Rosain J., Béziat V., et al. HGID Lab. NIAID-USUHS Immune Response to COVID Group. COVID Clinicians. COVID-STORM Clinicians. Imagine COVID Group. French COVID Cohort Study Group. Milieu Intérieur Consortium. CoV-Contact Cohort. Amsterdam UMC Covid-19 Biobank. COVID Human Genetic Effort Autoantibodies against type I IFNs in patients with life-threatening COVID-19. Science. 2020;370:eabd4585. - PMC - PubMed

Publication types