. 2021 Sep 2;184(18):4612-4625.e14.
doi: 10.1016/j.cell.2021.07.013. Epub 2021 Aug 4.

The genomic history of the Middle East

Affiliations

The genomic history of the Middle East

Mohamed A Almarri et al. Cell. .

Abstract

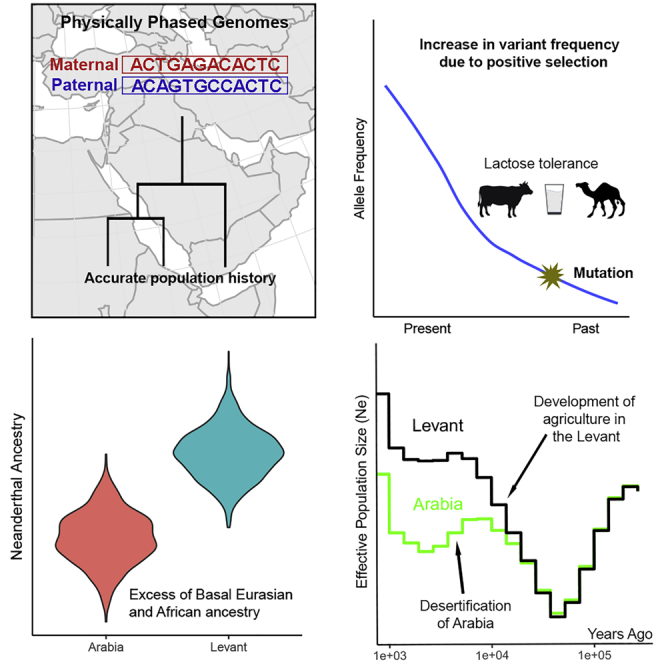
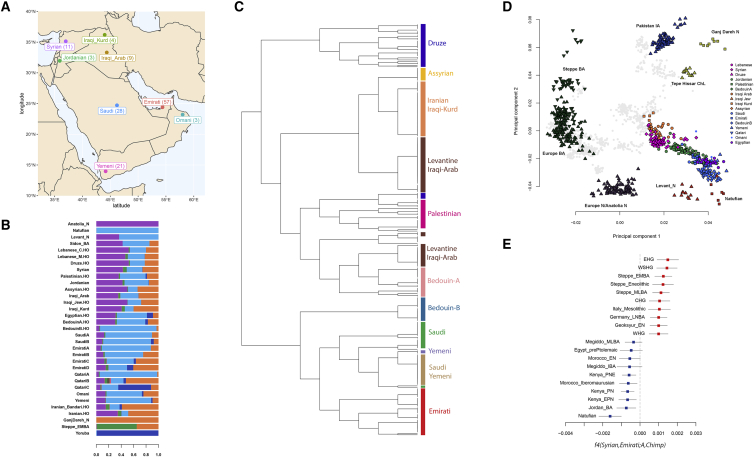
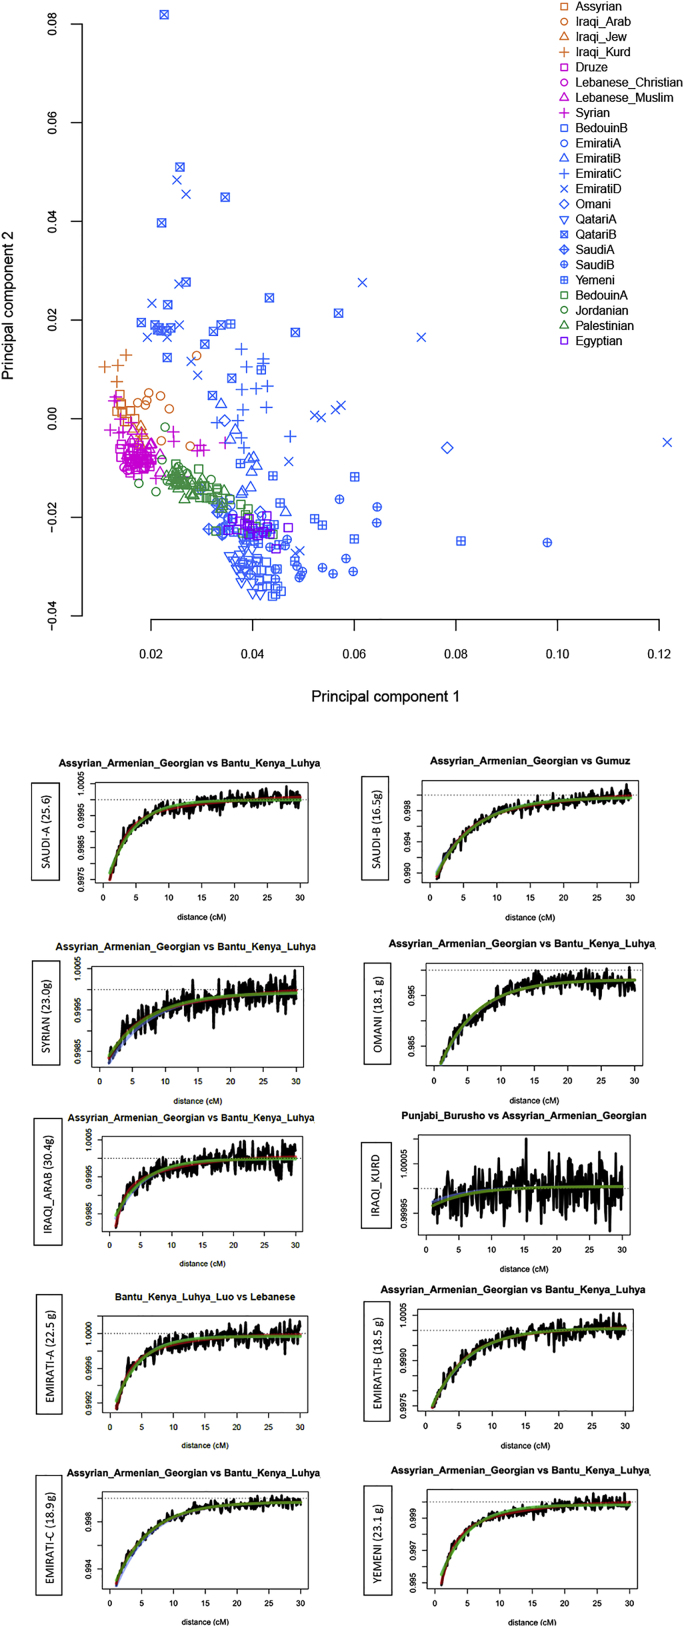
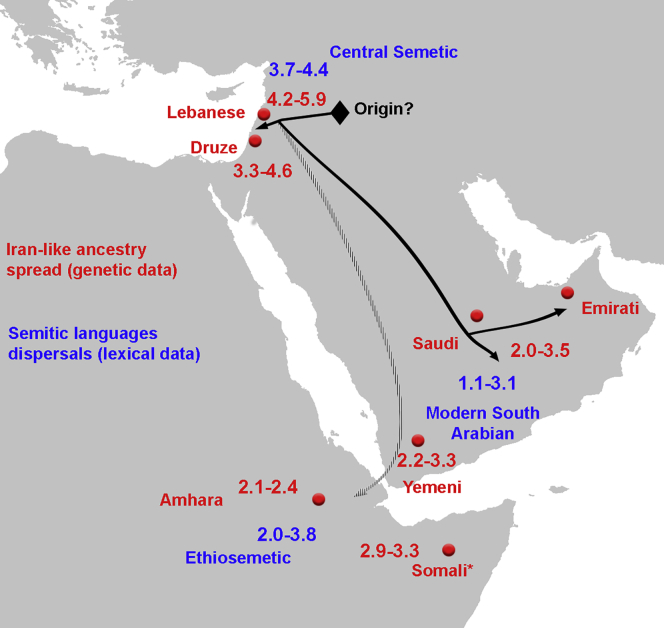
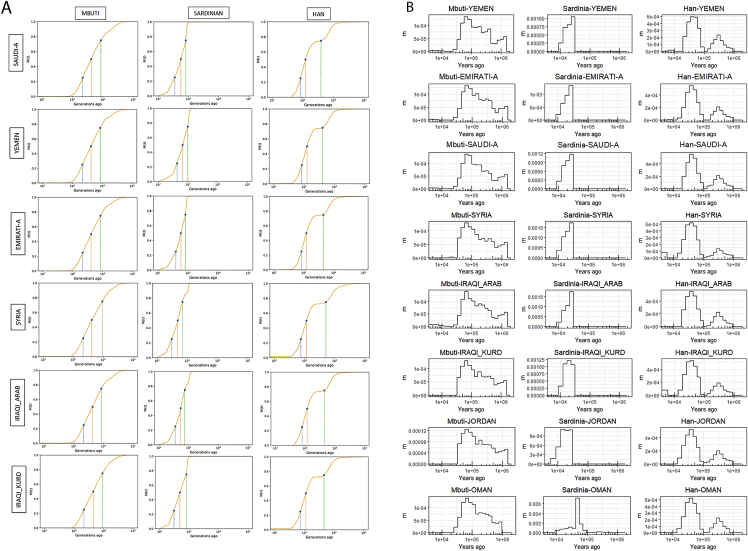
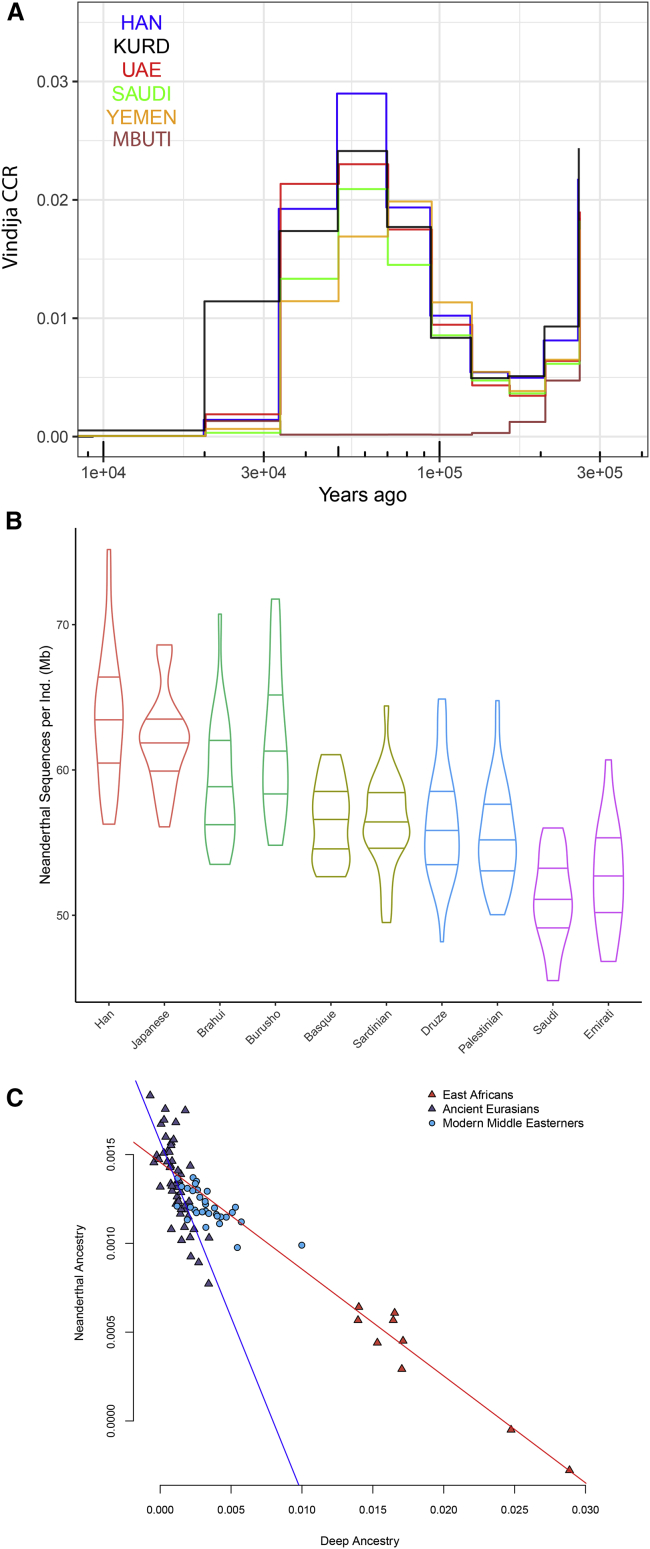
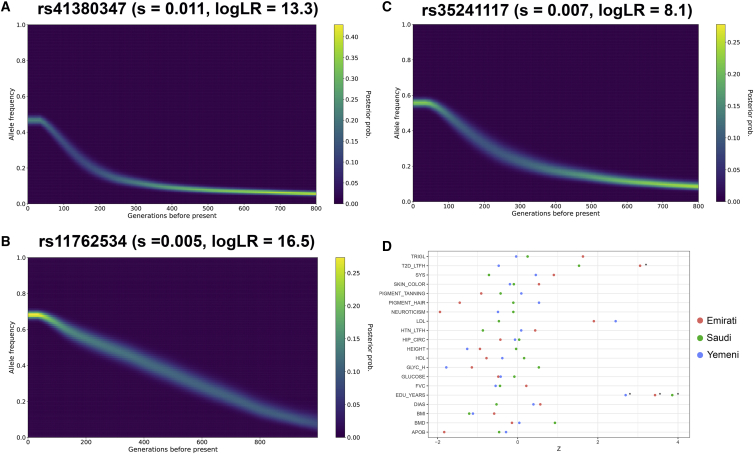
The Middle East region is important to understand human evolution and migrations but is underrepresented in genomic studies. Here, we generated 137 high-coverage physically phased genome sequences from eight Middle Eastern populations using linked-read sequencing. We found no genetic traces of early expansions out-of-Africa in present-day populations but found Arabians have elevated Basal Eurasian ancestry that dilutes their Neanderthal ancestry. Population sizes within the region started diverging 15-20 kya, when Levantines expanded while Arabians maintained smaller populations that derived ancestry from local hunter-gatherers. Arabians suffered a population bottleneck around the aridification of Arabia 6 kya, while Levantines had a distinct bottleneck overlapping the 4.2 kya aridification event. We found an association between movement and admixture of populations in the region and the spread of Semitic languages. Finally, we identify variants that show evidence of selection, including polygenic selection. Our results provide detailed insights into the genomic and selective histories of the Middle East.

Keywords: Arabia; Aridification; Basal Eurasian; Climate change; Levant; Migration; Neanderthal; Near East; Population genetics; Selection.


Conflict of interest statement

Declaration of interests The authors declare no competing interests.

Figures

None
Graphical abstract
Figure 1
Figure 1
Overview of the dataset and population structure of the Middle East (A) Map illustrating the populations sampled in this study, with number of individuals shown in brackets. We use the term “Arabian” in this study to refer to samples from the Arabian Peninsula (Emirati, Saudi, and Yemeni), Levantine for Syrians and Jordanians, and Iraqi-Arabs and Iraqi-Kurds for samples from Iraq. (B) Temporally aware model-based clustering using ~88,000 transversions and 9 time points, showing K = 8 when the Anatolia_N and Natufian components split. “.HO” suffix refers to samples from the Human Origins Dataset. (C) fineSTRUCTURE tree of modern-day Middle Easterners with population clusters highlighted. (D) Principal component analysis of ancient and modern populations. Eigenvectors were inferred with present-day populations from the Middle East, Europe, and Central and South Asia. The ancient samples were then projected onto the plot (all modern non-Middle Easterners shown as gray points). See Figure S1 for more details. (E) Genetic contrast between the Levant and Arabia illustrated using the statistic f4(Syrian,EmiratiA;Ancient,Chimpanzee) and ± 3 standard errors with the 10 lowest (blue) and 10 highest (red) f4-stats.
Figure S1
Figure S1
Population structure and admixture, related to Figure 1 Top: Principal component analysis. Plot similar to Figure 1D but magnifying the modern Middle Eastern cluster and also including other subpopulations (e.g., EmiratiB and QatariB). Bottom: Testing for recent admixture using modern population as sources with GLOBETROTTER. Co-ancestry curves showing relative probability of jointly copying two chunks from donors at varying genetic distances. The curves fit an exponential decay (1-date green line, 2-date red line). The positive slope implies that these donors represent potential proxies to the admixing sources. The estimated admixture date is illustrated on the left of each figure, g for generations. We find that the two putative sources are always a Middle Eastern and an East African population. The dates are in general agreement with MALDER (Table S1). The Iraqi_Kurds are notable for not showing evidence of recent admixture.
Figure 2
Figure 2
Spread of Iran-like ancestry and Semitic languages Map shows admixture dates in thousands of years ago (red) based on Table S2 and Semitic languages dispersals estimated by Kitchen et al. (2009) from lexical data (blue). Kitchen et al. (2009) estimate an Early Bronze Age origin for Semitic languages ~5.7 KYA in the Levant. Admixture also appears in non-Semitic speaking groups such as the Somalis, a Cushitic-speaking population. Kitchen et al. (2009) suggested that Semitic languages would have spread into East Africa with little gene flow, as Ethiosemitic-speaking populations share similar proportions of non-African ancestry and are genetically similar to Cushitic-speaking populations, confirmed by more recent analysis (Pagani et al., 2015). They proposed that the current distribution of Ethiosemitic languages reflect a language diffusion process through African populations, rather than gene flow. Our admixture tests Tables S3 and S4 also suggest an ancient Egyptian source of ancestry in East Africa, rather than from Arabia, although ancient DNA from Arabia is still missing to make a comparable analysis. See also Figure S2.
Figure S2
Figure S2
Y chromosome phylogeny, related to Figure 2 We merged our dataset (samples in Blue) with Haber et al., 2019 (samples in Red) and Hallast et al., 2020 (Samples in Green). We display common haplogroups found in our dataset (A) J1, (B) E1b1 and (C) L-T. Numbers at each node represent coalescence date in thousand years with 95% confidence intervals in brackets.
Figure 3
Figure 3
A possible model for the population formation in the Middle East Populations in ellipses are sampled populations, while populations in boxes are hypothetical. Worst f-statistics: Z score = −2.9. We explore models further in Figure S3. BA, Bronze Age; HG, hunter-gatherer.
Figure S3
Figure S3
qpGraph alternative models for population formation in the Middle East and automatically fitting admixture graphs, related to Figure 3 Graphs (A) and (B) show alternative scenarios for populating the Middle East. Changes from the best model (Figure 3) involve (A) Arabians derive their ancestry from a population related to ancient Iranians and local hunter-gatherers. (B) Ancestry in Arabia from a Levant_N-related rather than Natufian-related population. (C) We show a semi-automatically fitted graph. We started with a base-graph of the ancient populations based on previous knowledge (Lazaridis et al., 2016; Haber et al., 2017); this graph has an outlier Z-score = 2.06. We then used qpBrute (Ní Leathlobhair et al., 2018; Liu et al., 2019) to fit the EmiratiA and we obtained a graph with no outliers showing EmiratiA descended from a mixture of Natufian-related and Sidon_BA-related ancestries. We then used this new graph as a base and added the modern Lebanese. We found that the graph with the lowest Z-score shown here was identical to our Figure 3.
Figure 4
Figure 4
Population size and separation history (A) Effective population size histories for Middle Eastern populations. More details in Figure S4. (B) Separation history between Mbuti, Sardinians, and Han (indicated at the top of each panel) with each of the Middle Eastern populations (identified within each panel). All Middle Eastern populations show similar split time with each of these global populations. More details in Figure S5. (C) Separation history within the Middle East (population indicated at the top of each panel, and within each panel). More comparisons shown in Figure S4. Note the different x axis scales. See also Figure S5.
Figure S4
Figure S4
Effective population size and separation history estimates, related to Figure 4 A) Replicating the divergence in population size between the Levant and Arabia using MSMC2. (B) Effective population sizes for Emirati and Saudi subpopulations using Relate. (C): Testing the effect of consanguinity on Emirati-A, Saudi-A and Yemeni population size estimates using Relate. sROH calculated using a minimum ROH block of 1Mb. Including samples with likely recent consanguinity affects populations size estimates at recent times. Using a single haplotype per sample reduces this effect. The second bottleneck is apparent in all tests. (D and E) Separation history within the Middle East for additional populations. Population indicated at the top of each panel, and within each panel.
Figure S5
Figure S5
Migration rates inferred using MSMC-IM, related to Figure 4 A) Cumulative migration probability, M(t), of Middle Eastern samples compared to Mbuti, Sardinians and Han. Shaded lines illustrate when the M(t) reaches, 25%, 50% and 75%. (B) Migration rates, m, for the same populations. Note the gradual separation from Mbuti, more of a clean split from Sardinians and the second, older, peak found in the Han comparisons which are consistent with archaic hominin lineages.
Figure 5
Figure 5
Archaic introgression and deep structure in the Middle East (A) Relative cross coalescent rate (CCR) against Vindija Neanderthal. Note the y axis range. (B) Distribution of total length of Neanderthal sequences (Mb) per sample in each population. Horizontal lines depict 25%, 50%, and 75% quantiles. Colors reflect regional grouping. (C) Neanderthal ancestry f4(Vindija,Chimp;X,Mbuti) is negatively correlated with a deep ancestry f4(Kostenki14,X;Ust'-Ishim,Chimp) in the Middle East. Two clines explain the depletion of Neanderthal Ancestry in Middle Easterners; one formed by Basal Eurasian ancestry and the other is African ancestry. We plot regression lines using East Africans (red) and the ancient Eurasians (blue). We generated standard errors for the slopes using a jackknife by dropping one chromosome. Ancient Eurasian slope m = −0.21 ± 0.002, East African slope m = −0.06 ± 0.0008. Both slopes are always negative. See also Figure S6.
Figure S6
Figure S6
Neanderthal introgressed segments common in Arabia but rare globally identified using Sprime, related to Figures 5A and 5B Top: 496kb segment on chromosome 13 present at ~20% frequency in Saudi populations but rare globally (Global 1000G Project = 0.02%) and overlapping GPC5, a gene expressed in brain tissues. Bottom: 499kb segment on chromosome 4 that reaches ~20% frequency in EmiratiA and overlaps CFAP299 expressed in the testes with a role in spermatogenesis, and BMP3, a cytokine which induces cartilage and bone development (Global 1000G Project < 0.05%). We searched for functional variants within these haplotypes but did not find any amino acid changes within canonical transcripts, with most substitutions limited to introns. Figures downloaded from Ensembl.
Figure 6
Figure 6
Selection in Arabia (A) Historical allele trajectory of rs41380347, which is associated with lactase persistence and almost private to the Middle East. s, selection coefficient. (B) Frequency trajectory of rs11762534, which is associated with lymphocyte and neutrophil percentages and prostate neoplasm malignancy. (C) Frequency trajectory of rs35241117, which is present at the highest frequency in Arabia globally and is associated with multiple traits including glomerular filtration rate, bone mineral density, BMI, standing height, and hypertension. (D) Testing for recent polygenic selection, over the past 2,000 years, on 20 traits within Arabian populations. Asterisks indicate the test is significant after correcting for multiple testing (FDR = 5%). TRIGL, triglycerides; T2D, type 2 diabetes; SYS, systemic blood pressure; LDL, low-density lipoproteins; HTN, hypertension; HIP_CIRC, hip circumference; HDL, high-density lipoproteins; GLYC_H, glycosylated haemoglobin; FVC, forced vital capacity; EDU_YEARS, years of education; DIAS, diastolic blood pressure; BMI, body mass index; BMD, bone mass density; APOB, Apoliprotein B. See also Figure S7.
Figure S7
Figure S7
Population Branch Statistics comparing each Arabian (EmiratiA, SaudiA, Yemeni) population with Iraqi_Arabs and using Syrians as an outgroup, related to Figure 6 Variants showing extreme branch statistics highlighted. Red line illustrates the top 99.999% quantile. Note the different y axis scales. rs2814778 is the variant discussed in the main text found at high frequencies in Yemenis that results in the Duffy null genotype. rs35040 shows strong differentiation in Emiratis and is an eQTL for DDX11 in multiple tissues. For both Emiratis and Saudis, we find a strong signal of differentiation at a 97kb haplotype on chromosome 7. Variants on this haplotype (rs1734235) almost reach fixation (97% and 85%, in Emiratis and Saudis respectively) and are associated with increased expression of the lincRNA AC003088.1 in cultured fibroblasts (GTEx Analysis Release V8; The GTEx Consortium, 2020).

References

    1. Abou Tayoun A.N., Rehm H.L. Genetic variation in the Middle East-an opportunity to advance the human genetics field. Genome Med. 2020;12:116. - PMC - PubMed
    1. Agranat-Tamir L., Waldman S., Martin M.A.S., Gokhman D., Mishol N., Eshel T., Cheronet O., Rohland N., Mallick S., Adamski N. The Genomic History of the Bronze Age Southern Levant. Cell. 2020;181:1146–1157.e11. - PMC - PubMed
    1. Allentoft M.E., Sikora M., Sjögren K.G., Rasmussen S., Rasmussen M., Stenderup J., Damgaard P.B., Schroeder H., Ahlström T., Vinner L. Population genomics of Bronze Age Eurasia. Nature. 2015;522:167–172. - PubMed
    1. Antonio M.L., Gao Z., Moots H.M., Lucci M., Candilio F., Sawyer S., Oberreiter V., Calderon D., Devitofranceschi K., Aikens R.C. Ancient Rome: A genetic crossroads of Europe and the Mediterranean. Science. 2019;366:708–714. - PMC - PubMed
    1. Armitage S.J., Jasim S.A., Marks A.E., Parker A.G., Usik V.I., Uerpmann H.P. The southern route “out of Africa”: evidence for an early expansion of modern humans into Arabia. Science. 2011;331:453–456. - PubMed

Publication types

LinkOut - more resources