. 2021 Nov 1;1863(11):183723.
doi: 10.1016/j.bbamem.2021.183723. Epub 2021 Aug 2.

Interactions of HIV gp41's membrane-proximal external region and transmembrane domain with phospholipid membranes from 31P NMR

Affiliations

Interactions of HIV gp41's membrane-proximal external region and transmembrane domain with phospholipid membranes from 31P NMR

Madeleine Sutherland et al. Biochim Biophys Acta Biomembr. .

Abstract

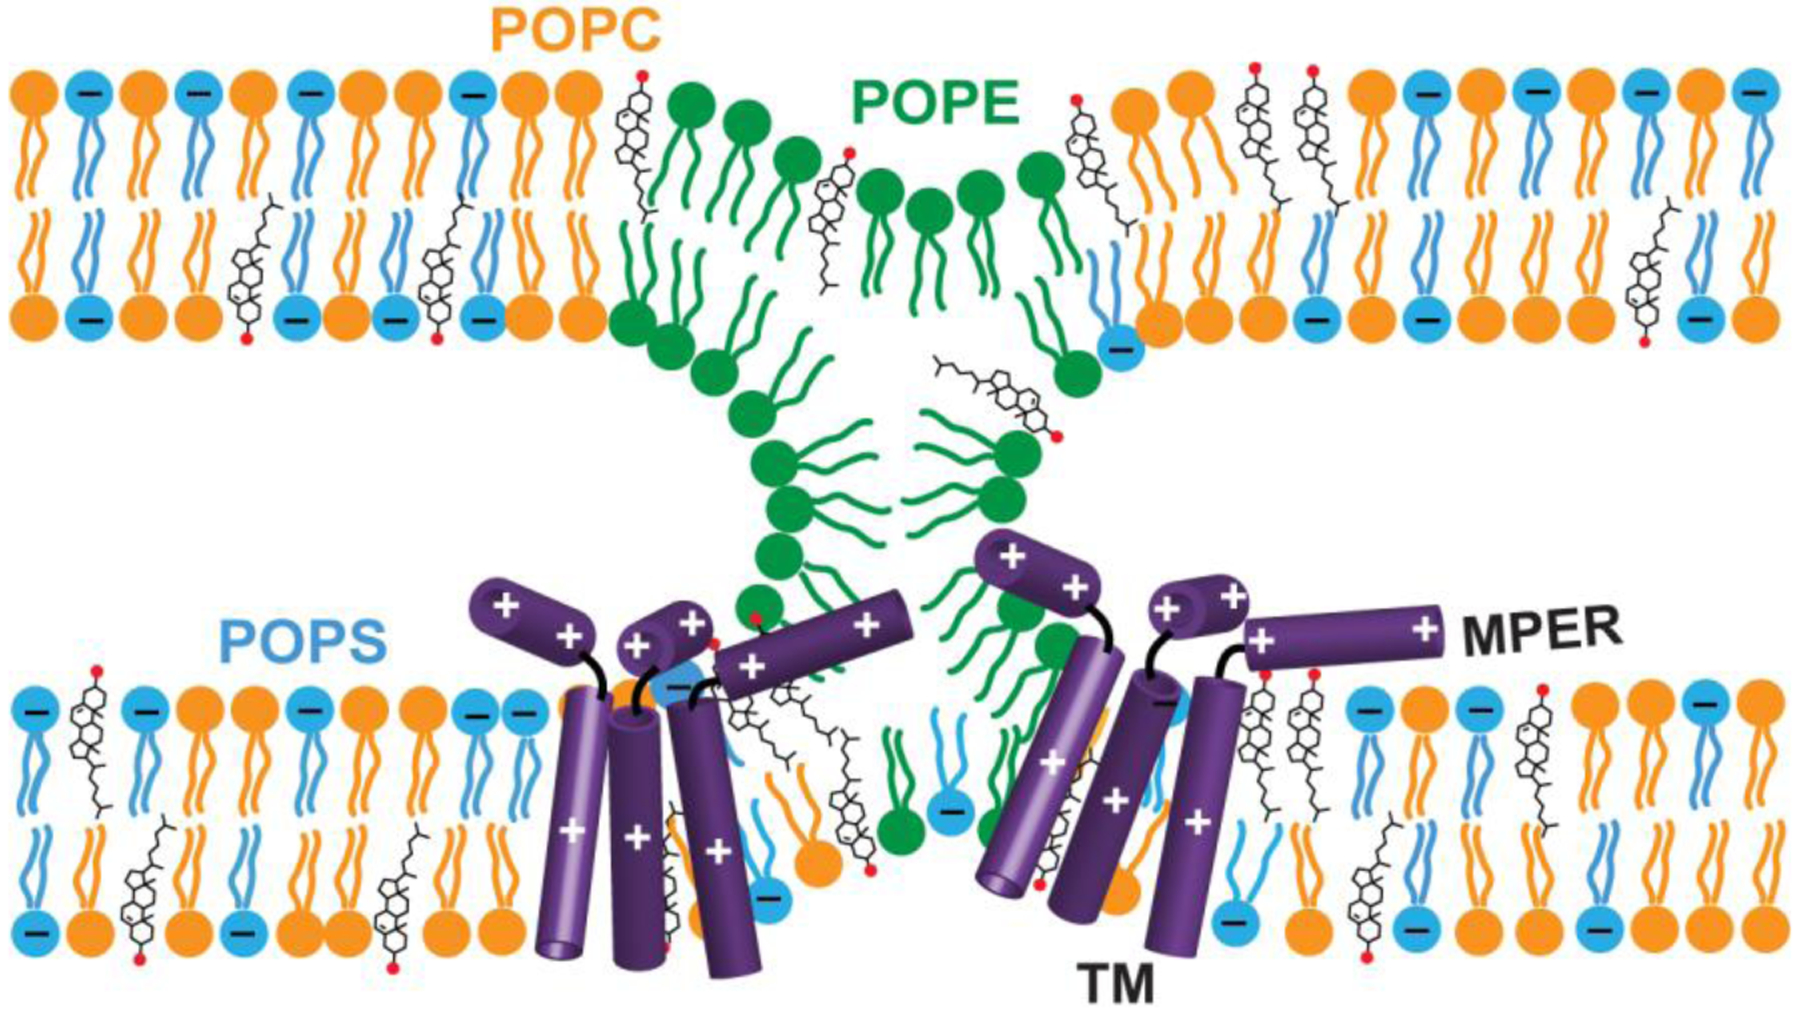
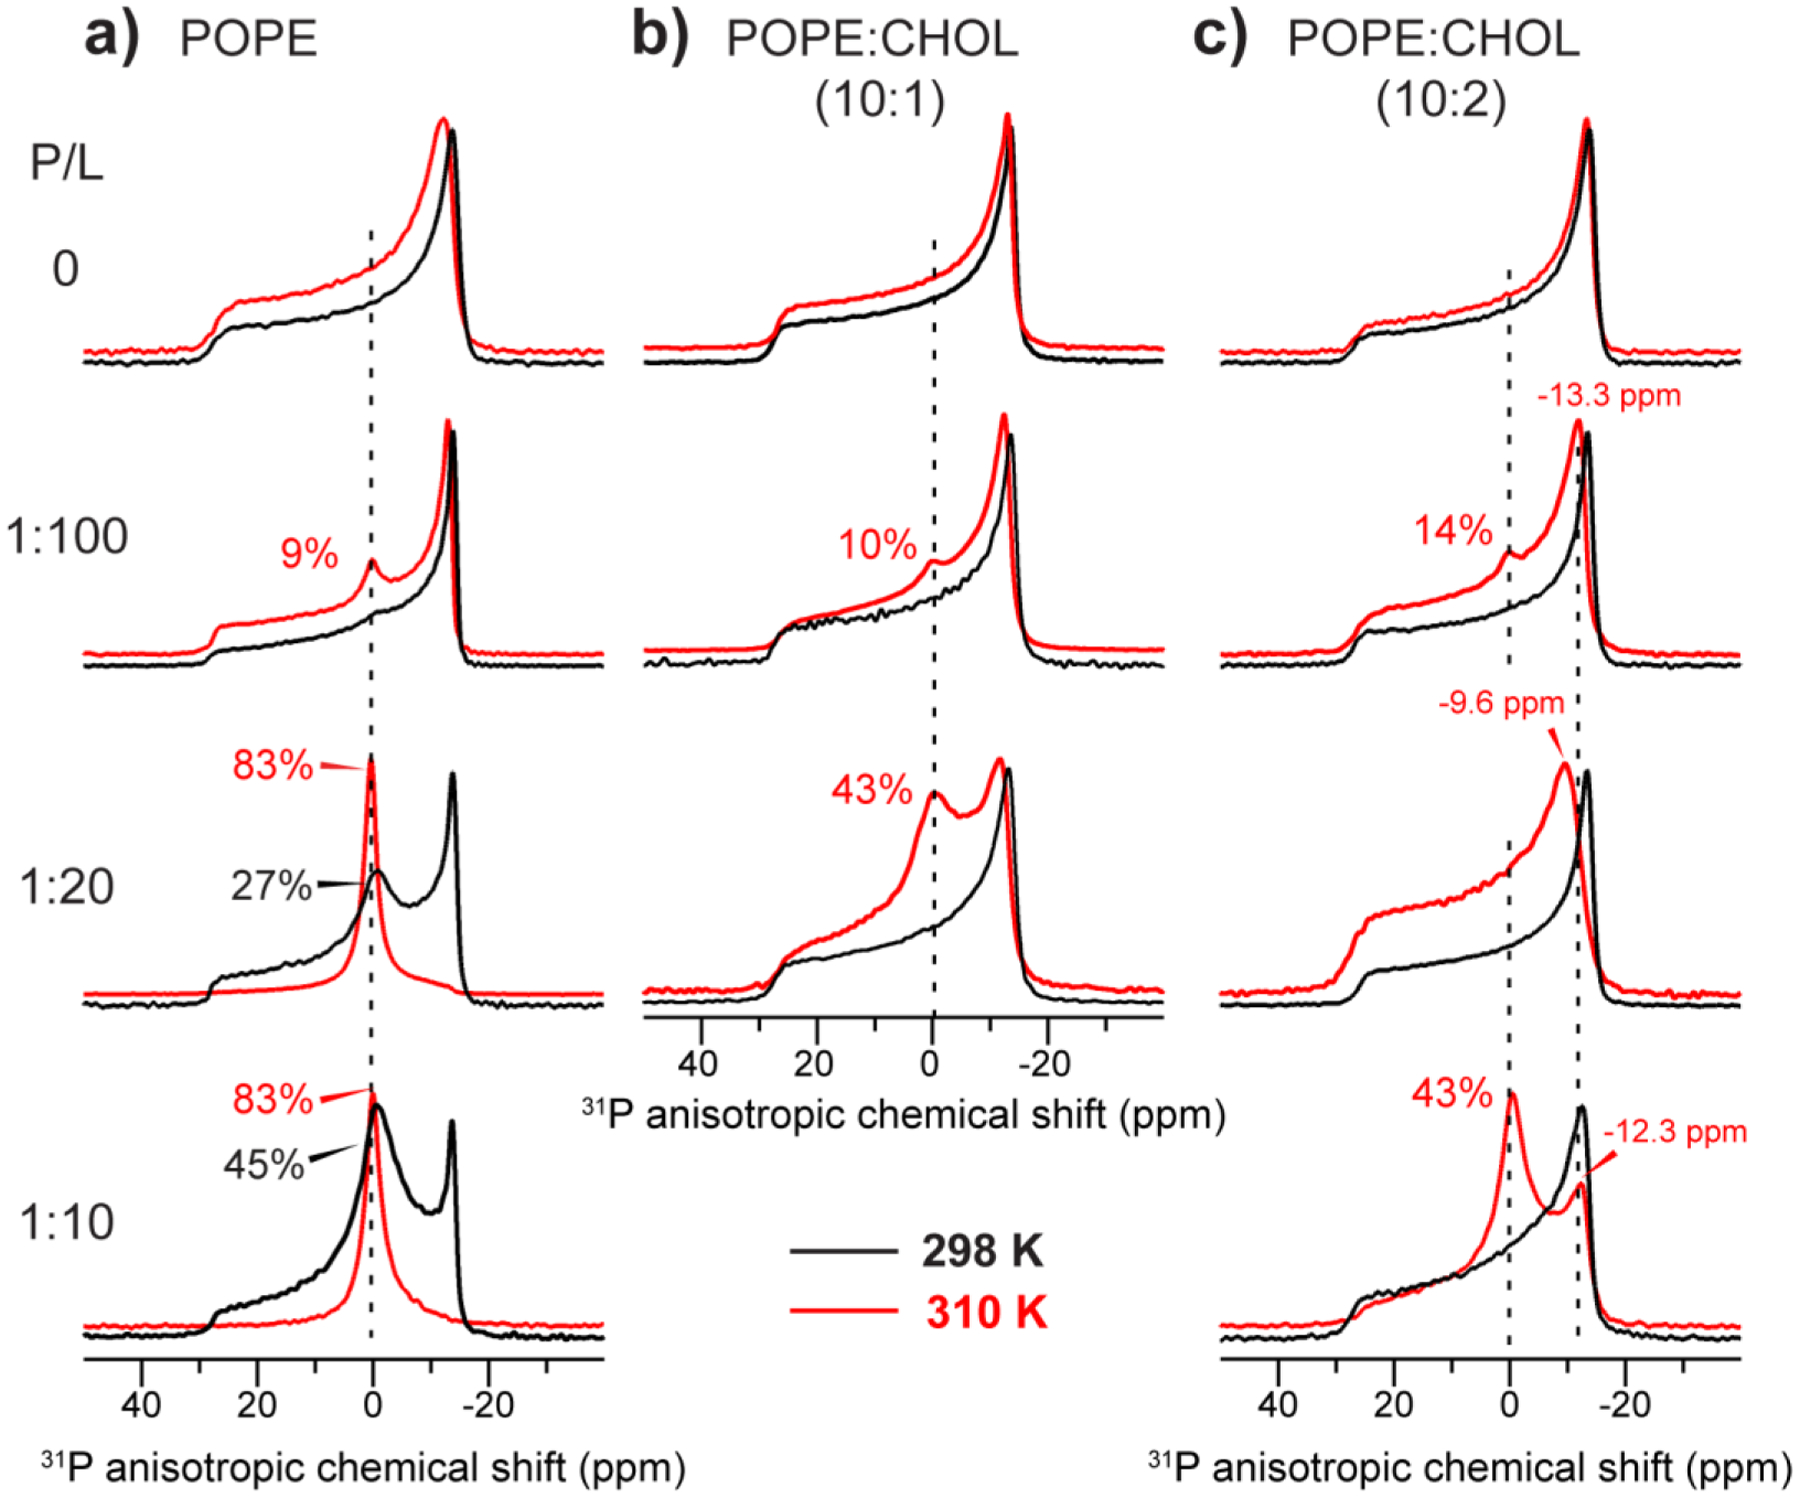
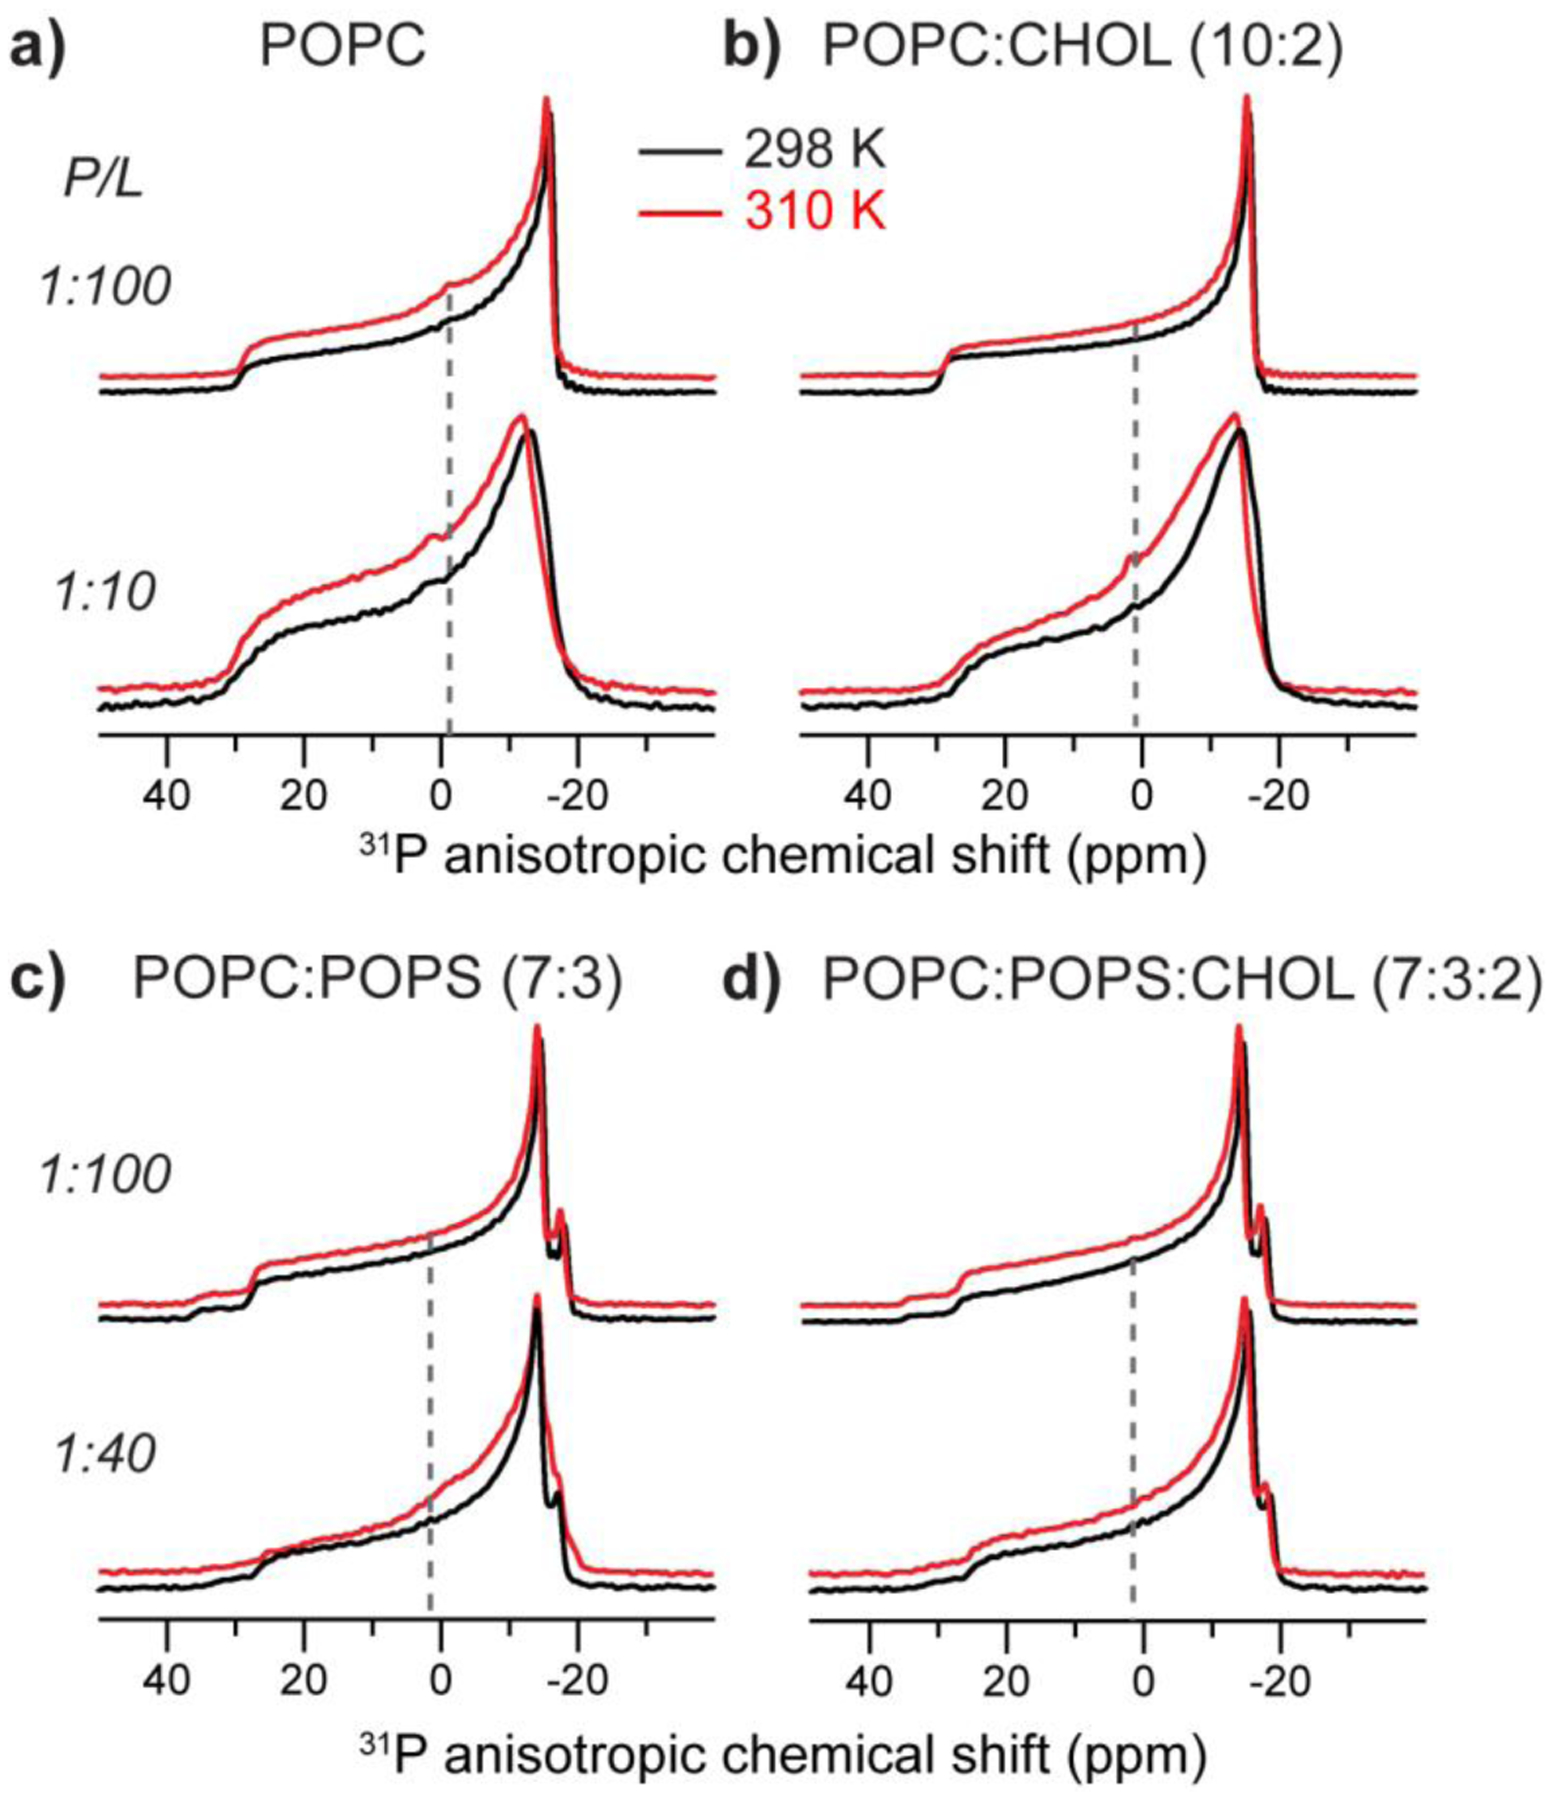
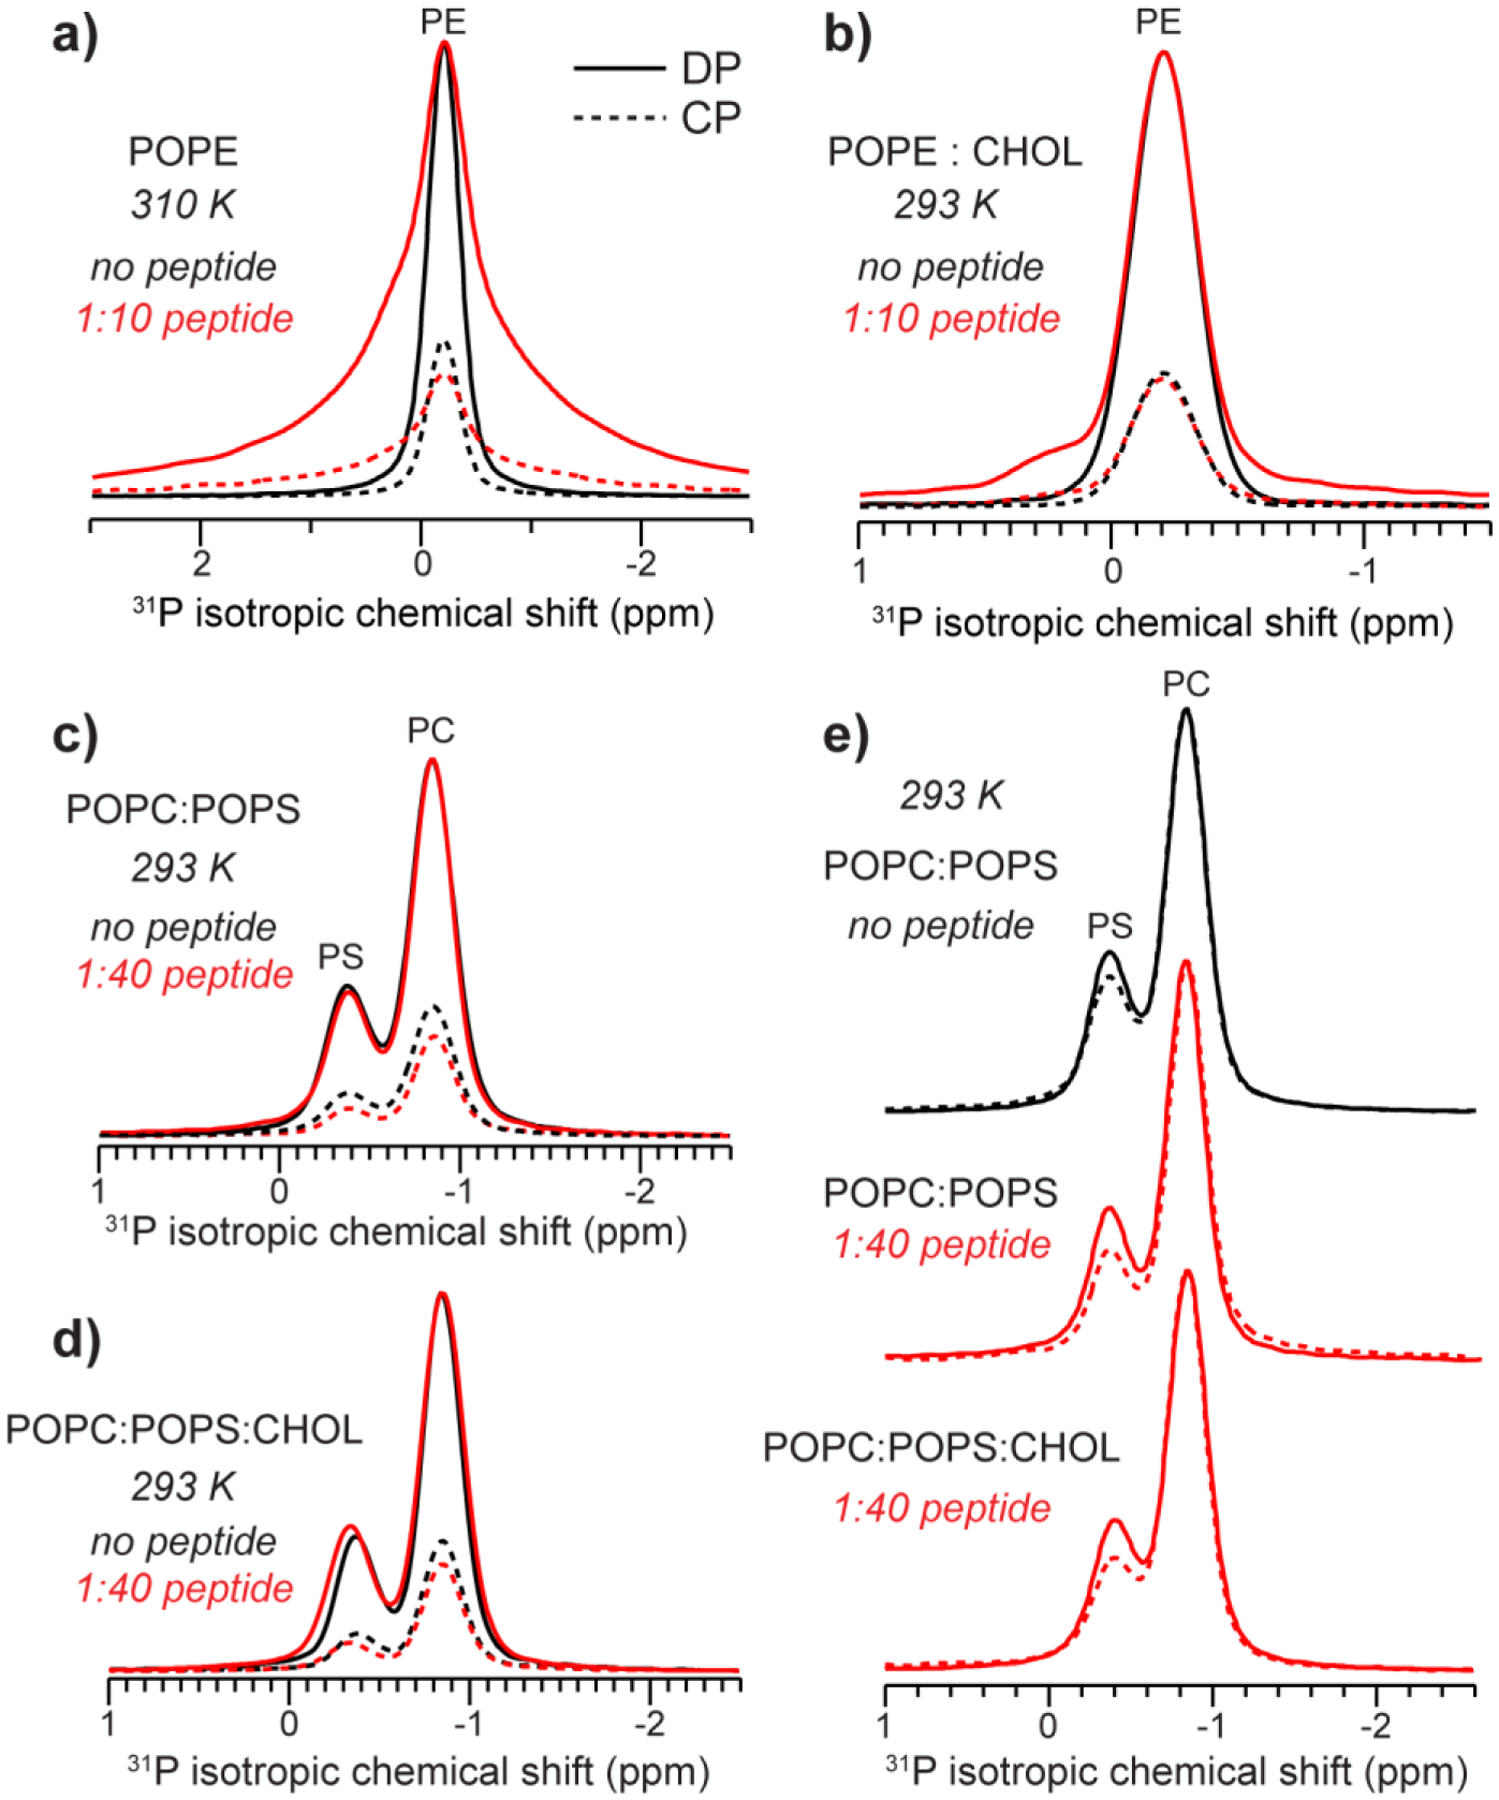
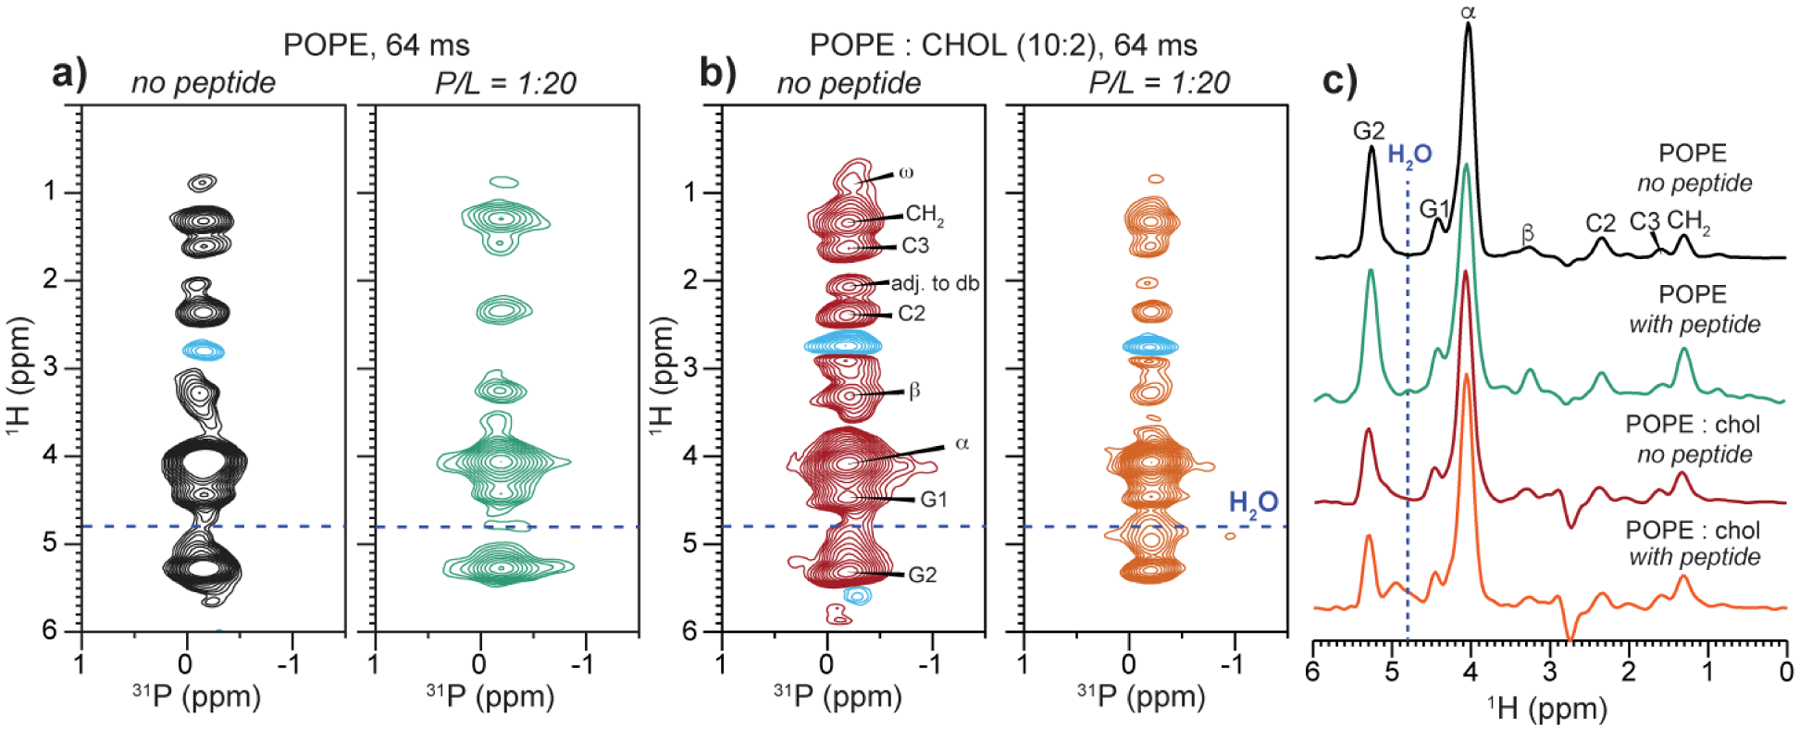
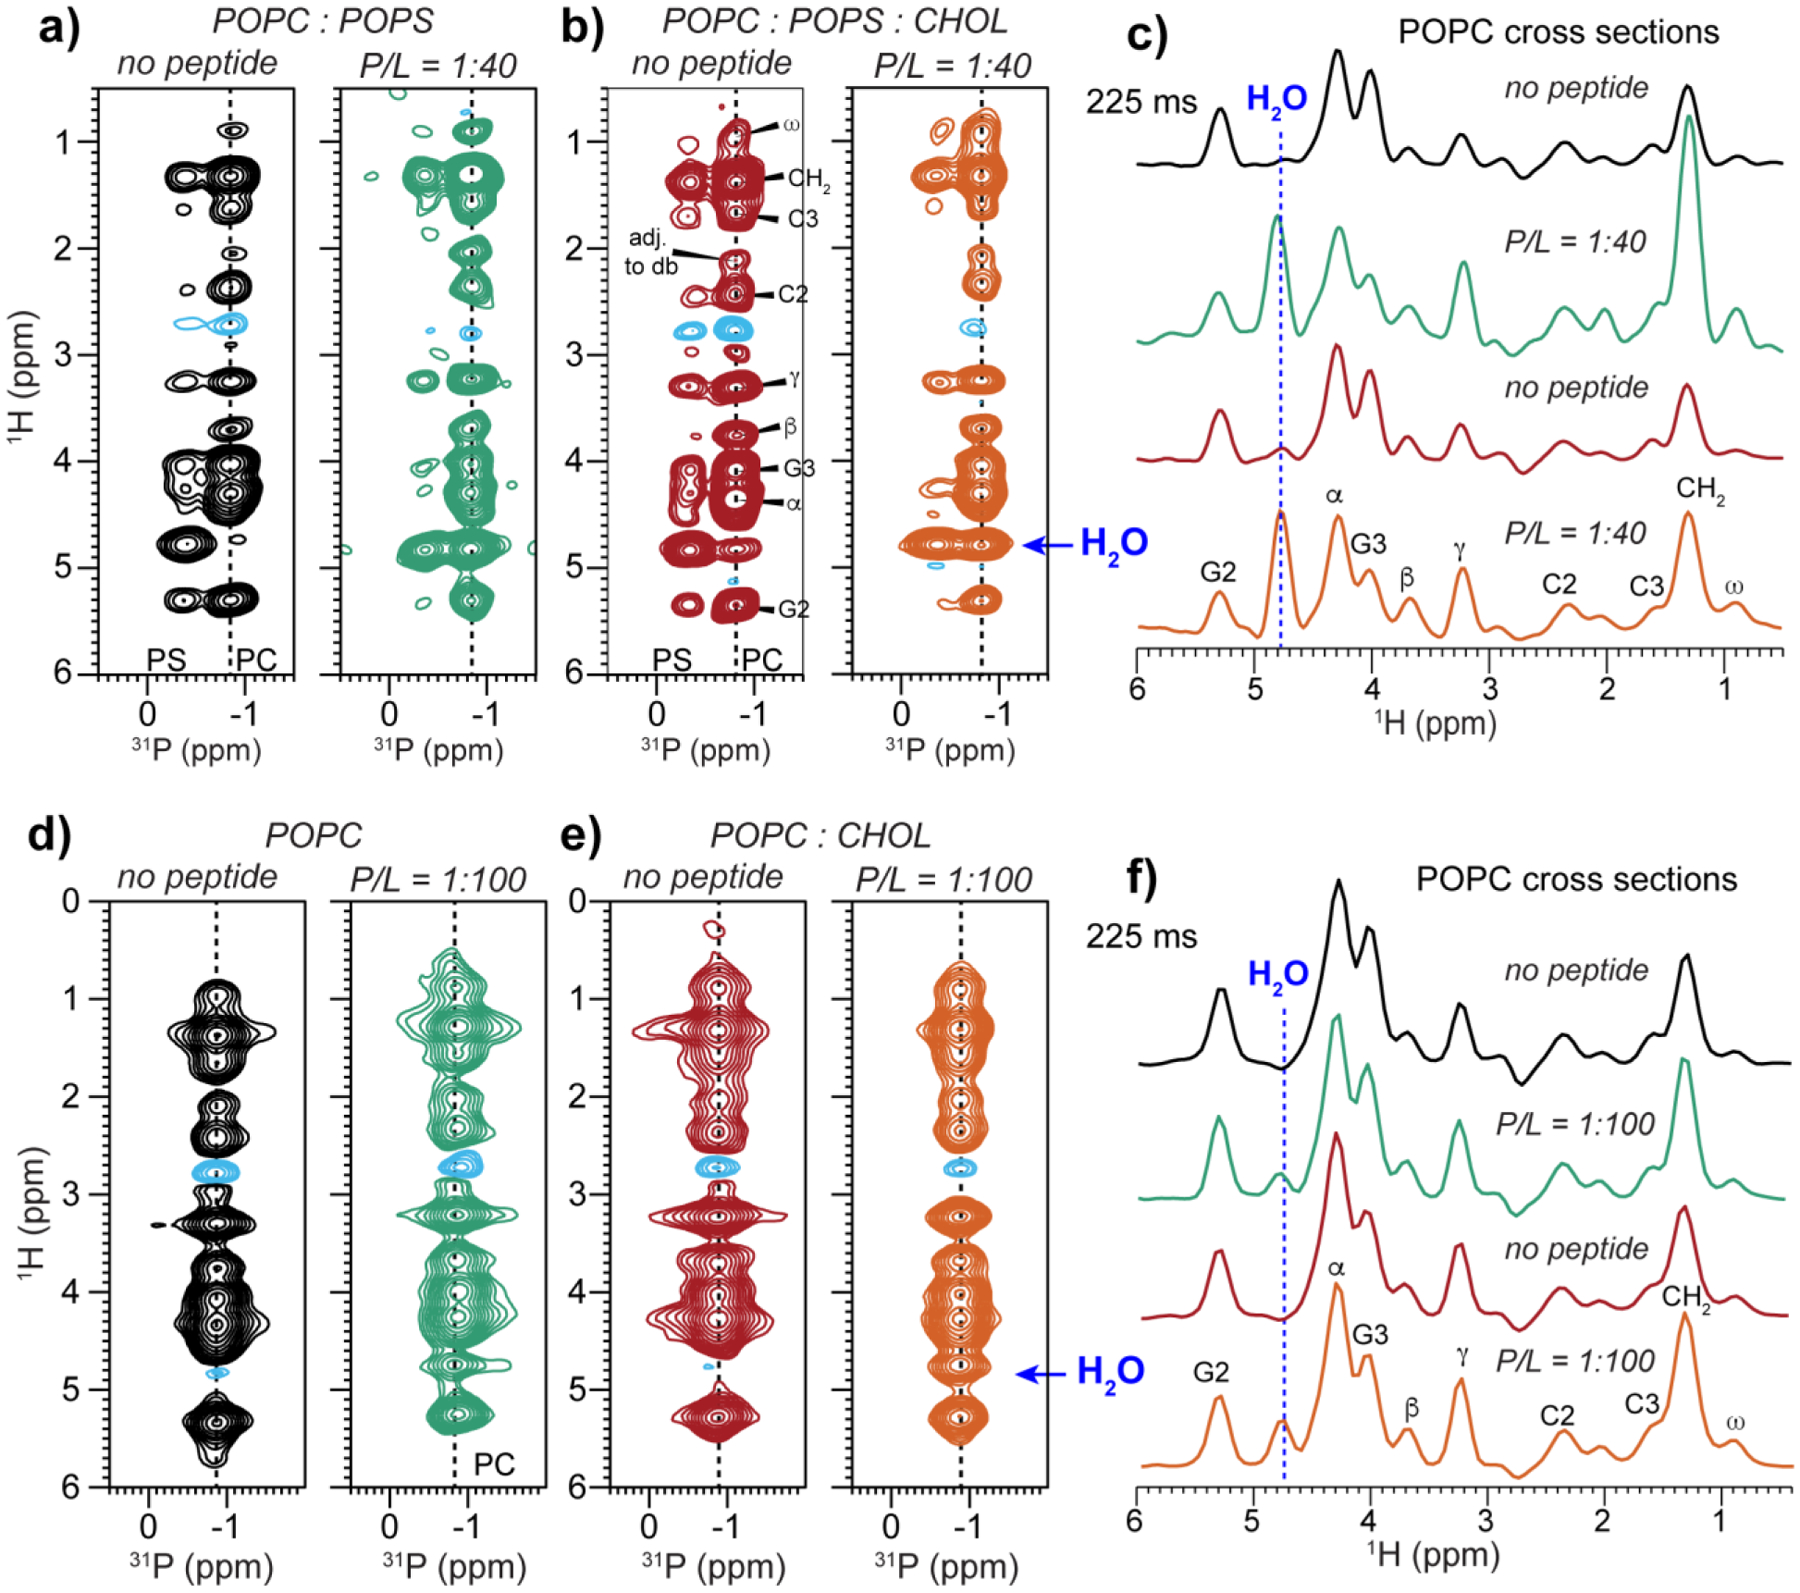
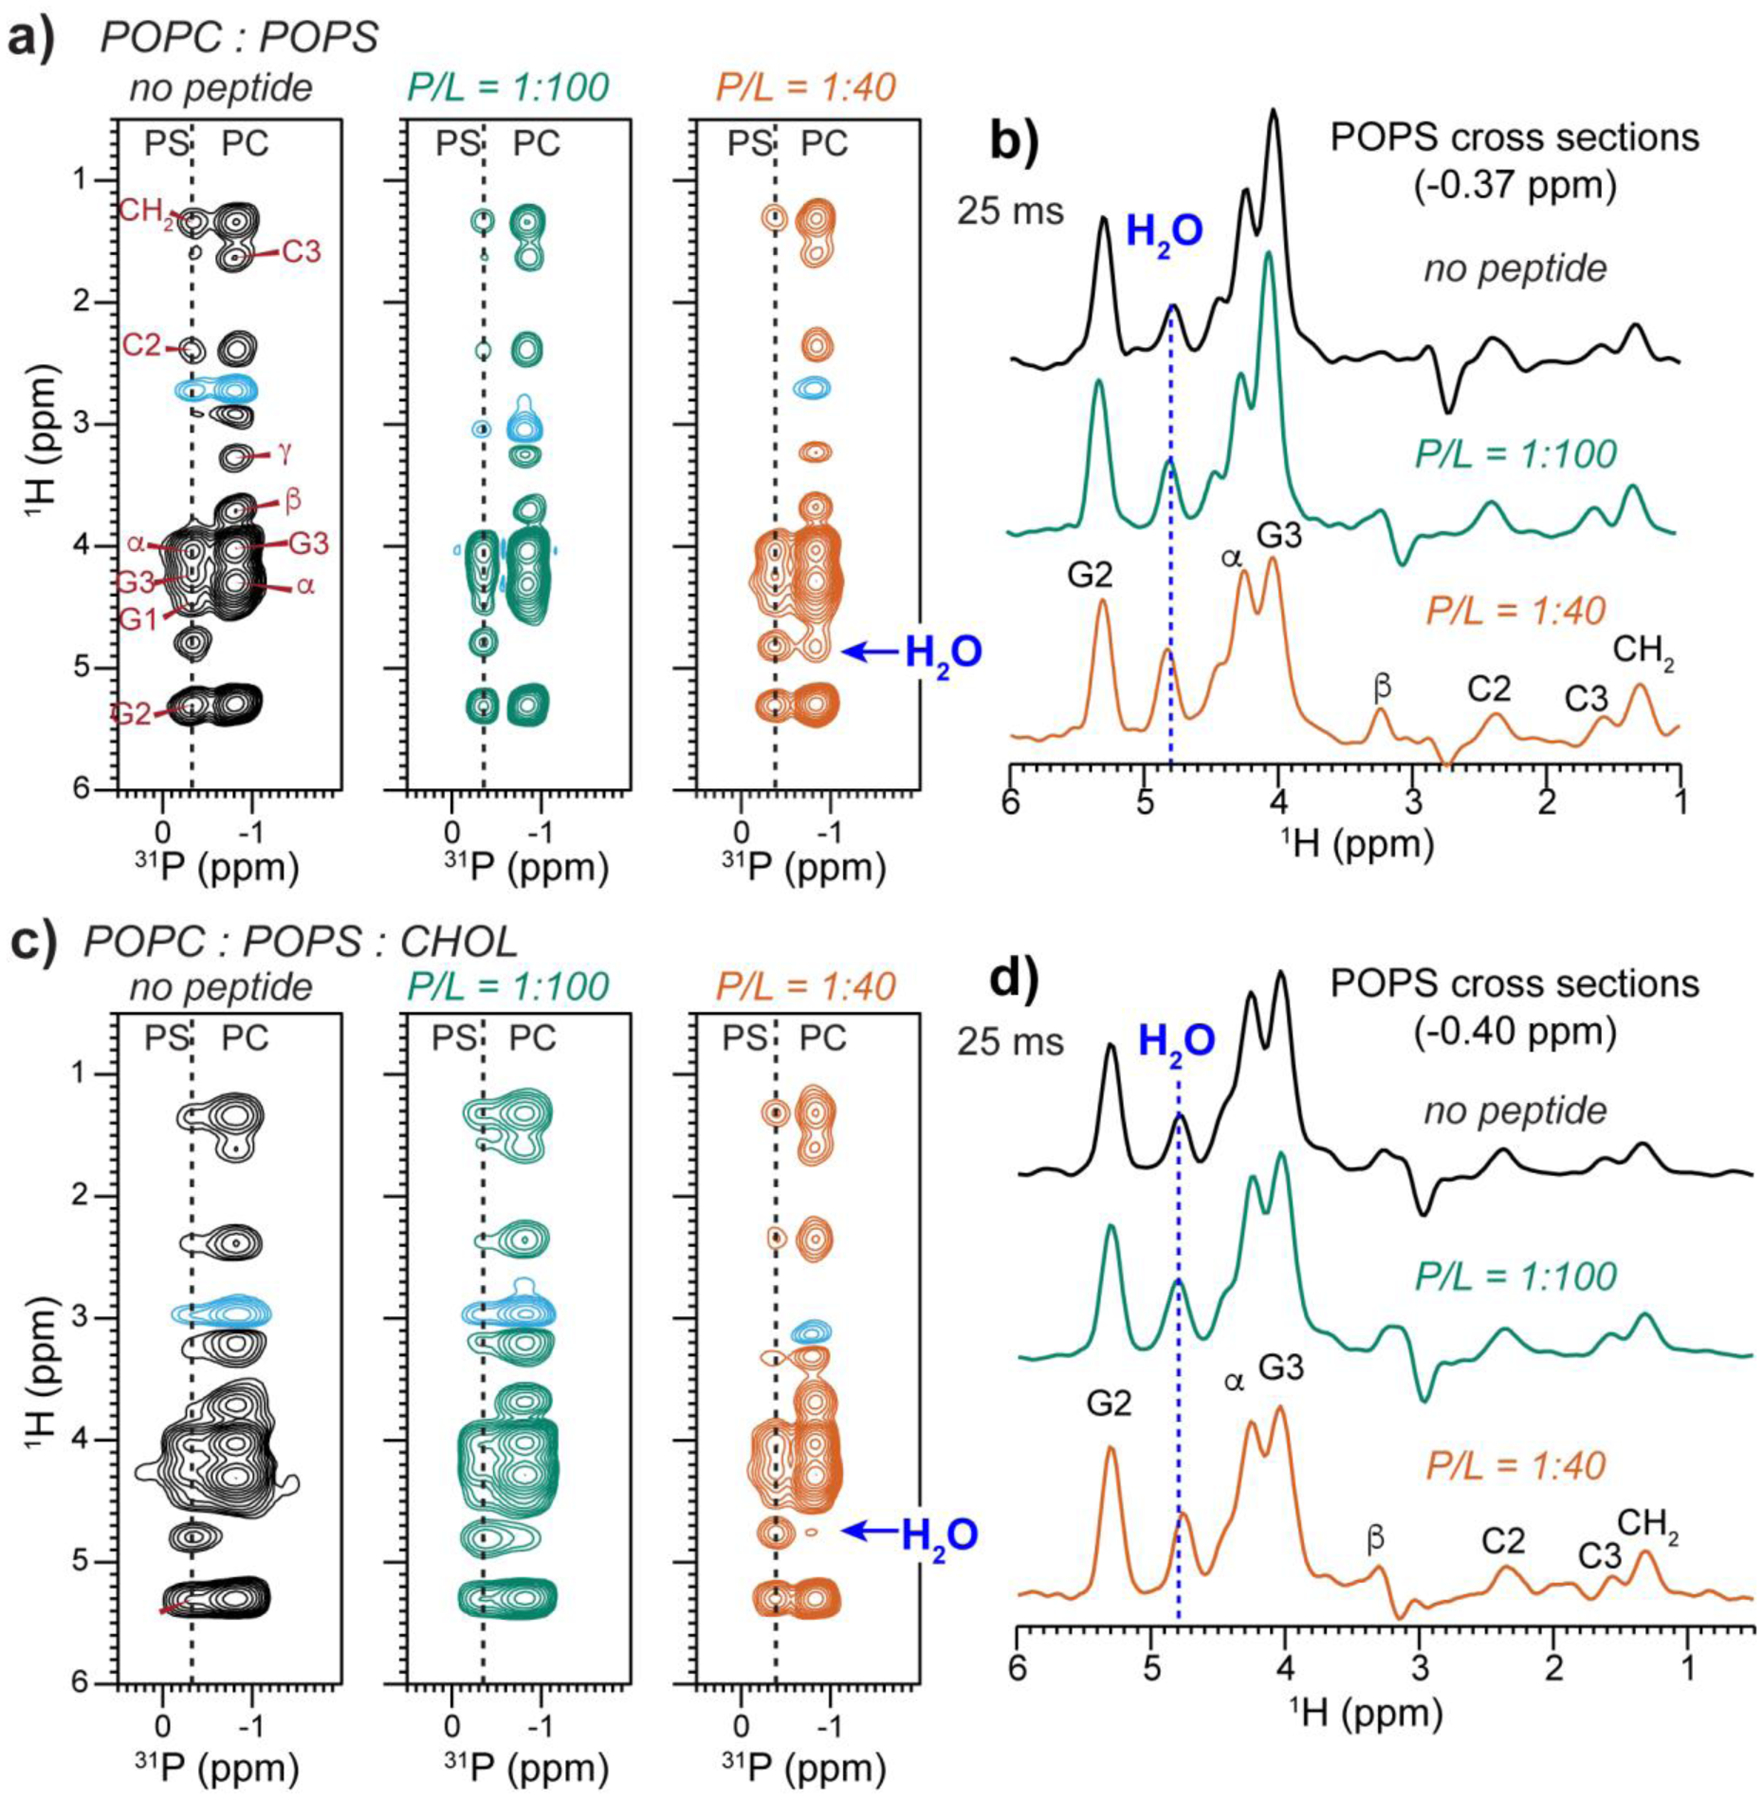
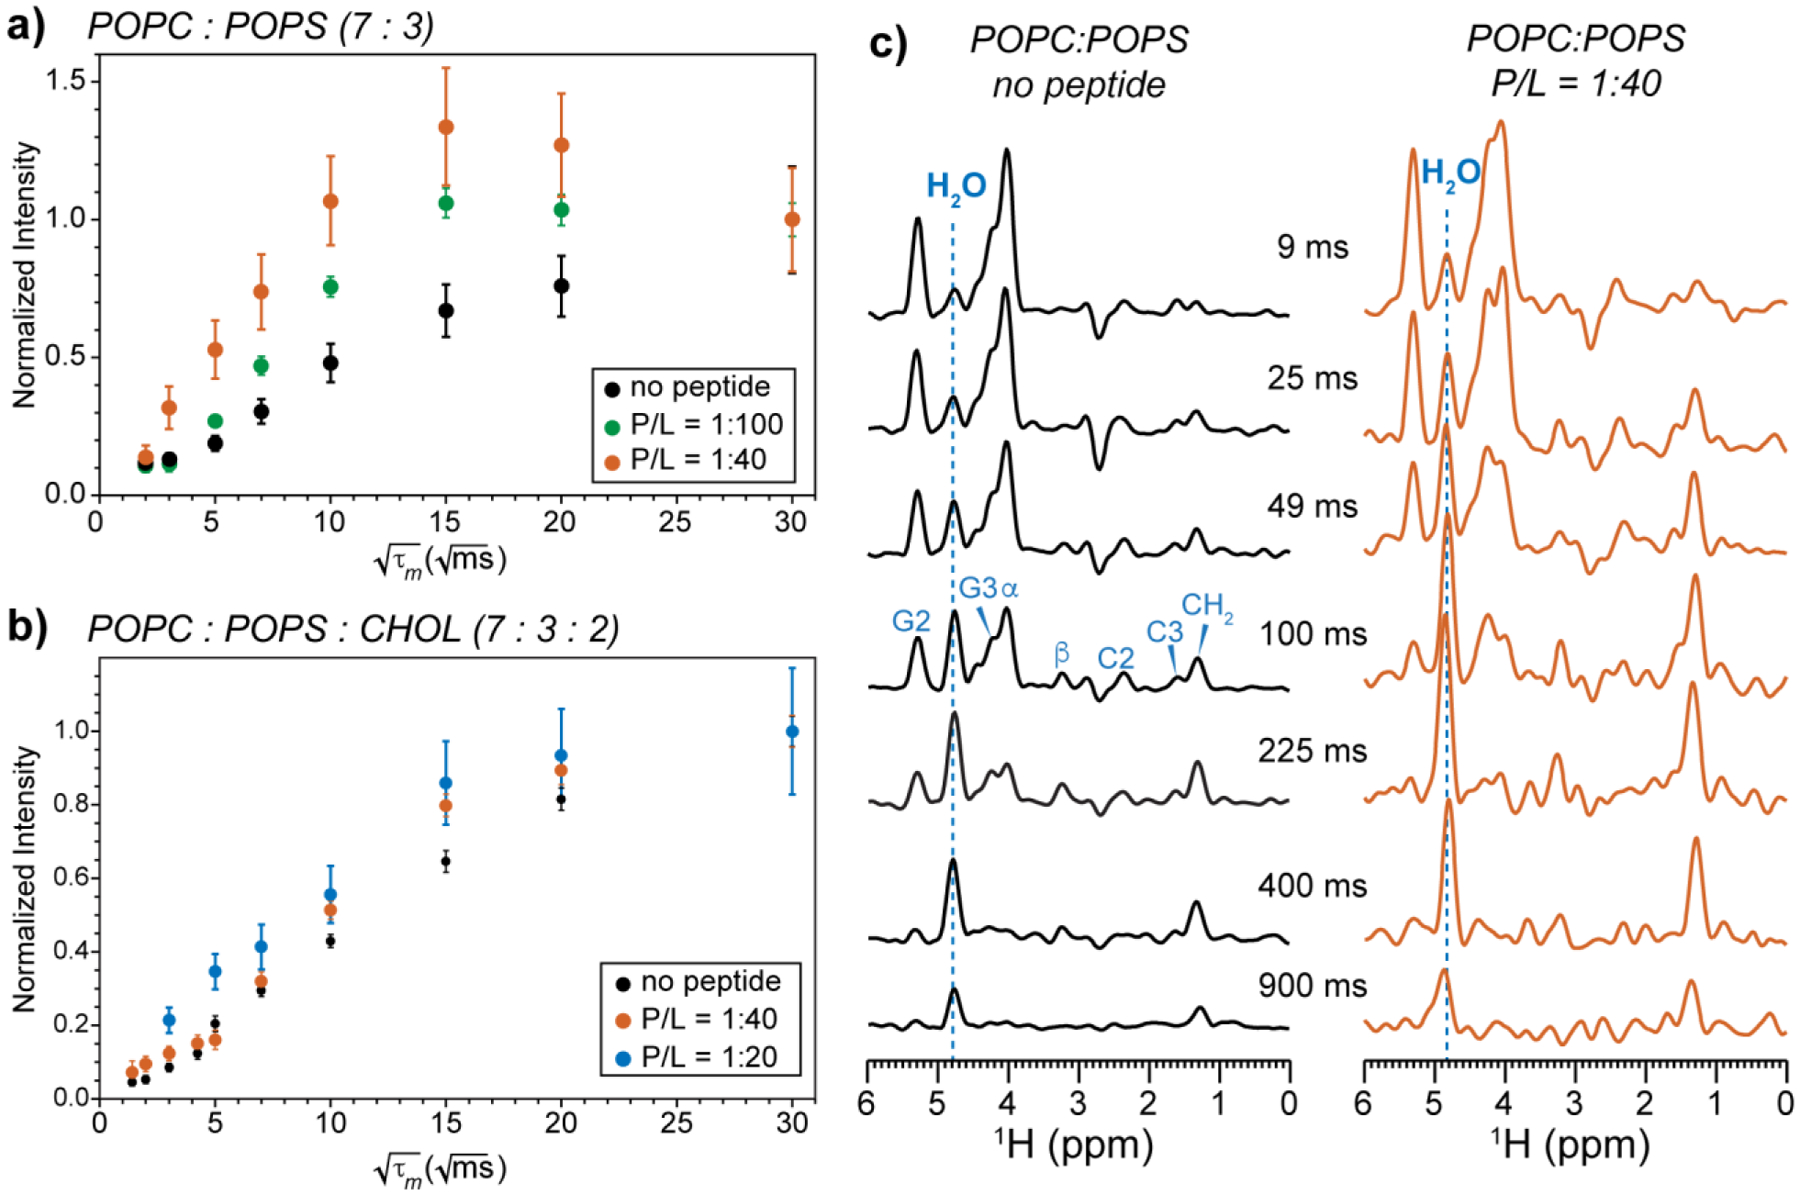
HIV-1 entry into cells requires coordinated changes of the conformation and dynamics of both the fusion protein, gp41, and the lipids in the cell membrane and virus envelope. Commonly proposed features of membrane deformation during fusion include high membrane curvature, lipid disorder, and membrane surface dehydration. The virus envelope and target cell membrane contain a diverse set of phospholipids and cholesterol. To dissect how different lipids interact with gp41 to contribute to membrane fusion, here we use 31P solid-state NMR spectroscopy to investigate the curvature, dynamics, and hydration of POPE, POPC and POPS membranes, with and without cholesterol, in the presence of a peptide comprising the membrane proximal external region (MPER) and transmembrane domain (TMD) of gp41. Static 31P NMR spectra indicate that the MPER-TMD induces strong negative Gaussian curvature (NGC) to the POPE membrane but little curvature to POPC and POPC:POPS membranes. The NGC manifests as an isotropic peak in the static NMR spectra, whose intensity increases with the peptide concentration. Cholesterol inhibits the NGC formation and stabilizes the lamellar phase. Relative intensities of magic-angle spinning 31P cross-polarization and direct-polarization spectra indicate that all three phospholipids become more mobile upon peptide binding. Finally, 2D 1H-31P correlation spectra show that the MPER-TMD enhances water 1H polarization transfer to the lipids, indicating that the membrane surfaces become more hydrated. These results suggest that POPE is an essential component of the high-curvature fusion site, and lipid dynamic disorder is a general feature of membrane restructuring during fusion.

Keywords: Cholesterol; Membrane curvature; Protein dynamics; Virus-cell fusion.


Figures

Figure 1.
Figure 1.
Schematic model of the possible effects of gp41 MPER-TMD trimers on membrane structure and dynamics, to be investigated by the experiments shown in this work. The peptide might coordinate with negative-curvature lipids such as POPE (green) to induce negative Gaussian curvature. The peptide might change lipid mobility and membrane surface hydration to charged lipids such as POPS (blue) and zwitterionic lipids such as POPC (orange). At neutral pH, MPER-TMD contains +3 charges. Two MPER-TMD trimers are depicted schematically, but the data here do not probe whether multiple trimers are in close proximity.
Figure 2.
Figure 2.
Static 31P NMR spectra of POPE membranes with varying cholesterol and peptide concentrations. The P/L ratio increases from the top to the bottom (0 to 1:10), while the cholesterol concentration increases from the left to the right. Spectra were measured at 298 K (black) and 310 K (red). (a) 31P spectra of CHOL-free POPE membranes. (b) 31P spectra of POPE : CHOL (10 : 1) membranes. (c) 31P spectra of POPE : CHOL (10 : 2) membranes. Dashed lines guide the eye to the POPE isotropic chemical shift. The approximate intensity fraction of the isotropic peak relative to the full spectrum is indicated for various spectra.
Figure 3.
Figure 3.
Static 31P NMR spectra of POPC and POPC : POPS membranes with varying MPER-TMD and cholesterol concentrations. (a) POPC membrane. (b) POPC : CHOL (10:2) membrane. (c) POPC : POPS (7:3) membrane. (d) POPC : POPS : CHOL (7:3:2) membrane. The P/L molar ratios are 1:100 or 1:40, as shown on the left of each spectrum. 31P spectra were measured at 298 K (black lines) and 310 K (red lines). Dashed lines guide the eye to the isotropic chemical shift.
Figure 4.
Figure 4.
31P CP-MAS (dotted lines) and DP-MAS (solid lines) spectra showing the effects of the MPER-TMD on phospholipid dynamics. The samples were spun at 5 kHz. Peptide-free spectra are shown in black while peptide-containing spectra are shown in red. For each panel, the peptide-free and peptide-containing DP spectra are scaled to match the intensities, so that the different intensities of the CP spectra indicate the different CP efficiencies of the two samples. (a) POPE spectra measured at 310 K. MPER-TMD decreased the CP intensities relative to the DP intensities, indicating that the peptide increased POPE dynamics. (b) POPE : CHOL (10:2) spectra measured at 293 K. (c) POPC : POPS (7:3) spectra without and with the peptide. The peptide decreased the CP intensities of both POPC and POPS relative to the DP intensities, indicating that it increased lipid dynamics. (d) POPC : POPS : CHOL (7:3:2) spectra. Gp41 decreased the CP efficiency like in (c). (e) DP and CP spectra of three POPC : POPS membranes: POPC : POPS (7:3) without the peptide, POPC : POPS (7:3) membrane with 1:40 peptide, and POPC : POPS : CHOL (7:3:2) with 1:40 peptide. When each pair of spectra are scaled to match the DP and CP intensities of the POPC peak at −0.84 ppm, the POPS CP intensity decreased relative to the DP intensity, indicating that POPS mobility is preferentially enhanced compared to POPC by the peptide.
Figure 5.
Figure 5.
2D 1H-31P correlation spectra of POPE and POPE : CHOL (10:2) membranes without and with MPER-TMD, measured with a 1H mixing time of 64 ms at 310 K. (a) POPE membranes without (black) and with (green) the peptide at a P/L of 1/20. (b) POPE : CHOL membrane without (red) and with (orange) the peptide at a P/L of 1:20. (c) 1H cross sections of the four 2D spectra. The peptide caused a broad water peak only in the membrane containing both the peptide and cholesterol.
Figure 6.
Figure 6.
2D 1H-31P correlation spectra of POPC : POPS and POPC membranes without and with MPER-TMD. The spectra were measured with a 1H mixing time of 225 ms at 293 K. (a) POPC : POPS (7:3) membranes without and with the peptide. (b) POPC : POPS : CHOL (7:3:2) membranes without and with the peptide. (c) POPC 1H cross sections of the 2D spectra in (a) and (b), extracted from a 31P chemical shift of −0.83 ppm (corresponding to POPC). Blue lines guide the eye to the water 1H chemical shift. The peptide-free membranes show no or weak water cross peaks while the peptide-containing samples show strong water cross peaks. (d) POPC membranes without and with peptide. (e) POPC : CHOL (10:2) membranes without and with peptide. (f) POPC 1H cross sections of the 2D spectra in (d) and (e). The peptide moderately increases the water cross peak intensity.
Figure 7.
Figure 7.
2D 1H-31P correlation spectra of POPC : POPS membranes without and with MPER-TMD and with and without cholesterol. The spectra were measured with a 1H mixing time of 25 ms at 293 K. (a) 2D spectra of POPC : POPS membranes without the peptide, with P : L of 1:100 (green) and 1:40 (orange). (b) POPS 1H cross sections of the POPC : POPS membranes for the three samples shown in (a). (c) 2D spectra of POPC : POPS : CHOL (7:3:2) membranes without the peptide, with P : L = 1:100 and 1:40. (d) POPS 1H cross sections of the POPC : POPS : CHOL membranes. The peptide moderately increased the water cross peak with POPS.
Figure 8.
Figure 8.
Water 1H magnetization transfer to POPS in POPC : POPS membranes containing varying concentrations of peptide and cholesterol. The buildup curves were extracted from 2D 1H-31P HETCOR spectra measured as a function of mixing time. (a) Water-POPS 1H-31P cross peak intensities in the POPC : POPS (7:3) membranes without the peptide (black), with 1:100 peptide (green), and 1:40 peptide (orange). Intensities have been corrected for water 1H spin-lattice (T1) relaxation. Error bars were propagated from the experimental signal-to-noise ratios. (b) Water-POPS cross peak intensities in POPC : POPS : CHOL (7:3:2) membranes without the peptide (black) and with 1:40 peptide (orange). (c) POPS 1H cross sections extracted from the 2D spectra of the POPC : POPS membrane without the peptide and with peptide (data shown in panel a). Dashed blue lines guide the eye to the water 1H chemical shift.

Similar articles

Cited by

References

    1. Weissman D, Rabin RL, Arthos J, Rubbert A, Dybul M, Swofford R, Venkatesan S, Farber JM, Fauci AS, Macrophage-tropic HIV and SIV envelope proteins induce a signal through the CCR5 chemokine receptor, Nature, 389 981–985 (1997). - PubMed
    1. Chen B, Molecular Mechanism of HIV-1 Entry, Trends Microbiol., 27 878–891 (2019). - PMC - PubMed
    1. Burton DR, Hangartner L, Broadly Neutralizing Antibodies to HIV and Their Role in Vaccine Design, Annu. Rev. Immunol, 34 635–659 (2016). - PMC - PubMed
    1. Harrison SC, Viral membrane fusion, Nature Struc. Mol. Biol, 15 690–698 (2008). - PMC - PubMed
    1. Chernomordik LV, Kozlov MM, Protein-lipid interplay in fusion and fission of biological membranes, Annual review of biochemistry, 72 175–207 (2003). - PubMed

Publication types

MeSH terms

LinkOut - more resources