. 2021 Nov 15;38(22):3146-3173.
doi: 10.1089/neu.2021.0184. Epub 2021 Sep 15.

Repetitive Low-Level Blast Exposure Improves Behavioral Deficits and Chronically Lowers Aβ42 in an Alzheimer Disease Transgenic Mouse Model

Affiliations

Repetitive Low-Level Blast Exposure Improves Behavioral Deficits and Chronically Lowers Aβ42 in an Alzheimer Disease Transgenic Mouse Model

Georgina Perez Garcia et al. J Neurotrauma. .

Abstract

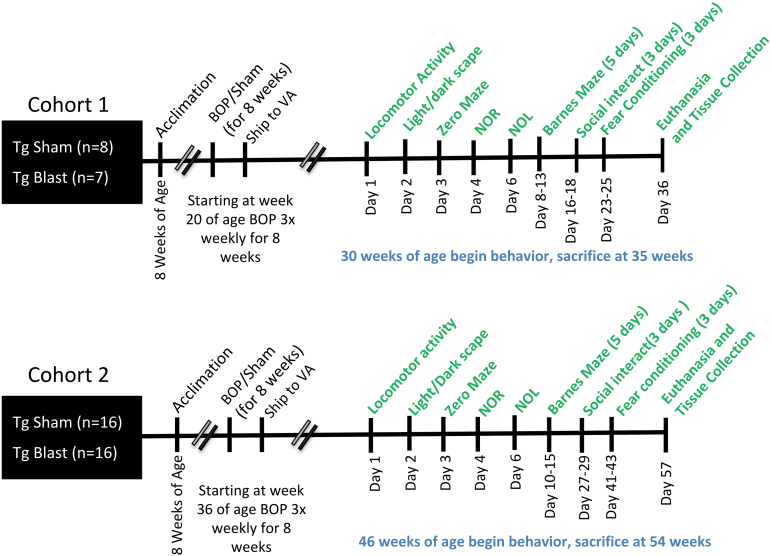
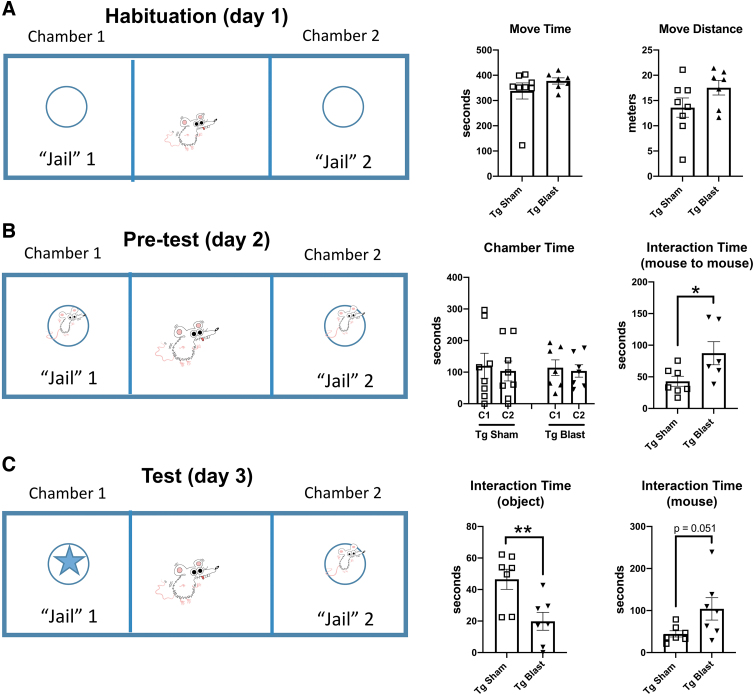
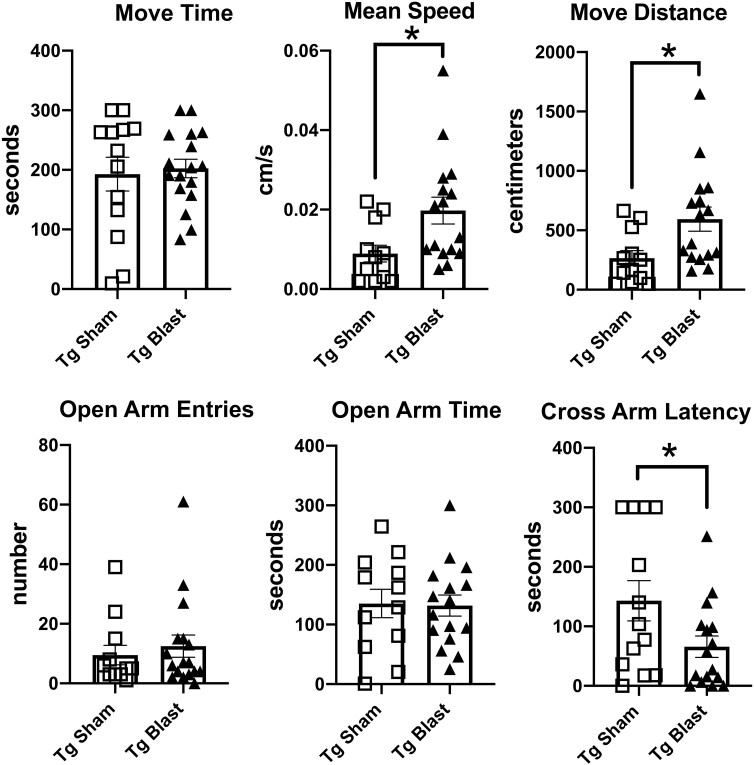
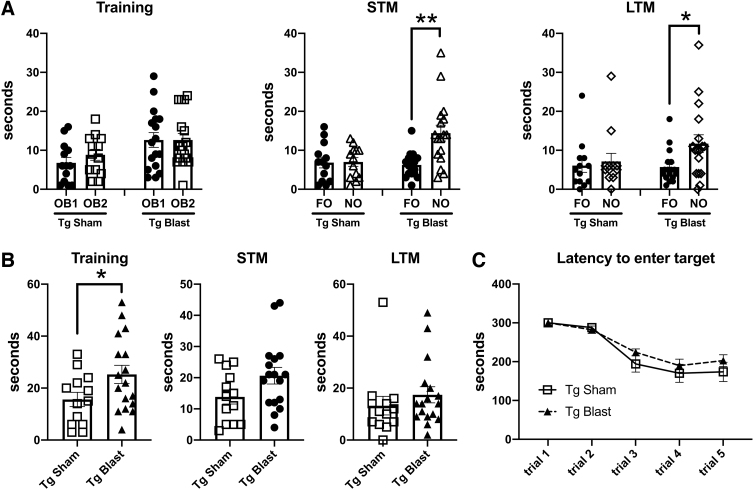
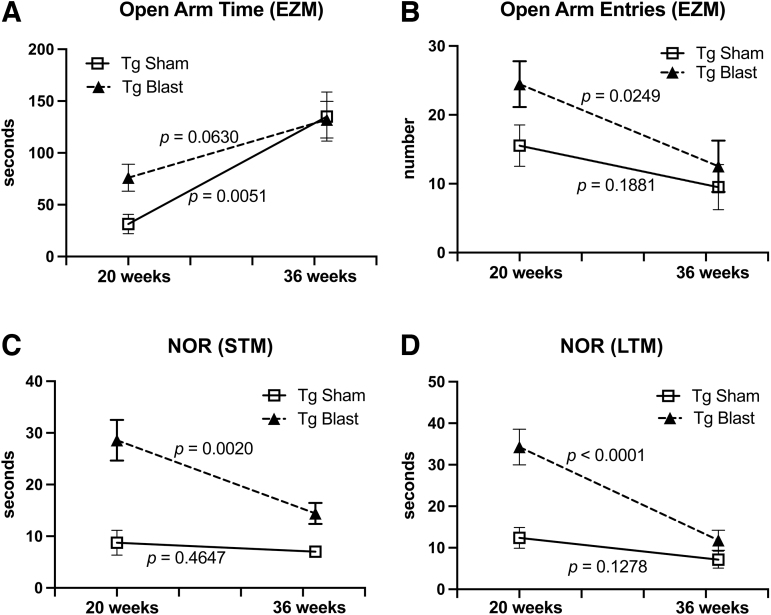
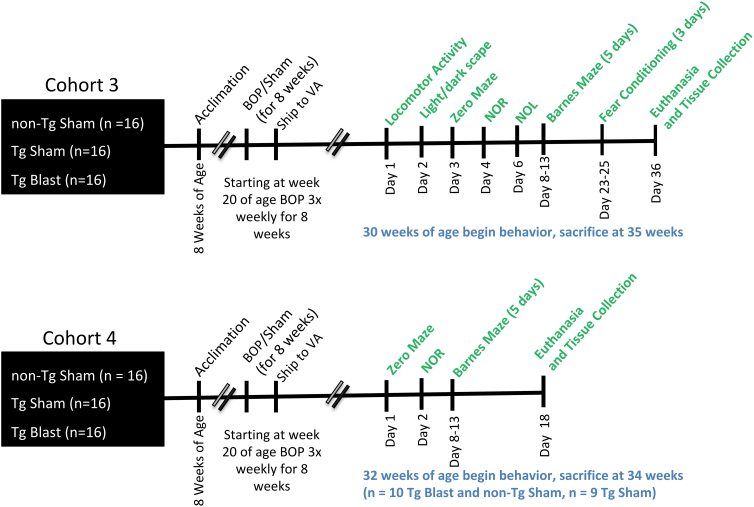
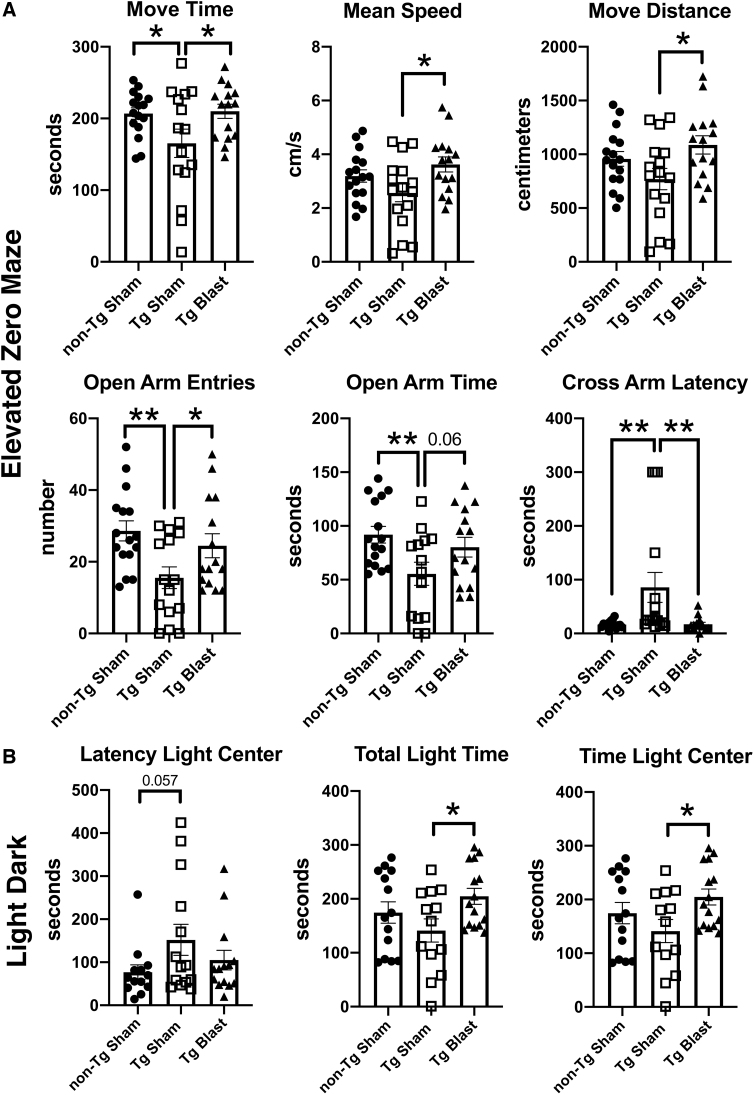
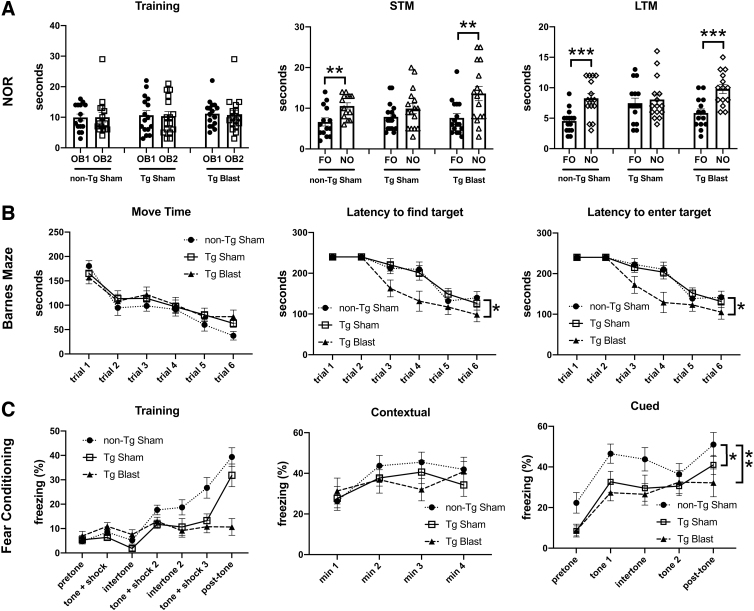
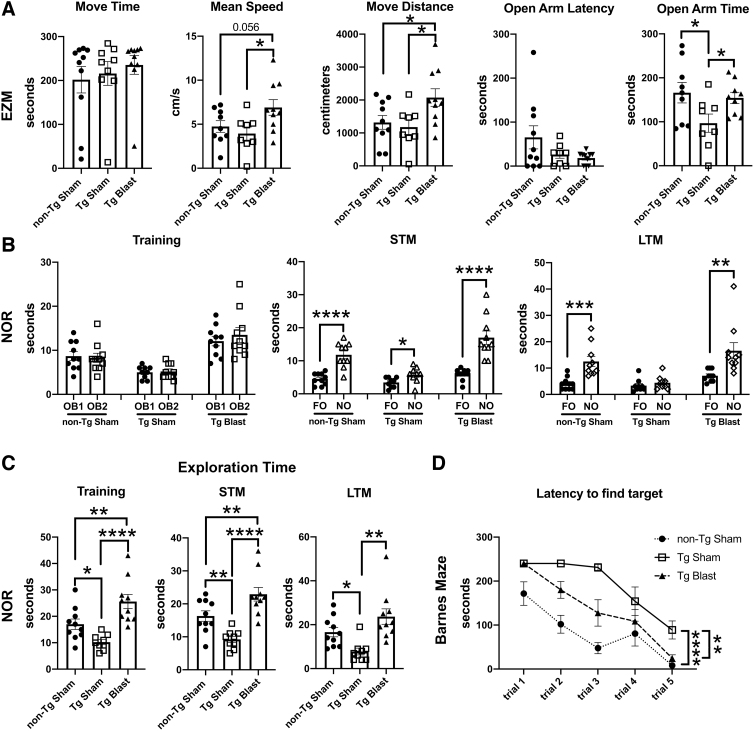
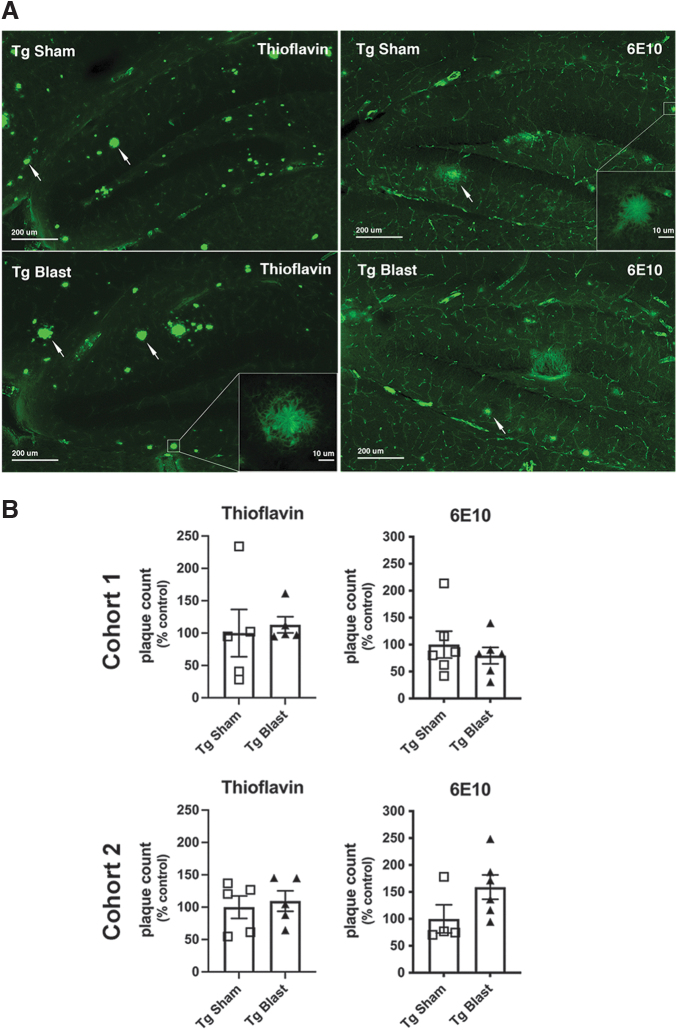
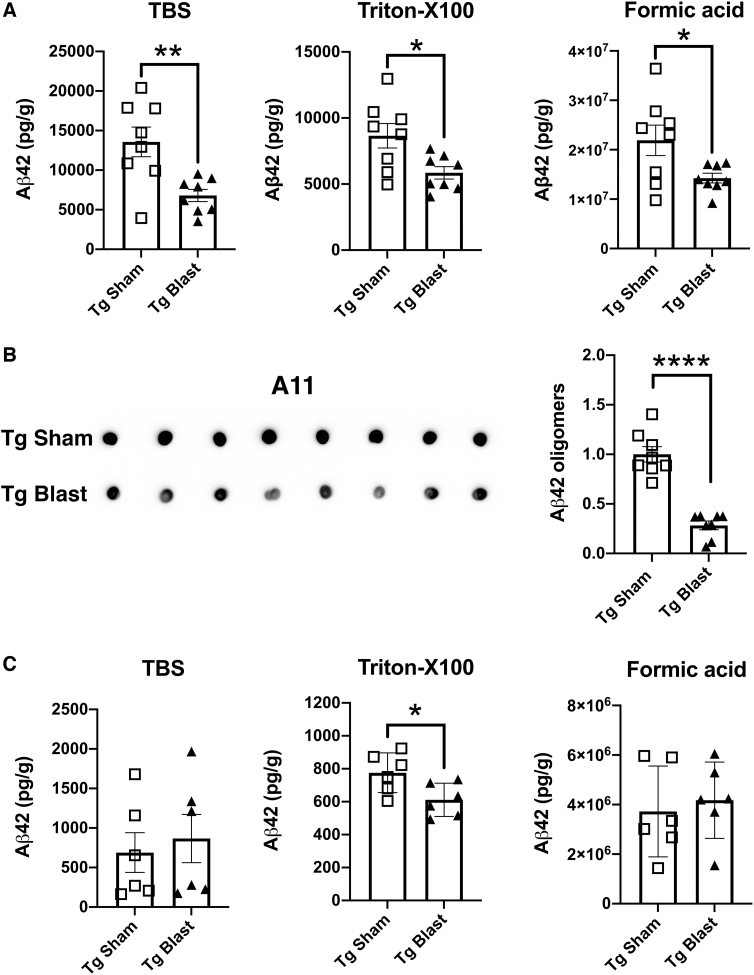
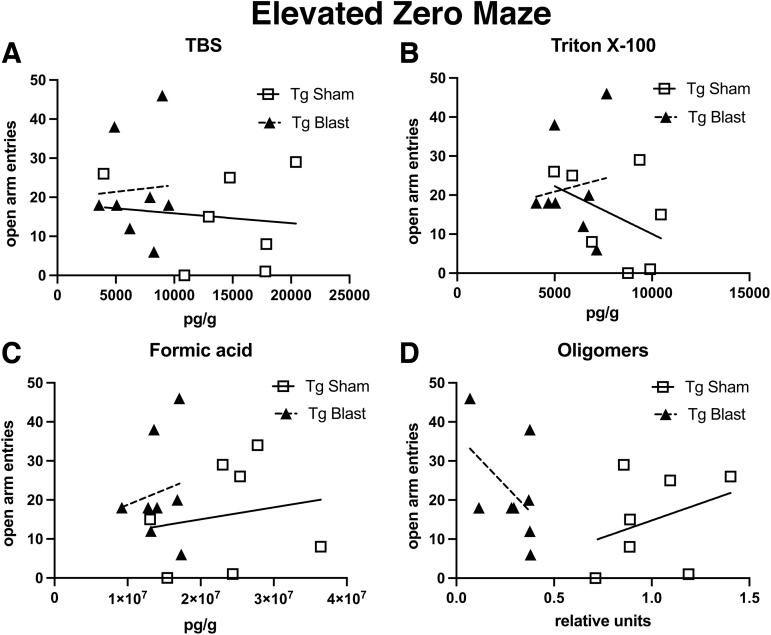
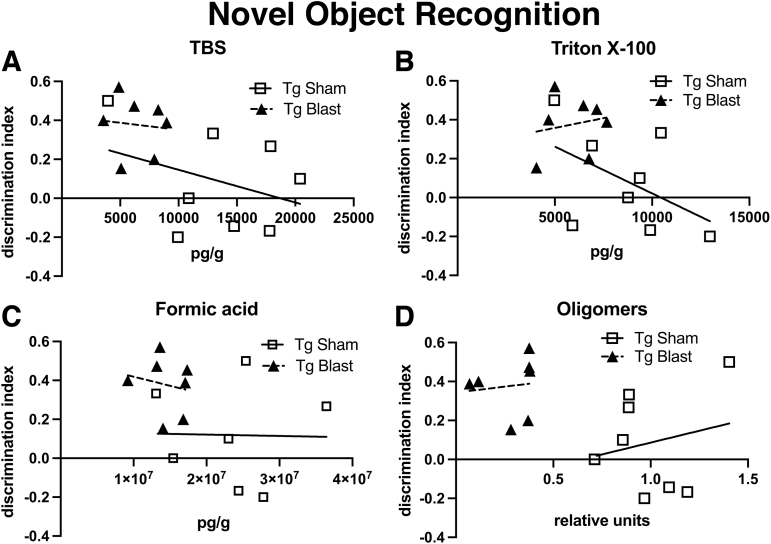
Public awareness of traumatic brain injury (TBI) in the military increased recently because of the conflicts in Iraq and Afghanistan where blast injury was the most common mechanism of injury. Besides overt injuries, concerns also exist over the potential adverse consequences of subclinical blast exposures, which are common for many service members. A TBI is a risk factor for the later development of neurodegenerative diseases, including Alzheimer disease (AD)-like disorders. Studies of acute TBI in humans and animals have suggested that increased processing of the amyloid precursor protein (APP) toward the amyloid beta protein (Aβ) may explain the epidemiological associations with AD. In a previous study, however, we found in both rat and mouse models of blast overpressure exposure that rather than increasing, rodent brain Aβ42 levels were decreased after acute blast exposure. Here we subjected APP/presenilin 1 transgenic mice (APP/PS1 Tg) to an extended sequence of repetitive low-level blast exposures (34.5 kPa) administered three times per week over eight weeks. If initiated at 20 weeks of age, these repetitive exposures, which were designed to mimic human subclinical blast exposures, reduced anxiety and improved cognition as well as social interactions in APP/PS1 Tg mice, returning many behavioral parameters in APP/PS1 Tg mice to levels of non-transgenic wild type mice. Repetitive low-level blast exposure was less effective at improving behavioral deficits in APP/PS1 Tg mice when begun at 36 weeks of age. While amyloid plaque loads were unchanged, Aβ 42 levels and Aβ oligomers were reduced in the brain of mice exposed to repetitive low-level blast exposures initiated at 20 weeks of age, although levels did not directly correlate with behavioral parameters in individual animals. These results have implications for understanding the nature of blast effects on the brain and their relationship to human neurodegenerative diseases.

Keywords: Alzheimer disease; amyloid beta protein; blast; transgenic mouse; traumatic brain injury.


Conflict of interest statement

No competing financial interests exist.

Figures

FIG. 1.
FIG. 1.
Timeline of experiments for cohorts 1 and 2. BOP, blast overpressure exposure; NOR, novel object recognition; NOL, novel object localization.
FIG. 2.
FIG. 2.
Histopathology in amyloid precursor protein/presenilin 1 (APP/PS1) transgenic (Tg) mice after blast exposure. Nissl staining in the hippocampus and neocortex (A, B) and cerebellum (C, D) is shown from sham- (A, C) and blast-exposed (B, D) APP/PS1 Tg mice sacrificed at seven weeks after the last blast exposure (35 weeks of age). No significant histological changes were noted. Scale bar = 200 μm.
FIG. 3.
FIG. 3.
Elevated zero maze (EZM), light/dark (L/D), and open-field testing of cohort 1. Amyloid precursor protein/presenilin 1 (APP/PS1) transgenic (Tg) mice were exposed to blast (n = 7) or sham (n = 8) conditions beginning at 20 weeks of age and received three blast exposures per week for eight weeks. Behavioral testing was begun at 30 weeks of age (Fig. 1). For the EZM (A), time in motion (Move Time), mean speed, open arm entries, open arm time, and the latency to cross into the second open arm (Cross Arm Latency) area shown. In the L/D task (B), the latency to the light edge, latency to reach the light center, entries into the light center, as well as time total time spent on the light side and total distance traveled on the light side are shown. For the open field (C), time in motion (Move Time), total distance traveled, the latency to the open field center, center entries, and time spent in the center of the open field are shown. Error bars indicate the standard error of the mean. Asterisks indicate values significantly different between groups (*p < 0.05, **p < 0.01, unpaired t tests).
FIG. 4.
FIG. 4.
Novel object recognition (NOR) testing of cohort 1. Blast-exposed (n = 7) and sham-exposed (n = 8) amyloid precursor protein/presenilin 1 (APP/PS1) transgenic (Tg) mice from cohort 1 were tested in novel object recognition (NOR) and novel object localization (NOL) tasks. Panel (A) shows time spent exploring the objects (OB1 and OB2) during the NOR training session as well as exploration of the previously presented familiar object (FO) compared with the novel object (NO) when presented 1 h (short-term memory, STM) or 24 h (long-term memory, LTM) later. Panels (B) and (C) show the discrimination index (B) and total time spent exploring the objects (C) during the indicated NOR sessions. Panel (D) shows time spent exploring the objects (OB1 and OB2) during the NOL training session as well as exploration of the previously presented objects in their familiar location (FL) compared with a novel location (NL) when presented 1 h later (STM). Asterisks indicate values significantly different between groups (*p < 0.05, ***p < 0.001, unpaired t tests).
FIG. 5.
FIG. 5.
Testing of cohort 1 in the Barnes maze and fear learning. Blast-exposed (n = 7) and control (n = 8) mice from cohort 1 were tested in a Barnes maze or fear conditioning paradigm. For the Barnes maze (A), total distance moved, time to enter the target quadrant, and time to enter the escape hole are shown across the five trials. A repeated measures analysis of variance (ANOVA) revealed a significant within subjects effect by trial (F 2.069, 26.902 = 5.973, p = 0.007) for distance moved but no effect of trial*condition (F 2.069, 26.902 = 1.211, p = 0.315). A test of between subject effects, however, revealed a significant group difference with the transgenic (Tg) blast moving more (F 1, 13 = 6.976, p = 0.020). A repeated measures ANOVA of the time to first enter the target quadrant revealed no significant within subjects effect by trial (F 2.180, 28.339 = 0.906, p = 0.467) or effect of trial*condition (F 2.180, 28.339 = 0.230, p = 0.814). A test of between subject effects, however, revealed a significant group difference with the Tg blast exhibiting shorter latencies (F 1, 13 = 8.973, p = 0.010). A repeated measures ANOVA of the time to enter the target revealed a significant within subjects effect by trial (F 4, 52 = 13.503, p < 0.001) but no effect of trial*condition (F 4, 52 = 0.108, p = 0.979). A test of between subject effects again revealed a significant group difference with the Tg blast exhibiting shorter latencies (F 1, 13 = 38.817, p < 0.001). Asterisks indicate values significantly different between blast- and sham-exposed mice at individual time points (*p < 0.05, **p < 0.01, unpaired t tests). For the fear conditioning paradigm (B), results are shown for the training phase, contextual fear memory, which was tested 24 h after training, and cued fear memory, which was tested another 24 h later. Pre-tone represents freezing before the first presentation of the tone ± shock. A repeated measures ANOVA of freezing during the training sessions revealed a significant within-subjects effect of freezing for baseline versus tone (F 2.813, 36.574 = 10.425, p < 0.001) but no effect of freezing*condition (F 2.813, 36.574 = 0.203, p = 0.883). A test of between-subject effects revealed no significant group differences during the training sessions (F 1, 13 = 0.966, p = 0.344). There were no differences between blast-exposed and control groups in the contextual testing (F 1.742, 19.157 = 2.753; p = 0.095). In the cued phase testing, neither group showed significant freezing after presentation of the tone (F 3, 27 = 0.790, p = 0.510; freezing*condition F 3, 27 = 0.349, p = 0.790). The blast-exposed, however, exhibited increased freezing compared with the controls (F 1, 9 = 8.758, p = 0.016). Error bars in all panels indicate the standard error of the mean.
FIG. 6.
FIG. 6.
Social preference testing of cohort 1. Blast-exposed (n = 7) and control (n = 8) mice from cohort 1 were tested in a social preference test. On day 1 (A), the test subjects were first habituated to the apparatus containing two empty metal cups in the side chambers. Time in motion (Move Time) and distance moved (Move Distance) area shown. The Tg sham and Tg blast mice spent an equal amount of time in motion and moved similar distances. In the pre-test on day 2 (B), subjects were allowed to interact with two non-Tg mice. Time spent in the two chambers (Chamber Time) and total time interacting with the test mice (Interaction TIme) are shown. The Tg sham and Tg blast mice spent an equal amount of time in each chamber (C1 and C2). The Tg blast mice, however, spent more time interacting with the two test mice. Panel (C) shows time interacting with the object and time interacting with the unfamiliar test mouse in the test phase on day 3. Compared with the Tg sham, the Tg blast mice spent less time interacting with the object and more time interacting with the test mouse. Error bars in all panels indicate the standard error of the mean. Asterisks indicate values significantly different between blast- and sham-exposed mice at individual time points (*p < 0.05, **p < 0.01, unpaired t tests).
FIG. 7.
FIG. 7.
Elevated zero maze (EZM) testing of cohort 2. Amyloid precursor protein/presenilin 1 (APP/PS1) transgenic (Tg) mice were exposed to blast (n = 16) or sham (n = 16) conditions beginning at 36 weeks of age and received three blast exposures per week for eight weeks. Behavioral testing was begun at 45 weeks of age (Fig. 1). Time in motion (Move Time), mean speed, total distance traveled (Move Distance), open arm entries, open arm time, and the latency to cross into the second open arm (Cross Arm Latency) are displayed. Error bars indicate the standard error of the mean. Asterisks indicate values significantly different (*p < 0.05, unpaired t tests).
FIG. 8.
FIG. 8.
Novel object recognition (NOR) and Barnes maze testing of cohort 2. Blast-exposed (n = 16) and sham-exposed (n = 16) amyloid precursor protein/presenilin 1 (APP/PS1) transgenic (Tg) mice from cohort 2 were tested in a NOR and Barnes maze. Panel (A) shows time spent exploring the objects (OB1 and OB2) during the NOR training session as well as exploration of the previously presented familiar object (FO) compared with the novel object (NO) when presented 1 h (short-term memory, STM) or 24 h (long-term memory, LTM) later. Panels (B) shows the total time spend exploring the objects during the indicated NOR sessions. Panel (C) shows the latency to enter the escape hole in the Barnes maze. A repeated measures analysis of variance revealed a significant within subjects effect by trial (F 2.731, 76.456 = 48.668, p < 0.001) but no effect of trial*condition (F 2.731, 76.456 = 1.054, p = 0.370) or between subjects effects (F 1, 28 = 0.971, p = 0.333). Error bars in all panels indicate the standard error of the mean. Asterisks indicate values significantly different (*p < 0.05, **p < 0.01, unpaired t tests).
FIG. 9.
FIG. 9.
Regression analysis of behavior comparing cohorts 1 and 2. Simple linear regressions were performed comparing cohorts 1 and 2, which were blast exposed beginning at 20 weeks (cohort 1) or 36 weeks (cohort 2) of age. Shown is open arm time (A) or open arm entries (B) in the elevated zero maze (EZM) as well as time spent exploring the novel object in short term memory (STM) (C) or long term memory (LTM) (D) testing of novel object recognition (NOR). The p values indicate whether slopes were significantly non-zero.
FIG. 10.
FIG. 10.
Timeline of experiments for cohorts 3 and 4. BOP, blast overpressure exposure; NOR, novel object recognition; NOL, novel object localization.
FIG. 11.
FIG. 11.
Elevated zero maze (EZM) and light dark (L/D) escape testing of cohort 3. Amyloid precursor protein/presenilin 1 (APP/PS1) transgenic (Tg) mice were exposed to blast (n = 16) or sham (n = 16) conditions. Non-transgenic (non-Tg) littermate controls (n = 16) were exposed to sham conditions. Mice were subjected to blast or sham conditions beginning at 20 weeks of age and received three blast exposures per week for eight weeks. The times for behavioral testing are shown in Figure 8 and Table 1. For the EZM (A), time in motion (Move Time), mean speed, distance moved (Move Distance), open arm entries, time spent in the open arms, and the latency to cross into the second open arm (Cross Arm Latency) are shown. In the L/D escape task (B), the latency to reach the light center as well as total time spent on the light side and time spent in the light center are shown. Error bars indicate the standard error of the mean. Overall group differences were compared using a one-way analysis of variance (ANOVA). Asterisks indicate significant differences between groups after a significant (p < 0.05) one-way ANOVA (*p < 0.05, **p < 0.01, Fisher least significant difference).
FIG. 12.
FIG. 12.
Testing of cohort 3 in novel object recognition (NOR), Barnes maze, and fear learning. Amyloid precursor protein/presenilin 1 (APP/PS1) transgenic (Tg) mice were exposed to blast (n = 16) or sham (n = 16) conditions. Non-transgenic (non-Tg) littermate controls (n = 16) were exposed to sham conditions. Panel (A) shows time spent exploring the objects (OB1 and OB2) during the NOR training session as well as exploration of the previously presented familiar object (FO) compared with the novel object (NO) when presented 1 h (short-term memory, STM) or 24 h (long-term memory, LTM) later. Panel (B) shows time in motion (Move Time), the latency to find the target quadrant, and the latency to enter the escape hole in the Barnes maze. For time in motion, a repeated measures analysis of variance (ANOVA) revealed a significant within subjects effect by trial (F 3.697, 162.651 = 25.521, p < 0.001) but no effect of trial*condition (F 7.393, 162.651 = 0.702, p = 0.678) or between subjects effects (F 2, 44 = 1.464, p = 0.242). A repeated measures ANOVA of time to find the target quadrant revealed a significant within subjects effect by trial (F 3.542, 155.062 = 48.808, p < 0.001) but no effect of trial*condition (F 7.048, 155.062 = 1.971, p = 0.062). There were significant between subjects effects (F 2, 44 = 4.314, p = 0.019). Post hoc tests (Fisher least significant difference [LSD]) revealed significant effects for non-Tg sham vs. blast Tg (p = 0.033) and sham Tg vs. blast Tg (p = 0.046) but no difference between non-Tg sham vs. Tg sham (p = 0.981). A repeated measures ANOVA of time to enter the escape hole revealed a significant within-subjects effect by trial (F 3.286, 141.293 = 50.984, p < 0.001) but no effect of trial*condition (F 6.572, 141.293 = 2.064, p = 0.055). There were significant between- subjects effects (F 2, 43 = 4.312, p = 0.020). Post hoc tests (Fisher LSD) revealed significant effects for non-Tg sham vs. blast Tg (p = 0.033) and Tg sham vs. Tg blast (p = 0.043) but no difference between non-Tg sham vs. sham Tg (p = 0.986). For the fear conditioning paradigm (C), results are shown for the training phase, contextual fear memory, which was tested 24 h after training, and cued fear memory, which was tested another 24 h later. Pre-tone represents freezing before the first presentation of the tone ± shock. A repeated measures ANOVA of freezing during the training sessions revealed a significant within-subjects effect of freezing across the training sessions for all groups combined (F 3.353, 147.533 = 33.836, p < 0.001) and a significant interaction effect of freezing*condition (F 6.706, 147.533 = 7.570, p < 0.001). When analyzed alone, however, the Tg blast mice did not show increased freezing across the trials (F 2.468, 37.023 = 1.036; p = 0.378). There were no differences between the groups in the contextual testing (F 2, 43 = 0.473; p = 0.626). In the cued phase testing, a repeated measures ANOVA comparing freezing in the pre-tone to first tone across all groups revealed increased freezing (F 1, 43 = 73.436, p < 0.001) without interaction effects (F 2, 43 = 0.504; p = 0.608). There were significant between-subjects effects (F 2, 43 = 6.108, p = 0.005), however. Post hoc tests revealed significant effects for non-Tg sham vs. Tg blast (p = 0.002) and non-Tg sham vs. Tg sham (p = 0.008) but no difference Tg sham vs. Tg blast (p = 0.594). A repeated measures ANOVA comparing freezing across all groups and all trials revealed increased freezing (F 4, 172 = 20.977, p < 0.001) without interaction effects (F 8, 172 = 0.728; p = 0.666). There were significant between-subjects effects (F 2, 43 = 4.281, p = 0.02), however. Post hoc tests revealed significant effects for non-Tg sham vs. Tg blast (p = 0.008) and non-Tg sham vs. sham Tg (p = 0.032) but no difference between Tg sham vs. Tg blast (p = 0.551). Error bars in all panels indicate the standard error of the mean (*p < 0.05, **p < 0.01, ***p < 0.001, Fisher LSD).
FIG. 13.
FIG. 13.
Elevated zero maze (EZM), novel object recognition (NOR) and Barnes maze testing of cohort 4. Amyloid precursor protein/presenilin 1 (APP/PS1) transgenic (Tg) mice were exposed to blast (n = 10) or sham (n = 9) conditions. Non-transgenic (non-Tg) littermate controls (n = 10) were exposed to sham conditions. For the EZM (A), time in motion (Move Time), mean speed, distance moved (Move Distance), open arm latency, and time spent in the open arms area are shown. Panel (B) shows time spent exploring the objects (OB1 and OB2) during the novel object recognition (NOR) training session as well as exploration of the previously presented familiar object (FO) compared with the novel object (NO) when presented 1 h (short-term memory, STM) or 24 h (long-term memory, LTM) later. Panel (C) shows the total time spent exploring the objects during the indicated NOR sessions. Error bars in all panels indicate the standard error of the mean. Overall group differences were compared using a one-way analysis of variance (ANOVA). Asterisks indicate significant differences between groups after a significant (p < 0.05) one-way ANOVA (*p < 0.05, **p < 0.01, ***p < 0.001, ****p < 0.0001, Fisher least significant difference [LSD]). Panel (D) shows time to enter the target quadrant in the Barnes maze. A repeated measures ANOVA revealed a significant within-subjects effect by trial (F 2.306, 57.641 = 37.499, p < 0.001) but no effect of trial*condition (F 4.611, 57.641 = 2.368, p = 0.055). There were significant between-subjects effects (F 2, 25 = 25.178, p < 0.001). Post hoc tests (Fisher LSD) revealed significant effects for non-Tg sham vs. Tg sham (p < 0.001), non-Tg sham vs. Tg blast (p = 0.003), and Tg blast vs. Tg sham (p = 0.001). A one-way ANOVA of latencies for trial 5 alone revealed significant between-group effects (F 2, 25 = 11.90, p = 0.0002). Post hoc comparisons revealed significant effects for non-Tg vs. Tg sham (p < 0001) and Tg blast vs. Tg sham (p = 0.0013) but no difference between non-Tg and Tg blast (p = 0.35). Error bars in all panels indicate the standard error of the mean (**p < 0.01, ****p < 0.001, Fisher LSD).
FIG. 14.
FIG. 14.
Amyloid plaque loads in brains of mice exposed to repetitive low-level blast exposure. Plaque density in the hippocampus was determined in amyloid precursor protein/presenilin 1 (APP/PS1) transgenic (Tg) mice from cohorts 1 and 2 subjected to blast or sham conditions using either thioflavin S staining or immunohistochemical staining with the antibody 6E10. Panel (A) shows representative sections stained with thioflavin S or immunostained with antibody 6E10 from cohort 1. Scale bars = 200 μm; insets = 10 μm. Panel (B) shows quantitative plaque counts expressed as number per hippocampus. Error bars in all panels indicate the standard error of the mean. There were no statistically significant differences between the groups.
FIG. 15.
FIG. 15.
The Aβ42 levels and Aβ oligomers in the brain of mice exposed to repetitive low-level blast. In panel (A), Aβ42 levels were determined by enzyme-linked immunosorbent assay in blast- or sham-exposed amyloid precursor protein/presenilin 1 (APP/PS1) transgenic (Tg) mice from cohort 3. In panel (B), Aβ oligomers were determined in the Tris-buffered saline (TBS) fraction using the same samples studied in panel (A) with antibody A11. A representative dot blot is shown and is quantified in the bar graph. Panel (C) shows Aβ42 in a group of mice from cohort 4 that were euthanized within one week of the last blast exposure. Error bars indicate the standard error of the mean (*p < 0.05, **p < 0.01, ****p < 0.0001, unpaired t tests).
FIG. 16.
FIG. 16.
Correlations between soluble, insoluble and oligomeric Aβ42 with behavioral performance in the elevated zero maze (EZM). The Aβ42 in the Tris-buffered saline (TBS) (A), Triton X-100 (B), and formic acid (C) fractions as well as oligomeric Aβ42 (D) in amyloid precursor protein/presenilin 1 (APP/PS1) transgenic (Tg) mice from cohort 3 (Fig. 15) were correlated with open arm entries in the EZM (Fig. 11). There were no significant correlations (Table 2).
FIG. 17.
FIG. 17.
Behavioral measures in novel object recognition (NOR) correlated with soluble, insoluble, and oligomeric Aβ42. The Aβ42 in the Tris-buffered saline (TBS) (A), Triton X-100 (B), and formic acid (C) fractions as well as oligomeric Abβ42 (D) determined in amyloid precursor protein/presenilin 1 (APP/PS1) transgenic (Tg) mice from cohort 3 (Fig. 15), were correlated with data for the SM testing phase of NOR (Fig. 12). There were no significant correlations (Table 2).

Similar articles

Cited by

References

    1. Elder, G.A., Ehrlich, M.E., and Gandy, S. (2019). Relationship of traumatic brain injury to chronic mental health problems and dementia in military veterans. Neurosci. Lett. 707, 134294. - PubMed
    1. Hoge, C.W., McGurk, D., Thomas, J.L., Cox, A.L., Engel, C.C., and Castro, C.A. (2008). Mild traumatic brain injury in U.S. Soldiers returning from Iraq. N. Engl. J. Med. 358, 453–463. - PubMed
    1. Engel, C., Hoch, E. and Simmons, M. (2019). The Neurological Effects of Repeated Exposure to Military Occupational Blast: Implications for Prevention and Health. Proceedings, Findings, and Expert Recommendations from the Seventh Department of Defense State-of-the-Science Meeting. Arlington, VA: Rand Corporation.
    1. Carr, W., Stone, J.R., Walilko, T., Young, L.A., Snook, T.L., Paggi, M.E., Tsao, J.W., Jankosky, C.J., Parish, R.V., and Ahlers, S.T. (2016). Repeated low-level blast exposure: a descriptive human subjects study. Mil. Med. 181, Suppl. 5, 28–39. - PubMed
    1. Gandy, S., Ikonomovic, M.D., Mitsis, E., Elder, G., Ahlers, S.T., Barth, J., Stone, J.R., and DeKosky, S.T. (2014). Chronic traumatic encephalopathy: clinical-biomarker correlations and current concepts in pathogenesis. Mol. Neurodegener. 9, 37. - PMC - PubMed

Publication types

MeSH terms