. 2021 Aug 6;14(1):383.
doi: 10.1186/s13071-021-04876-2.

Long-term dynamics of trematode infections in common birds that use farmlands as their feeding habitats

Affiliations

Long-term dynamics of trematode infections in common birds that use farmlands as their feeding habitats

Jiljí Sitko et al. Parasit Vectors. .

Abstract

Background: The biodiversity of farmland habitats is witnessing unprecedented change, mostly in declines and simplification of assemblages that were established during centuries of the use of traditional agricultural techniques. In Central Europe, conspicuous changes are evident in populations of common farmland birds, in strong contrast to forest birds in the same region. However, there is a lack of information on longitudinal changes in trematodes that are associated with common farmland birds, despite the fact that diversity of trematodes is directly linked to the preservation of long-established food webs and habitat use adaptations of their hosts.

Methods: We analyzed the population trends of trematodes for the period 1963-2020 in six bird species that use Central European farmlands as their predominant feeding habitats. Namely, we examined Falco tinnunculus, Vanellus vanellus, winter populations of Buteo buteo, Ciconia ciconia, extravilan population of Pica pica, and Asio otus, all originating from the Czech Republic.

Results: We observed dramatic population losses of all trematode species in C. ciconia and V. vanellus; the changes were less prominent in the other examined hosts. Importantly, the declines in prevalence and intensity of infection affected all previously dominant species. These included Tylodelphys excavata and Chaunocephalus ferox in C. ciconia, Lyperosomum petiolatum in P. pica, Strigea strigis in A. otus, Neodiplostomum attenuatum and Strigea falconis in B. buteo (χ2 test P < 0.001 each), and Echinoparyphium agnatum and Uvitellina adelpha in V. vanellus (completely absent in 2011-2000). In contrast, the frequency and spectrum of isolated records of trematode species did not change to any large extent except those in V. vanellus.

Conclusions: The analysis of six unrelated common bird species that use farmlands as their feeding habitats revealed a previously unreported collapse of previously dominant trematode species. The previously dominant trematode species declined in terms of both prevalence and intensity of infection. The causes of the observed declines are unclear; of note is, however, that some of the broadly used agrochemicals, such as azole fungicides, are well known for their antihelminthic activity. Further research is needed to provide direct evidence for effects of field-realistic concentrations of azole fungicides on the survival and fitness of trematodes.

Keywords: Agricultural landscapes; Biodiversity decline; Common farmland birds; Helminths; Population dynamics; Trematoda.


Conflict of interest statement

On behalf of both authors, the corresponding author states that there is no conflict of interest.

Figures

Fig. 1
Fig. 1
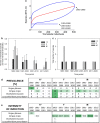
Dynamics of trematode assemblages associated with the Czech population of Ciconia ciconia. (a) The rarefaction curves (red; 95% confidence intervals in blue) of component communities in C. ciconia calculated separately for each of the four study periods (1963–2000, 2001–2010, 2011–2020). Dynamics of changes in the number of trematode species per host individual (b), the total number of trematode species found (c), and the prevalence (d) and the intensity of infection ± SE (e). The data for the prevalence and the intensity of infection are shown as a heatmap; the prevalence is shown as a percent of infected hosts, with the color green assigned to the highest prevalence of the respective trematode species and white assigned to zero prevalence. A similar color code of the heatmap was used to visualize the intensity of infection; however, the whole color code scale of the intensity of infection is based on all fields within the heatmap. Source data are provided in Additional file 1: Table S7
Fig. 2
Fig. 2
Dynamics of trematode assemblages associated with the Czech extravilan population of Pica pica. (a) The rarefaction curves (red; 95% confidence intervals in blue) of component communities in P. pica calculated separately for each of the three study periods (1991–2000, 2001–2010, 2011–2020). Dynamics of changes in the number of trematode species per host individual (b), the total number of trematode species found (c), and the prevalence (d) and the intensity of infection ± SE (e). The data for the prevalence and the intensity of infection are shown as a heatmap; the prevalence is shown as a percent of infected hosts, with the color green assigned to the highest prevalence of the respective trematode species and white assigned to zero prevalence. A similar color code of the heatmap was used to visualize the intensity of infection; however, the whole color code scale of the intensity of infection is based on all fields within the heatmap. Source data are provided in Additional file 1: Table S8
Fig. 3
Fig. 3
Dynamics of trematode assemblages associated with the Czech population of Asio otus. (a) The rarefaction curves (red; 95% confidence intervals in blue) of component communities in A. otus calculated separately for each of the four study periods (1963–1990, 1991–2000, 2001–2010, 2011–2020). Dynamics of changes in the number of trematode species per host individual (b), the total number of trematode species found (c), and the prevalence (d) and the intensity of infection ± SE (e). The data for the prevalence and the intensity of infection are shown as a heatmap; the prevalence is shown as a percent of infected hosts, with the color green assigned to the highest prevalence of the respective trematode species and white assigned to zero prevalence. A similar color code of the heatmap was used to visualize the intensity of infection; however, the whole color code scale of the intensity of infection is based on all fields within the heatmap. Source data are provided in Additional file 1: Table S9
Fig. 4
Fig. 4
Dynamics of trematode assemblages associated with the Czech winter population of Buteo buteo. (a) The rarefaction curves (red; 95% confidence intervals in blue) of component communities in B. buteo calculated separately for each of the five study periods (1981–1990, 1991–2000, 2001–2010, 2011–2020). Dynamics of changes in the number of trematode species per host individual (b), the total number of trematode species found (c), and the prevalence (d) and the intensity of infection ± SE (e). The data for the prevalence and the intensity of infection are shown as a heatmap; the prevalence is shown as a percent of infected hosts, with the color green assigned to the highest prevalence of the respective trematode species and white assigned to zero prevalence. A similar color code of the heatmap was used to visualize the intensity of infection; however, the whole color code scale of the intensity of infection is based on all fields within the heatmap. Source data are provided in Additional file 1: Table S10
Fig. 5
Fig. 5
Dynamics of trematode assemblages associated with the Czech population of Falco tinnunculus. (a) The rarefaction curves (red; 95% confidence intervals in blue) of component communities in F. tinnunculus calculated based on birds that were examined in study periods 1991–2000, 2001–2010, and 2011–2020. Dynamics of changes in the number of trematode species per host individual (b), the total number of trematode species found (c), and the prevalence (d) and the intensity of infection ± SE (e). The data for the prevalence and the intensity of infection are shown as a heatmap; the prevalence is shown as a percent of infected hosts, with the color green assigned to the highest prevalence of the respective trematode species and white assigned to zero prevalence. A similar color code of the heatmap was used to visualize the intensity of infection; however, the whole color code scale of the intensity of infection is based on all fields within the heatmap. Source data are provided in Additional file 1: Table S11
Fig. 6
Fig. 6
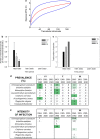
Dynamics of trematode assemblages associated with the Czech population of Vanellus vanellus. (a) The rarefaction curves (red line; 95% confidence intervals in blue) of component communities in V. vanellus calculated only for the first sampling period (1963–1980), as there were no species acquired in later time periods (1981–2000, 2001–2020). Dynamics of changes in the number of trematode species per host individual (b), the total number of trematode species found (c), and the prevalence (d) and the intensity of infection ± SE (e). The data for the prevalence and the intensity of infection are shown as a heatmap; the prevalence is shown as a percent of infected hosts, with the color green assigned to the highest prevalence of the respective trematode species and white assigned to zero prevalence. A similar color code of the heatmap was used to visualize the intensity of infection; however, the entire color code scale of the intensity of infection is based on all fields within the heatmap. Source data are provided in Additional file 1: Table S12
Fig. 7
Fig. 7
Overview of changes in the prevalence of previously dominant trematode species found in 2000 or earlier as compared to the period 2011–2020. The prevalence in the two respective time periods and the decline in prevalence of the respective dominant species are indicated. The prevalence is shown as a percent of infected hosts, with the color green assigned to the highest prevalence of the respective trematode species and white assigned to zero prevalence. All the observed declines in prevalence were found to be significant (χ2 test P < 0.001 each); the declines in trematodes of V. vanellus were not tested. Using the same logic, the figure shows the intensity of infection by the previously dominant trematode species in the two respective time periods and the change in the intensity of infection of the respective dominant species. The color code used follows similar logic as that for the prevalence. All the observed changes in the intensity of infection were tested by the Mann–Whitney rank-sum test, which revealed that only the differences in the intensity of infection by Lyperosomum petiolatum and Strigea strigis were significant (P < 0.05 each); the changes in the intensity of infection in V. vanellus were not tested

References

    1. Carlson J, Hopkins S, Bell KC, Doña J, Godfrey SS, Kwak ML, Lafferty KD, Moir ML, Speer KA, Strona G, Torchin M, Wood CL. A global parasite conservation plan. Biol Conserv. 2020;250:108596. doi: 10.1016/j.biocon.2020.108596. - DOI
    1. Dougherty ER, Carlson CJ, Bueno VM, Burgio KR, Cizauskas CA, Clements CF, Seidel DP, Harris NC. Paradigms for parasite conservation. Conserv Biol. 2016;30:724–733. doi: 10.1111/cobi.12634. - DOI - PubMed
    1. Costello MJ, May RM, Stork NE. Can we name Earths species before they go extinct? Science. 2013;339:413–416. doi: 10.1126/science.1230318. - DOI - PubMed
    1. Reif J, Voříšek P, Šťastný K, Bejček V, Petr J. Population increase of forest birds in the Czech Republic between 1982 and 2003. Bird Study. 2007;54:248–255. doi: 10.1080/00063650709461481. - DOI
    1. Reif J, Storch D, Voříšek P, Šťastný K, Bejček V. Bird-habitat associations predict population trends in central European forest and farmland birds. Biodiv Conserv. 2008;17:3307–3319. doi: 10.1007/s10531-008-9430-4. - DOI

LinkOut - more resources