Multicenter Study
. 2021 Aug;96(8):2081-2094.
doi: 10.1016/j.mayocp.2021.05.027.

Rapid Exclusion of COVID Infection With the Artificial Intelligence Electrocardiogram

Affiliations
Multicenter Study

Rapid Exclusion of COVID Infection With the Artificial Intelligence Electrocardiogram

Zachi I Attia et al. Mayo Clin Proc. 2021 Aug.

Abstract

Objective: To rapidly exclude severe acute respiratory syndrome coronavirus 2 (SARS-CoV-2) infection using artificial intelligence applied to the electrocardiogram (ECG).

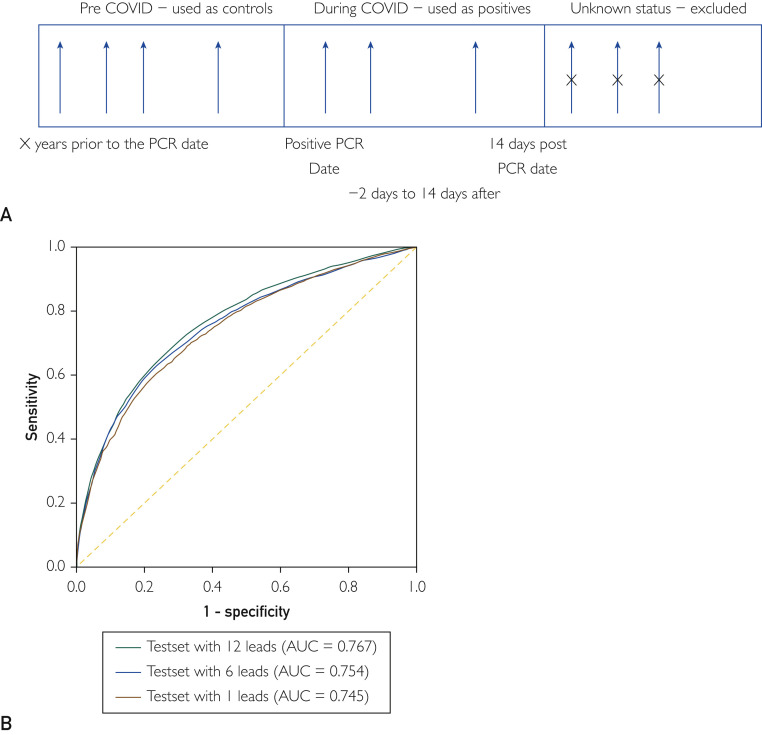
Methods: A global, volunteer consortium from 4 continents identified patients with ECGs obtained around the time of polymerase chain reaction-confirmed COVID-19 diagnosis and age- and sex-matched controls from the same sites. Clinical characteristics, polymerase chain reaction results, and raw electrocardiographic data were collected. A convolutional neural network was trained using 26,153 ECGs (33.2% COVID positive), validated with 3826 ECGs (33.3% positive), and tested on 7870 ECGs not included in other sets (32.7% positive). Performance under different prevalence values was tested by adding control ECGs from a single high-volume site.

Results: The area under the curve for detection of acute COVID-19 infection in the test group was 0.767 (95% CI, 0.756 to 0.778; sensitivity, 98%; specificity, 10%; positive predictive value, 37%; negative predictive value, 91%). To more accurately reflect a real-world population, 50,905 normal controls were added to adjust the COVID prevalence to approximately 5% (2657/58,555), resulting in an area under the curve of 0.780 (95% CI, 0.771 to 0.790) with a specificity of 12.1% and a negative predictive value of 99.2%.

Conclusion: Infection with SARS-CoV-2 results in electrocardiographic changes that permit the artificial intelligence-enhanced ECG to be used as a rapid screening test with a high negative predictive value (99.2%). This may permit the development of electrocardiography-based tools to rapidly screen individuals for pandemic control.


Figures

Figure 1
Figure 1
Geographic distribution of enrolling sites. Shown is the geographic distribution of sites contributing electrocardiograms.
Figure 2
Figure 2
A, Definition of control, index case electrocardiograms (ECGs), and postinfectious ECGs included in analysis. B, Receiver operating characteristic curves for detection of acute COVID-19 infection from a 12-lead, 6-lead, and 1-lead ECG. AUC, area under the curve; PCR, polymerase chain reaction.
Figure 3
Figure 3
A, Average network score among the general control population (control), prediagnosis electrocardiograms (ECGs) from patients with COVID-19 who had ECGs available from before their index COVID-19 diagnosis, and ECGs around the time of COVID-19 diagnosis. Presented are violin plots that indicate the relative proportion of patients composing the final mean and median for each group. B, Serial network scores over time (see text for details). Shown is the average network score for individual groups of patients who had multiple ECGs during follow-up (before index COVID-19 diagnosis and up to more than 2 months after). Presented are violin plots with superimposed box plots. The violin plots provide a visual of the density (relative frequency of values) over the range of the values observed, with the larger width indicating an increased frequency. The box plot shows the lower quartile, median, and upper quartile of the distribution.
Figure 4
Figure 4
Shown is the change in mean network score among electrocardiograms available for patients according to their World Health Organization (WHO) severity score. Higher severity scores were associated with a statistically significant higher detection score.

References

    1. Shang J., Wan Y., Luo C. Cell entry mechanisms of SARS-CoV-2. Proc Natl Acad Sci U S A. 2020;117(21):11727–11734. - PMC - PubMed
    1. Shang J., Ye G., Shi K. Structural basis of receptor recognition by SARS-CoV-2. Nature. 2020;581(7807):221–224. - PMC - PubMed
    1. Lan J., Ge J., Yu J. Structure of the SARS-CoV-2 spike receptor-binding domain bound to the ACE2 receptor. Nature. 2020;581(7807):215–220. - PubMed
    1. Alexander L.K., Keene B.W., Yount B.L., Geratz J.D., Small J.D., Baric R.S. ECG changes after rabbit coronavirus infection. J Electrocardiol. 1999;32(1):21–32. - PMC - PubMed
    1. Alexander L.K., Keene B.W., Baric R.S. Echocardiographic changes following rabbit coronavirus infection. Adv Exp Med Biol. 1995;380:113–115. - PubMed

Publication types