. 2022 Feb;93(2):158-168.
doi: 10.1136/jnnp-2021-326868. Epub 2021 Aug 5.

Comparison of clinical rating scales in genetic frontotemporal dementia within the GENFI cohort

Collaborators, Affiliations

Comparison of clinical rating scales in genetic frontotemporal dementia within the GENFI cohort

Georgia Peakman et al. J Neurol Neurosurg Psychiatry. 2022 Feb.

Abstract

Background: Therapeutic trials are now underway in genetic forms of frontotemporal dementia (FTD) but clinical outcome measures are limited. The two most commonly used measures, the Clinical Dementia Rating (CDR)+National Alzheimer's Disease Coordinating Center (NACC) Frontotemporal Lobar Degeneration (FTLD) and the FTD Rating Scale (FRS), have yet to be compared in detail in the genetic forms of FTD.

Methods: The CDR+NACC FTLD and FRS were assessed cross-sectionally in 725 consecutively recruited participants from the Genetic FTD Initiative: 457 mutation carriers (77 microtubule-associated protein tau (MAPT), 187 GRN, 193 C9orf72) and 268 family members without mutations (non-carrier control group). 231 mutation carriers (51 MAPT, 92 GRN, 88 C9orf72) and 145 non-carriers had available longitudinal data at a follow-up time point.

Results: Cross-sectionally, the mean FRS score was lower in all genetic groups compared with controls: GRN mutation carriers mean 83.4 (SD 27.0), MAPT mutation carriers 78.2 (28.8), C9orf72 mutation carriers 71.0 (34.0), controls 96.2 (7.7), p<0.001 for all comparisons, while the mean CDR+NACC FTLD Sum of Boxes was significantly higher in all genetic groups: GRN mutation carriers mean 2.6 (5.2), MAPT mutation carriers 3.2 (5.6), C9orf72 mutation carriers 4.2 (6.2), controls 0.2 (0.6), p<0.001 for all comparisons. Mean FRS score decreased and CDR+NACC FTLD Sum of Boxes increased with increasing disease severity within each individual genetic group. FRS and CDR+NACC FTLD Sum of Boxes scores were strongly negatively correlated across all mutation carriers (rs=-0.77, p<0.001) and within each genetic group (rs=-0.67 to -0.81, p<0.001 in each group). Nonetheless, discrepancies in disease staging were seen between the scales, and with each scale and clinician-judged symptomatic status. Longitudinally, annualised change in both FRS and CDR+NACC FTLD Sum of Boxes scores initially increased with disease severity level before decreasing in those with the most severe disease: controls -0.1 (6.0) for FRS, -0.1 (0.4) for CDR+NACC FTLD Sum of Boxes, asymptomatic mutation carriers -0.5 (8.2), 0.2 (0.9), prodromal disease -2.3 (9.9), 0.6 (2.7), mild disease -10.2 (18.6), 3.0 (4.1), moderate disease -9.6 (16.6), 4.4 (4.0), severe disease -2.7 (8.3), 1.7 (3.3). Sample sizes were calculated for a trial of prodromal mutation carriers: over 180 participants per arm would be needed to detect a moderate sized effect (30%) for both outcome measures, with sample sizes lower for the FRS.

Conclusions: Both the FRS and CDR+NACC FTLD measure disease severity in genetic FTD mutation carriers throughout the timeline of their disease, although the FRS may be preferable as an outcome measure. However, neither address a number of key symptoms in the FTD spectrum, for example, motor and neuropsychiatric deficits, which future scales will need to incorporate.

Keywords: frontotemporal dementia.


Conflict of interest statement

Competing interests: None declared.

Figures
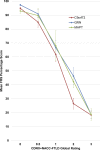
Figure 1
Figure 1
Mean FRS percentage score according to CDR+NACC FTLD global rating in mutation carriers at baseline. Error bars represent SE of the mean. CDR+NACC FTLD global ratings: GRN 0, N=114; 0.5, N=25; 1, N=19; 2, N=15; 3, N=14; MAPT 0, N=42; 0.5, N=13; 1, N=7; 2, N=8; 3, N=7; C9orf72 0, N=92; 0.5, N=32; 1, N=18; 2, N=26; 3, N=25. CDR, Clinical Dementia Rating; FRS, Frontotemporal dementia Rating Scale; NACC, National Alzheimer’s Disease Coordinating Center.
Figure 2
Figure 2
Scatter plot of FRS percentage scores and CDR+NACC FTLD sum of boxes scores in all mutation carriers at baseline. CDR, Clinical Dementia Rating; FRS, Frontotemporal dementia Rating Scale; NACC, National Alzheimer’s Disease Coordinating Center.
Figure 3
Figure 3
Bar graph and Sankey diagram presenting proportions of participants in each FRS severity category according to CDR+NACC FTLD global rating, in all mutation carriers at baseline. CDR+NACC FTLD global rating 0, N=248; 0.5, N=70; 1, N=44; 2, N=49; 3, N=46. CDR, Clinical Dementia Rating; FRS, Frontotemporal dementia Rating Scale; NACC, National Alzheimer’s Disease Coordinating Center.
Figure 4
Figure 4
(A) Frequencies of CDR+NACC FTLD domains affected (rating ≥0.5) within each FRS severity category, in mutation carriers and non-carrier controls at baseline. FRS severity categories: controls: asymptomatic, N=165; very mild, N=29; mild, N=63; moderate, N=11; severe, N=0; very severe, N=0; profound, N=0; mutation carriers: asymptomatic, N=175; very mild, N=33; mild, N=101; moderate, N=60; severe, N=63; very severe, N=23; profound, N=2. Note that very severe and profound groups were combined for the mutation carriers due to limited cases in the profound group. (B) Mean scores on CDR+NACC FTLD domains within each FRS severity category, in mutation carriers and in non-carrier controls at baseline. Error bars represent SE of the mean. domains are rated using scores of 0 (absent), 0.5 (questionable/very mild), 1 (mild), 2 (moderate) and 3 (severe). CDR, Clinical Dementia Rating; FRS, Frontotemporal dementia Rating Scale; NACC, National Alzheimer’s Disease Coordinating Center.
Figure 5
Figure 5
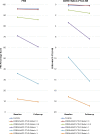
Annualised change in FRS percentage score and CDR+NACC FTLD sum of boxes score in mutation carriers according to baseline CDR+NACC FTLD global rating and controls. Baseline values=mean score, follow-up values=(baseline mean score)+(mean annualised change in score). Controls N=145; carriers N=232 (baseline CDR+NACC FTLD global 0, N=140; 0.5, N=30; 1, N=22; 2, N=23; 3, N=16). CDR, Clinical Dementia Rating; FRS, Frontotemporal dementia Rating Scale; NACC, National Alzheimer’s Disease Coordinating Center.

References

    1. Rohrer JD, Guerreiro R, Vandrovcova J, et al. . The heritability and genetics of frontotemporal lobar degeneration. Neurology 2009;73:1451–6. 10.1212/WNL.0b013e3181bf997a - DOI - PMC - PubMed
    1. Wood EM, Falcone D, Suh E, et al. . Development and validation of pedigree classification criteria for frontotemporal lobar degeneration. JAMA Neurol 2013;70:1411. 10.1001/jamaneurol.2013.3956 - DOI - PMC - PubMed
    1. Warren JD, Rohrer JD, Rossor MN. Clinical review. frontotemporal dementia. BMJ 2013;347:f4827. 10.1136/bmj.f4827 - DOI - PMC - PubMed
    1. DeJesus-Hernandez M, Mackenzie IR, Boeve BF, et al. . Expanded GGGGCC hexanucleotide repeat in noncoding region of C9orf72 causes chromosome 9p-linked FTD and ALS. Neuron 2011;72:245–56. 10.1016/j.neuron.2011.09.011 - DOI - PMC - PubMed
    1. Baker M, Mackenzie IR, Pickering-Brown SM, et al. . Mutations in progranulin cause tau-negative frontotemporal dementia linked to chromosome 17. Nature 2006;442:916–9. 10.1038/nature05016 - DOI - PubMed

Publication types