. 2021 Aug 5;12(1):4730.
doi: 10.1038/s41467-021-24775-5.

Microfluidic device with brain extracellular matrix promotes structural and functional maturation of human brain organoids

Affiliations

Microfluidic device with brain extracellular matrix promotes structural and functional maturation of human brain organoids

Ann-Na Cho et al. Nat Commun. .

Abstract

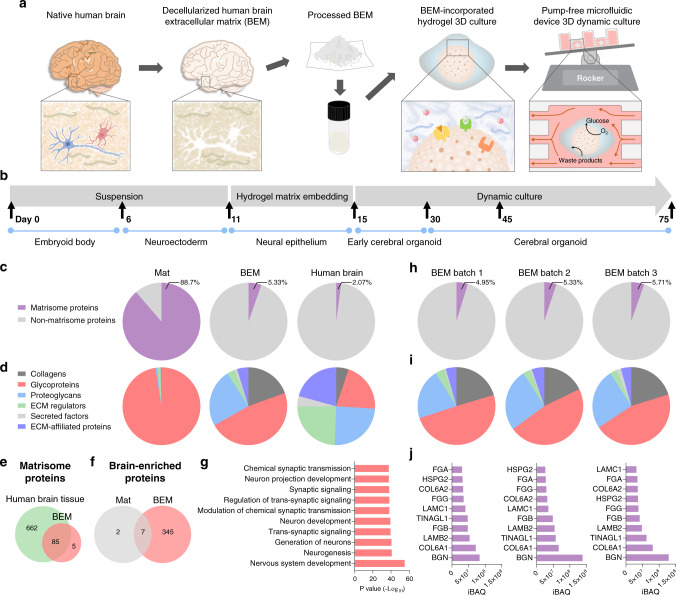
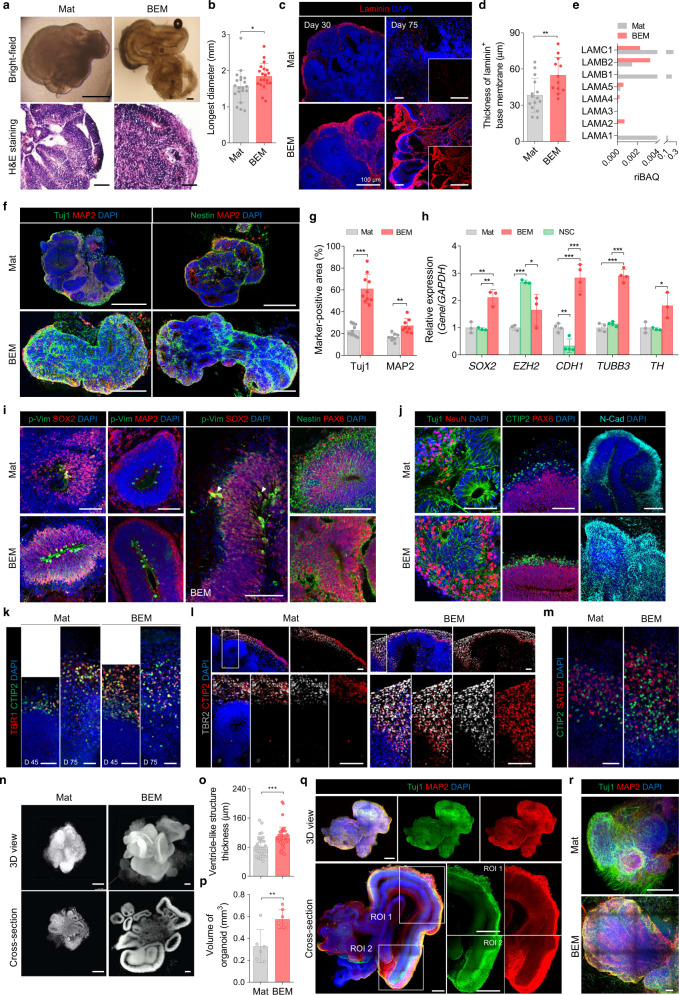
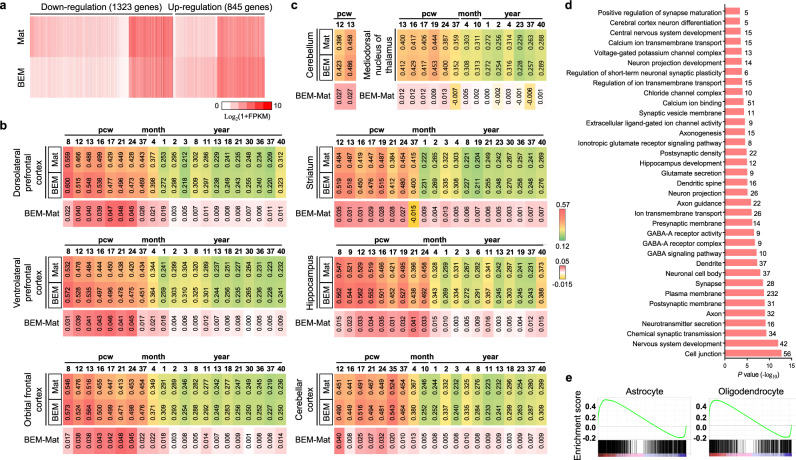
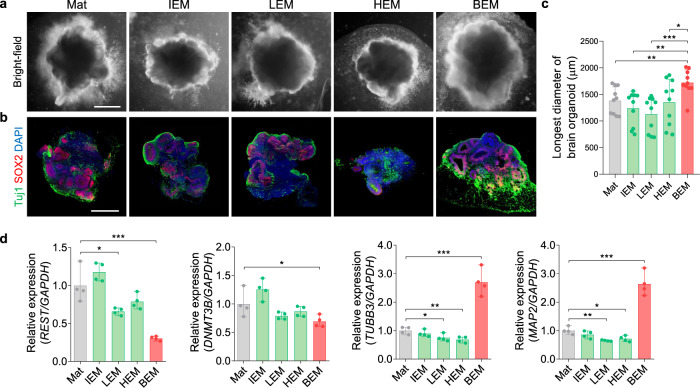
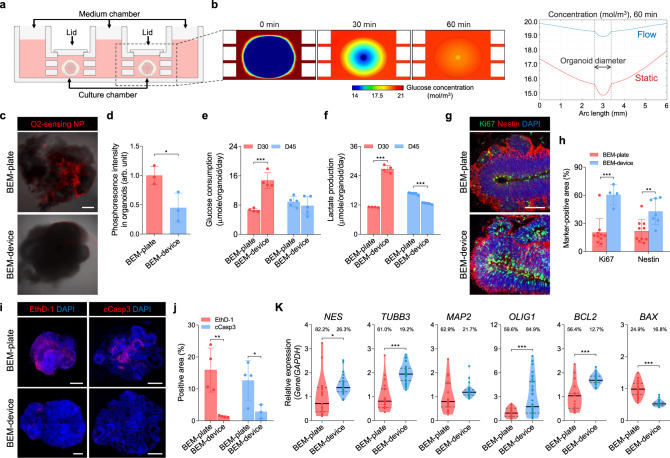
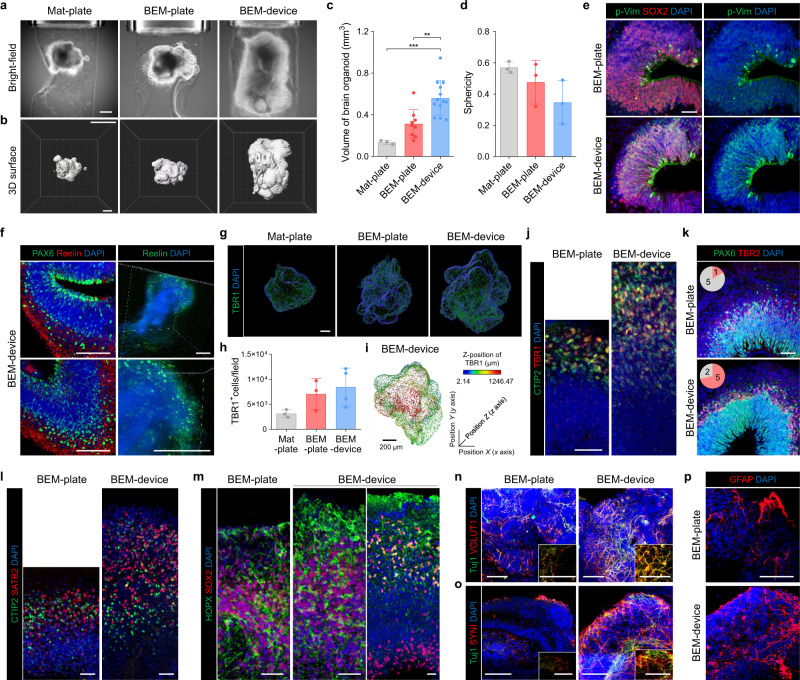
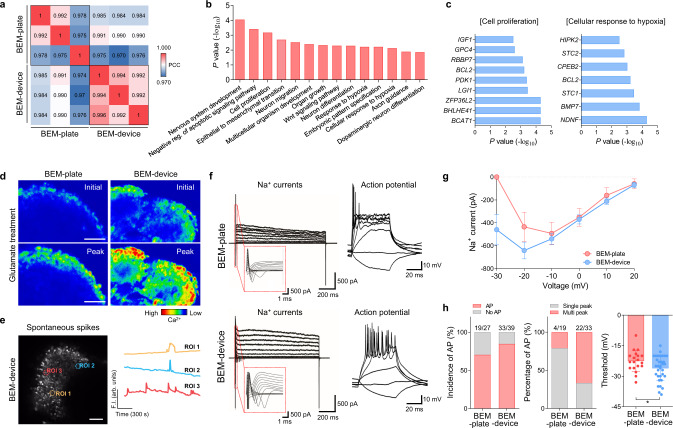
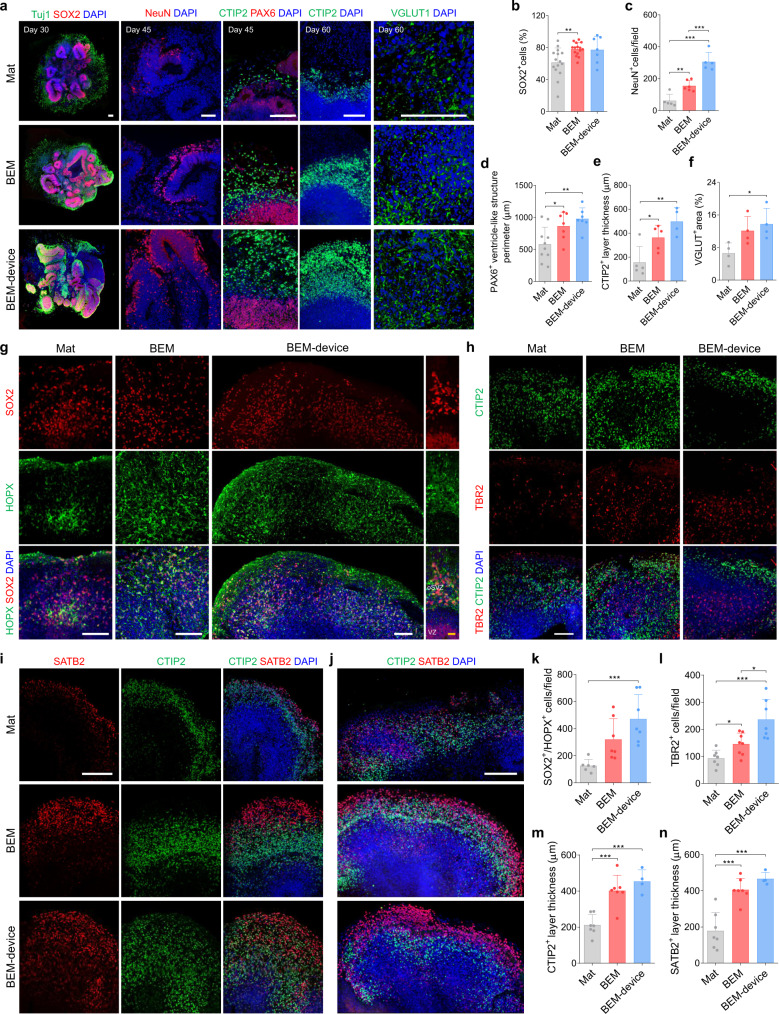
Brain organoids derived from human pluripotent stem cells provide a highly valuable in vitro model to recapitulate human brain development and neurological diseases. However, the current systems for brain organoid culture require further improvement for the reliable production of high-quality organoids. Here, we demonstrate two engineering elements to improve human brain organoid culture, (1) a human brain extracellular matrix to provide brain-specific cues and (2) a microfluidic device with periodic flow to improve the survival and reduce the variability of organoids. A three-dimensional culture modified with brain extracellular matrix significantly enhanced neurogenesis in developing brain organoids from human induced pluripotent stem cells. Cortical layer development, volumetric augmentation, and electrophysiological function of human brain organoids were further improved in a reproducible manner by dynamic culture in microfluidic chamber devices. Our engineering concept of reconstituting brain-mimetic microenvironments facilitates the development of a reliable culture platform for brain organoids, enabling effective modeling and drug development for human brain diseases.


Conflict of interest statement

S.W.C., A.N.C., Y.J., and J.S.L. are co-inventors on patent applications (Korean Patent 10-2021-0037583, US patent 16/448,954, and EP patent 19181495.3) related to decellularized brain matrix for brain organoid culture. The remaining authors declare no competing interests.

Figures

Fig. 1
Fig. 1. Characterization of decellularized human brain-derived extracellular matrix (BEM).
a Schematic illustration of the cerebral organoid culture system with a combination of 3D BEM hydrogel culture and the microfluidic device. b Schematic of the culture protocol for generating cerebral organoids from human induced pluripotent stem cells (iPSCs) using a brain-mimetic culture system. The developmental stage of organoids is shown at the bottom, the timeline for each developmental stage is shown in the middle, and the culture condition is shown at the top. cj Proteomic analysis for the identification of extracellular matrix (ECM) components in human BEM. The percentages of (c) matrisome proteins out of total proteins, and (d) the subtypes of matrisome proteins identified in BEM, Matrigel (Mat), and human brain tissue (n = 1 for Mat, n = 3 for BEM). e Total numbers of matrisome proteins detected in the human brain tissue and BEM. f The number of the brain-enriched proteins by at least 4-fold compared to other organs. g The top 10 biological process terms ordered by p value after gene ontology enrichment analysis of brain-enriched proteins exclusively present in BEM, which are not detected in Mat. The compositions of (h) matrisome proteins relative to total proteins and (i) the subtypes of matrisome proteins in three batches of BEM (biological replicates = 3). j Most abundant matrisome proteins found in each batch of BEM. Source data are provided as a Source Data file.
Fig. 2
Fig. 2. BEM improves neurogenesis and organization of cortical layers in cerebral organoids.
a Bright-field images and hematoxylin and eosin (H&E) staining of Mat- and BEM-embedded brain organoids at day 30 (scale bars = 500 μm for bright-field and 100 μm for H&E staining images, independent replicates = 3). b Quantification of the longest diameter of Mat and BEM organoids based on the bright-field images of whole organoids (n = 20, Mat versus BEM p = 0.0349, independent replicates = 3). c Laminin staining of Mat and BEM organoids at 30 and 75 days (scale bars = 100 μm), and (d) quantification of the thickness of laminin+ basement membrane covering the outer surface of the organoids at day 30 (n = 15 for Mat and n = 12 for BEM, Mat versus BEM p = 0.0066, independent replicates = 5). e Comparison of relative intensity-based absolute quantification (riBAQ) values of laminin subtypes identified in Mat and BEM. f Immunohistochemical staining of neural progenitor marker (Nestin) and neuronal markers (Tuj1 and MAP2) at 30 days of culture (scale bars = 500 μm, independent replicates = 1–4). g Image-based quantification of the Tuj1- and MAP2-positive area in the Mat and BEM organoids at day 30 (n = 10 for Tuj1 and n = 15 for MAP2, Mat versus BEM p < 0.0001 for Tuj1; Mat versus BEM p = 0.0012 for MAP2, independent replicates = 2–7). h The quantitative real-time polymerase chain reaction (qPCR) analysis to compare gene expression between Mat, neural stem cells (NSCs), and BEM organoids at day 30 (n = 3 for SOX2, EZH2, and TH and n = 4 for CDH1 and TUBB3, 10–15 brain organoids collected as one sample batch, Mat versus BEM p = 0.0061, NSC versus BEM p = 0.0027 for SOX2; Mat versus NSC p < 0.0001, NSC versus BEM p = 0.0371 for EZH2; Mat versus BEM p = 0.0004, Mat versus NSC p = 0.0039, NSC versus BEM p = 0.0001 for CDH1; Mat versus BEM p < 0.0001, NSC versus BEM p < 0.0001 for TUBB3; NSC versus BEM p = 0.0346 for TH, independent replicates = 3). i Immunohistochemical staining for mitotic radial glia marker phosphorylated vimentin (p-Vim), SOX2, Nestin, and PAX6, and neuron marker MAP2 in Mat and BEM organoids at day 30 (scale bars = 100 μm, independent replicates = 6). Note that some p-Vim+/SOX2+ cells are located above the apical domain (white arrowheads). j Immunohistochemical staining for Tuj1 and NeuN at day 30, CTIP2 and PAX6, and N-cadherin (N-Cad) at day 45 in Mat and BEM organoids (scale bars = 100 μm, independent replicates = 2–5). k Immunohistochemical stained images for deep-layer neuron markers TBR1 and CTIP2 at 45 and 75 days (scale bars = 50 μm, independent replicate = 1). Immunostaining images for (l) intermediate progenitor marker TBR2 and CTIP2 and (m) superficial-layer neuron marker SATB2 and CTIP2 in 75-day organoids (scale bars = 50 μm, independent replicate = 1). n Nucleus-stained (Cyto16) light-sheet microscopic images of Mat and BEM organoids at day 75 (scale bars = 500 μm, independent replicates = 5). Quantification of (o) the thickness of ventricle-like structures (n = 30 for Mat and n = 45 for BEM, Mat versus BEM p = 0.0007) and (p) the total organoid volume (n = 6 for Mat and n = 9 for BEM, Mat versus BEM p = 0.0035) based on nucleus-stained (Cyto16) light-sheet microscopic images of Mat and BEM organoids at day 75 (independent replicates = 5). q 3D reconstituted images of 30-day BEM organoids obtained by tissue clearing and subsequent immunostaining for Tuj1 and MAP2 (scale bars = 1 mm, independent replicate = 1). r 3D images of Mat and BEM organoids stained for Tuj1 and MAP2 after tissue clearing at day 75 (scale bars = 200 μm, independent replicates = 3–5). Mat and BEM organoids were cultured in a dish on an orbital shaker. All data are expressed as mean ± standard deviation (SD). Statistical differences between the groups were determined with a two-sided t-test (*p < 0.05, **p < 0.01, ***p < 0.001). Source data are provided as a Source Data file.
Fig. 3
Fig. 3. The genome-wide transcriptome analysis of 75-day brain organoids.
a Heatmap showing the expression of differentially expressed genes (DEG) between Mat and BEM organoids (n = 3 per group, independent replicate = 1). b, c Heatmaps of Pearson’s correlation analysis of RNA-sequencing datasets of the Mat and BEM organoids for comparison with published transcriptome datasets of (b) three different human frontal regions across different stages and (c) five different regions of the brain at fetal and postnatal stages. Values in the heatmaps of Mat and BEM groups dictate Pearson’s correlation coefficients (PCC). Values in the heatmaps of BEM-Mat indicate the differences in PCC between BEM and Mat groups. d The 35 enriched gene ontology (GO) terms of upregulated genes in BEM organoids versus Mat organoids (shown in terms of p-values). Numbers on the right-hand side of the bar indicate the number of DEGs within the GO terms. e The gene set enrichment analysis (GSEA) of the astrocyte and oligodendrocyte probe sets in the BEM group versus the Mat group. Mat and BEM organoids were cultured in a dish on an orbital shaker. Source data are provided as a Source Data file.
Fig. 4
Fig. 4. The tissue-specific effects of 3D ECM hydrogels on brain organoid development.
a Bright-field images of brain organoids encapsulated in ECM hydrogels derived from different decellularized organs [brain (BEM), intestine (IEM), liver (LEM), and heart (HEM)] at day 30 (scale bars = 500 μm). b Immunostaining of brain organoids on day 30 for Tuj1 and SOX2 (scale bars = 500 μm). c Image-based quantification of the longest diameter of brain organoid at day 30 (n = 10 per group, BEM versus Mat p = 0.0069, BEM versus IEM p = 0.0013, BEM versus LEM p = 0.0002, BEM versus HEM p = 0.0301). d The gene expression analysis of brain organoids at day 30 by qPCR for transcriptional factors (REST, DNMT3B) and neuronal markers (TUBB3, MAP2) (n = 4 per group, Mat versus LEM p = 0.025, Mat versus BEM p = 0.0009 for REST; Mat versus BEM p = 0.0498 for DNMT3B; Mat versus LEM p = 0.031, Mat versus HEM p = 0.0085, Mat versus BEM p = 0.0004 for TUBB3; Mat versus LEM p = 0.0017, Mat versus HEM p = 0.0128, Mat versus BEM p = 0.0003 for MAP2). Mat and BEM organoids were cultured in a dish on an orbital shaker. All quantitative data are expressed as mean ± SD. Statistical differences between the groups were determined by unpaired two-tailed t-test (*p < 0.05, **p < 0.01, ***p < 0.001). Independent replicates for all data in (ad) = 4. Source data are provided as a Source Data file.
Fig. 5
Fig. 5. Microfluidic dynamic culture supports the proliferation and prevents the apoptosis of brain organoids grown in the 3D BEM.
a Schematic diagram of the microfluidic device for the brain organoid culture. b Computational simulation of glucose concentration within the brain organoid and its surroundings in a culture chamber under the fluid flow conditions (left). Comparison of glucose concentration within the brain organoid in the presence and absence of fluid flow (right). c Representative merged images showing organoids (gray) and phosphorescence of oxygen-sensing (PtTFPP-PUAN) nanoparticles at 754 nm (red) for BEM-plate (top) and BEM-device (bottom) organoids on day 30 (scale bars = 200 μm, independent replicates = 4). d The normalized mean phosphorescence intensity in BEM-plate and BEM-device organoids (n = 3 per group, BEM-plate versus BEM-device p = 0.032, independent replicates = 4). Measurement of (e) glucose level in organoids and (f) lactate level in the medium at days 30 and 45 (n = 4 for D30 and n = 5 for D45, BEM-plate versus BEM-device p < 0.0001 at D30 and p < 0.0001 at D45, independent replicates = 2 for day 30 and 1 for day 45). g Immunostaining for the proliferation marker Ki67 and the progenitor marker Nestin in the BEM-plate and BEM-device organoids (scale bars = 50 μm, independent replicates = 3). h The quantification analyses of Ki67+ and Nestin+ cells in the BEM-plate and BEM-device organoids (n = 10 for BEM-plate group, and n = 4 for Ki67+ and n = 7 for Nestin+ in BEM-device group, BEM-plate versus BEM-device p = 0.0004 for Ki67 and p = 0.005 for Nestin, independent replicates = 3). i Brain organoids stained with ethidium homodimer-1 (EthD-1) to label dead cells at day 30 and cleaved caspase-3 (cCasp3) at day 45 (scale bars = 500 μm). j Quantification of EthD-1+ and cCasp3+ area per organoid (n = 4 for BEM-plate group, n = 4 for EthD-1+ and n = 3 for cCasp3+ in BEM-device group, BEM-plate versus BEM-device p = 0.0056 for EthD-1 and p = 0.049 for cCasp3, independent replicates = 3). k Differential gene expression analyses by qPCR with BEM-plate and BEM-device organoids. One sample was prepared from a single organoid. The coefficient of variations is dictated above the bars for each group. Data are expressed as violin plots. Dark gray dashed lines and black lines indicate 25–75% quartiles and median, respectively (n = 19 for BEM-plate group and n = 30 for BEM-device group in all markers except for OLIG1, n = 29 for BEM-plate group and n = 35 for BEM-device group in OLIG1, BEM-plate versus BEM-device p = 0.0102 for NES, p < 0.0001 for TUBB3, p = 0.0001 for OLIG1, p < 0.0001 for BCL2, and p < 0.0001 for BAX, independent replicates = 4). All analyses were performed over 30 days in the culture. All data are expressed as mean ± SD, otherwise stated separately. Statistical differences between the groups were determined by unpaired two-tailed t-test (*p < 0.05, **p < 0.01, ***p < 0.001 versus BEM-plate group). Source data are provided as a Source Data file.
Fig. 6
Fig. 6. Bioengineering of the brain organoids by the microfluidic BEM system improves radial glial generation and cortical organization.
a Light-sheet microscopic bright-field images of 3D brain organoids encapsulated in Mat and BEM cultured in a plate or microfluidic device at 60 days of culture (scale bar = 500 μm, independent replicates = 3). b Reconstructed light-sheet microscopic images of 60-day Mat-plate, BEM-plate, and BEM-device organoids (scale bar = 500 μm, independent replicates = 3). c Quantification analyses for the 3D organoid volume (n = 3, 9, and 13 for Mat-plate, BEM-plate, and BEM-device groups, respectively, Mat-plate versus BEM-device p = 0.0007, BEM-plate versus BEM-device p = 0.0014, independent replicates = 3), and (d) sphericity (n = 3 per group, independent replicates = 3) of brain organoids using IMARIS software. e Representative immunostaining images for mitotic radial glia marker phosphorylated vimentin (p-Vim) and SOX2 in the BEM-plate and BEM-device organoids at day 30 (scale bar = 50 μm, independent replicates = 5). f Expression of the radial glial marker PAX6 and extracellular glycoprotein marker Reelin in BEM-device organoids (left panel, scale bars = 200 μm, independent replicates = 2) and 3D imaging of Reelin expression in BEM-device organoids at day 30 (right panel, scale bars = 200 μm, technical replicates = 5). g 3D plotting and (h) quantification of deep-layer marker TBR1-expressing cells in Mat-plate, BEM-plate, and BEM-device organoids at day 30 using IMARIS software (n = 3 for Mat-plate and BEM-plate groups, and n = 4 for BEM-device group, independent replicates = 3). i 3D plotting analysis of TBR1+ cells in BEM-device organoids on different z-positions in the radiometric color spectrum (scale bar = 200 μm, biological replicates = 3). j Immunohistochemically stained sections for TBR1 and CTIP2 at day 45 (scale bar = 50 μm, independent replicate = 1). k Immunohistochemical staining images for subventricular marker TBR2 and PAX6 at day 45 (scale bar = 50 μm, independent replicates = 2). Pink color in the pie-charts indicates the number of cortical structures with separated layers of TBR2+ and PAX6+ cells, and grey color indicates no layer preferences. l Immunostaining images showing CTIP2 and superficial-layer neuron marker SATB2 (scale bars = 50 μm, independent replicate = 1), and (m) basal radial glia marker SOX2 and HOPX at day 75 (scale bars = 50 μm, independent replicate = 1). n Immunostaining of Tuj1 and glutamatergic neuron marker VGLUT1 (independent replicates = 2), (o) presynaptic marker SYNI (independent replicates = 2), and (p) astrocyte marker GFAP in the BEM-plate and BEM-device organoids at day 60 (scale bars = 100 μm, independent replicates = 3). All data are presented as mean ± SD. Statistical differences between the groups were determined with unpaired two-tailed t-test (**p < 0.01, ***p < 0.001). Source data are provided as a Source Data file.
Fig. 7
Fig. 7. The transcriptome profile analyses and electrophysiological function characterization of brain organoids cultured in the microfluidic BEM system.
a Pearson’s correlation matrix for whole-genome profiles in BEM-plate and BEM-device organoids (n = 3, independent replicate = 1). Pearson’s correlation coefficient (PCC) values are indicated in each box. b The top 14 enriched gene ontology (GO) terms of upregulated genes in the BEM-device group versus the BEM-plate group (shown in terms of p values). c Lists of differentially upregulated genes classified in two GO functional categories; ‘Cellular response to hypoxia’ and ‘Cell proliferation’. d Ratiometric images of calcium imaging before and after 100 μM glutamate treatment in Fluo-4 AM-loaded BEM-plate and BEM-device organoids (scale bars = 50 μm, independent replicates = 4). The color scale indicates fluorescence intensity of Fluo-4 AM. e A fluorescence image showing spontaneous calcium (Ca2+) transient of cells in BEM-device organoids (left) (scale bar = 100 μm, independent replicates = 3). Representative time-course peaks showing spontaneous changes in Fluo-4 AM fluorescence intensity measured in cells in the BEM-device organoid (right). Traces were obtained from the region of intensity (ROI) marked on the fluorescence image. f Representative current traces recorded in a neuron with a voltage-clamp mode (left two panels) and representative traces of evoked action potentials (APs) recorded in a neuron with a current-clamp mode (right two panels) in brain organoids grown in either a BEM-plate (top panels) or a BEM-device (bottom panels). g Quantification of sodium (Na+) currents in response to increased voltage steps starting from −30 mV to +20 mV (10 mV step size) in neurons within brain organoids grown in either a BEM-plate or a BEM-device (n = 5). h Quantification of AP incidence (BEM-plate: n = 27; BEM-device: n = 39, independent replicates = 7), spike numbers (single versus multiple) in each condition, and threshold potentials to evoke AP (BEM-plate: n = 19; BEM-device: n = 33, unpaired two-tailed t-test (*p < 0.05), BEM-plate versus BEM-device p = 0.0380). Brain organoids cultured for (ae) 75 days and (fh) 60 days were analyzed. All data are expressed as mean ± SD. Source data are provided as a Source Data file.
Fig. 8
Fig. 8. Combination of BEM and microfluidic device reproducibly improves organization of progenitor zones and cortical layers in brain organoids.
a Immunostaining of Tuj1 and SOX2 (day 30), NeuN, PAX6, and CTIP2 (day 45), CTIP2 and VGLUT1 (day 60) in Mat, BEM, and BEM-device organoid groups (scale bars = 100 μm, independent replicates = 2). Quantification of (b) SOX2+ cells at day 30 (n = 15 for Mat and BEM groups and n = 7 for BEM-device group, Mat versus BEM p = 0.003, independent replicates = 3), (c) NeuN+ cells at day 45 (n = 5 for Mat and BEM-device groups and n = 6 for BEM group, Mat versus BEM p = 0.0022, Mat versus BEM-device p < 0.0001, BEM versus BEM-device p = 0.0004, independent replicates = 2), (d) PAX6+ ventricle-like structure perimeter at day 45 (n = 10 for Mat group, and n = 7 for BEM and BEM-device groups, Mat versus BEM p = 0.0357, Mat versus BEM-device p = 0.0036, independent replicates = 2), (e) CTIP2+ layer thickness at day 60 (n = 5 for Mat and BEM groups, and n = 4 for BEM-device group, Mat versus BEM p = 0.0243, Mat versus BEM-device p = 0.0047, independent replicates = 2), and (f) VGLUT+ cell area at day 60 (n = 4, Mat versus BEM-device p = 0.0258, independent replicates = 2). g Immunostaining of basal radial glia markers SOX2 and HOPX at day 100 (scale bars = 100 μm for white line and 20 μm for yellow line, independent replicates = 2). Note the SOX2+/HOPX+ outer subventricular (SVZ) region clearly separated from the SOX2+/HOPX- ventricular zone (VZ)-like region in BEM-device organoid. Immunostaining of (h) SVZ marker TBR2 and deep-layer marker CTIP2 at day 100 (scale bar = 100 μm, independent replicates = 2), and (i, j) upper-layer marker SATB2 and CTIP2 at (i) day 100 (scale bar = 200 μm, independent replicates = 2) and (j) day 120 (scale bar = 200 μm, independent replicates = 2) in Mat and BEM organoids cultured in the petri dish on the orbital shaker, and BEM-device organoids cultured in the microfluidic device on the bi-directional rocker. Quantification of (k) SOX2+/HOPX+ cells (n = 6 for Mat group, and n = 7 for BEM and BEM-device groups, Mat versus BEM-device p = 0.0008, independent replicates = 2), l TBR2+ intermediate progenitor cells (n = 7 for Mat and BEM-device groups, and n = 8 for BEM group), Mat versus BEM p = 0.0147, Mat versus BEM-device p = 0.0005, BEM versus BEM-device p = 0.0101, independent replicates = 2), (m) the thickness of CTIP2+ deep-layer neurons at day 100 (n = 7 for Mat and BEM groups, and n = 4 for BEM-device group, Mat versus BEM p = 0.0004, Mat versus BEM-device p = 0.0001, independent replicates = 2), and (n) the thickness of SATB2+ superficial-layer neurons at day 100 (n = 7 for Mat and BEM groups, and n = 4 for BEM-device group, Mat versus BEM p = 0.0003, Mat versus BEM-device p = 0.0004, independent replicates = 2). All data are presented as mean ± SD. Statistical differences between the groups were determined with unpaired two-tailed t-test (*p < 0.05, **p < 0.01, and ***p < 0.001). Source data are provided as a Source Data file.

References

    1. Di Lullo E, Kriegstein AR. The use of brain organoids to investigate neural development and disease. Nat. Rev. Neurosci. 2017;18:573. doi: 10.1038/nrn.2017.107. - DOI - PMC - PubMed
    1. Eiraku M, et al. Self-organized formation of polarized cortical tissues from ESCs and its active manipulation by extrinsic signals. Cell Stem Cell. 2008;3:519–532. doi: 10.1016/j.stem.2008.09.002. - DOI - PubMed
    1. Lancaster MA, et al. Cerebral organoids model human brain development and microcephaly. Nature. 2013;501:373–379. doi: 10.1038/nature12517. - DOI - PMC - PubMed
    1. Lancaster MA, Knoblich JA. Generation of cerebral organoids from human pluripotent stem cells. Nat. Protoc. 2014;9:2329–2340. doi: 10.1038/nprot.2014.158. - DOI - PMC - PubMed
    1. Camp JG, et al. Human cerebral organoids recapitulate gene expression programs of fetal neocortex development. Proc. Natl Acad. Sci. U. S. A. 2015;112:15672–15677. doi: 10.1073/pnas.1520760112. - DOI - PMC - PubMed

Publication types

MeSH terms