. 2021 Aug 5;11(1):15940.
doi: 10.1038/s41598-021-95380-1.

Restricted differentiative capacity of Wt1-expressing peritoneal mesothelium in postnatal and adult mice

Affiliations

Restricted differentiative capacity of Wt1-expressing peritoneal mesothelium in postnatal and adult mice

Thomas P Wilm et al. Sci Rep. .

Abstract

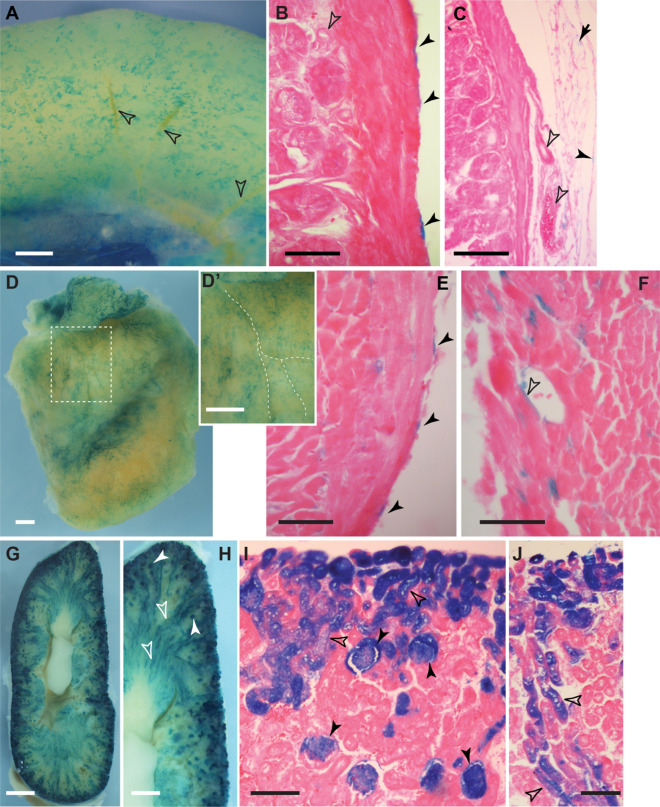
Previously, genetic lineage tracing based on the mesothelial marker Wt1, appeared to show that peritoneal mesothelial cells have a range of differentiative capacities and are the direct progenitors of vascular smooth muscle in the intestine. However, it was not clear whether this was a temporally limited process or continued throughout postnatal life. Here, using a conditional Wt1-based genetic lineage tracing approach, we demonstrate that the postnatal and adult peritoneum covering intestine, mesentery and body wall only maintained itself and failed to contribute to other visceral tissues. Pulse-chase experiments of up to 6 months revealed that Wt1-expressing cells remained confined to the peritoneum and failed to differentiate into cellular components of blood vessels or other tissues underlying the peritoneum. Our data confirmed that the Wt1-lineage system also labelled submesothelial cells. Ablation of Wt1 in adult mice did not result in changes to the intestinal wall architecture. In the heart, we observed that Wt1-expressing cells maintained the epicardium and contributed to coronary vessels in newborn and adult mice. Our results demonstrate that Wt1-expressing cells in the peritoneum have limited differentiation capacities, and that contribution of Wt1-expressing cells to cardiac vasculature is based on organ-specific mechanisms.


Conflict of interest statement

The authors declare no competing interests.

Figures

Figure 1
Figure 1
Whole mount and frozen section analysis of adult intestine after lineage tracing of Wt1-expressing cells. Adult mice with either the Wt1CreERT2/+; Rosa26LacZ/LacZ (A,A′) or the Wt1CreERT2/+; Rosa26mTmG/mTmG (B,B′,C,D) reporter system were analysed 2–4 weeks after tamoxifen administration. (A,B) Labelled cells were found on the surface of the intestine and in the mesentery (M) in a random and patchy distribution, but no contribution of labelled cells to the vascular or visceral smooth muscle of the intestine or mesentery was observed (open arrowheads; A′,B′, magnifications of highlighted areas). (C,D) Immunofluorescence labelling of frozen sections from Wt1CreERT2/+; Rosa26mTmG/mTmG intestine. Wt1-lineage traced cells were solely identified in the mesothelium (filled arrowheads; open arrowheads pointing to vascular tissue labelled with endothelial CD31 and α-smooth muscle actin (SMA) antibodies). The data shown are consistent with analyses performed in n = 10 animals for (A) and (BD). Scale bars, 1 mm (A,B), 200 µm (A′,B′), 50 µm (C,D).
Figure 2
Figure 2
Wt1-based lineage tracing revealed GFP-positive mesenchymal cells in parietal and visceral peritoneum. Adult mice with the Wt1CreERT2/+; Rosa26mTmG/mTmG reporter system were analysed 2–4 weeks after tamoxifen administration. (A,A′) In the parietal peritoneum of the body wall, GFP-positive mesothelial cells were detected in single and clustered patterns. GFP-positive mesenchymal cells were found in areas without GFP-positive mesothelial cells (solid arrow heads) as well as close to or underneath GFP-positive mesothelial clusters (transparent arrow heads). (B,B′) Partial projections of a 0.5 µm distanced 35 focal level Z-stack; levels 4–9 (B) show a cluster of GFP-positive mesothelial cells and levels 22–33 (B′) three GFP-positive individual mesenchymal cells located underneath the mesothelial layer. (C,D) GFP-positive mesenchymal cells (arrowheads) scattered between GFP+ mesothelial cells in the visceral peritoneum of the mesentery (C) and the omentum (D). (E,F) Flow cytometry analysis of intestine and peritoneum in adult Wt1CreERT2/+; Rosa26mTmG/mTmG mice 4 months after tamoxifen dosing. The left dot plot illustrates cells unlabelled for Pdgfrα, while the right plot shows cells after immunolabelling for Pdgfrα (E,F). In both intestine and peritoneum there is a clear but discreet population of GFP+ cells that co-expressed Pdgfrα. The data shown in (AD) are consistent with analyses performed in n = 5 animals, while the flow cytometry data in (E,E′,F,F′) are from n = 3 animals. Scale bars, 500 µm (A,A′,C,D), 200 µm (B,B′).
Figure 3
Figure 3
Clonal analysis of short-term and long-term lineage tracing of Wt1-expressing cells in adult mouse intestine. Adult mice with the Wt1CreERT2/+; Rosa26cofetti/LacZ reporter system were analysed 2 weeks and 6 months after Tamoxifen administration, respectively. Random segments (8 per animal; group size n = 3) of intestine were analysed by confocal microscopy after short fixation to eliminate peristalsis. Random Z-stacks were recorded and the number of cells scored into two groups: individual cells for all three reporters (as defined by no contact to same-colour cells) and cell clones (as defined by contact to same-colour cells). (A,B) Exemplary images of intestine segments from short-term (A) and long-term chase experiments (B). The image of the short-term experiment shows one 2-cell clone (blue, 2c), while that of the long-term experiment shows one 6-cell clone (red, 6c), one 3-cell clone (yellow, 3c) and two 2-cell clones (blue and yellow, 2c). Individual non-clonal cells were found as well. (C) Grouped Scatter Graph showing the ratios of cell-clone numbers versus non-clonal cell numbers from individual animals including the standard deviation of the mean (group size n = 3). Statistical analysis was performed using unpaired multiple t-tests with Holm-Šídák multiple comparisons correction for 2-cell- (adjusted p value = 0.026), 3-cell- and 4+-cell-clone ratios (both adjusted p value = 0.086). (D) Table summarizing the scores for clonal and non-clonal cells including ratio for individual animals of short- and long-term chase and pooled totals. Scale bars are 100 µm (A,B).
Figure 4
Figure 4
Whole mount analysis of adult heart after lineage tracing of Wt1-expressing cells. Adult mice with either the Wt1CreERT2/+; Rosa26LacZ/LacZ or the Wt1CreERT2/+; Rosa26mTmG/mTmG reporter system were analysed 2–4 weeks after Tamoxifen administration. (A,B) Coverage of the epicardium with labelled cells was patchy. (A′,B′) Magnification of highlighted areas in (A,B). LacZ-positive cells appeared to localize around coronary vessels (arrowheads) in addition to presence in the epicardium. By contrast, GFP-labelled cells consisted predominantly of flat-shaped epicardial cells, with a few thinly shaped cells detectable (open arrowheads). The data shown are consistent with analyses performed in n = 5 animals. Scale bars, 1.5 mm (A,B), 400 µm (A′), 200 µm (B′).
Figure 5
Figure 5
Analysis of the contribution of GFP-labelled lineage traced cells to vascular smooth muscle and endothelial cells in the adult heart after lineage tracing of Wt1-expressing cells. Adult mice with the Wt1CreERT2/+; Rosa26mTmG/mTmG reporter system were analysed 2–4 weeks after Tamoxifen administration. (AA‴) Immunofluorescence image of an entire heart section after immunolabelling for GFP (green), CD31 (red) and SMA (purple); the slide was scanned in and assembled using the tile and stitch function. Wt1-lineage derived GFP+ cells were mostly found in the epicardium, but small numbers of GFP+ cells are found scattered throughout the heart. (BB‴) High resolution image of the area indicated in A (box, yellow arrow), shows that CD31 and SMA staining co-localise with GFP+ cells. (CC‴) Confocal maximum intensity projection images of a microvessel demonstrate a GFP+ cell that expressed CD31, while a SMA+ cell was clearly distinct but closely attached (arrows). D. The arrangement of the GFP+ CD31+ cell with the SMA+ cell is also visualized in an orthogonal view. The data shown are consistent with analyses performed in n = 4 animals. Scale bars, 1000 µm (AA‴), 100 µm (BB‴), 10 µm (CC‴).
Figure 6
Figure 6
Whole mount and histological analysis of adult kidney after lineage tracing of Wt1-expressing cells. Adult mice with either the Wt1CreERT2/+; Rosa26LacZ/LacZ or the Wt1CreERT2/+; Rosa26mTmG/mTmG reporter system were analysed 2–4 weeks after Tamoxifen administration. (A,B) In kidney whole mounts (sagittal halves), labelled cells expressing LacZ or GFP were found in the glomeruli. (C) Eosin-counterstained sagittal paraffin sections showing LacZ-expression in the glomeruli of the kidney (open arrowheads pointing to glomeruli showing weaker XGal staining due to reduced penetration of staining reagents into tissue). (C′,C″) LacZ-expressing cells are also detected in the parietal epithelial layer of the Bowman Capsule (filled arrowheads). (D) Immunofluorescence on frozen sagittal kidney sections revealed GFP-expressing cells in the glomeruli. (E) Immunofluorescence for Wt1 and GFP in higher magnification of the two glomeruli outlined in the box in (D). (E′–E″″) Immunofluorescence for Wt1 and GFP of the left glomerulus shown in (E). GFP-labelled cells co-expressed Wt1 (E′, Wt1 and DAPI; E″, GFP and DAPI; E‴, Wt1 and GFP; E″″, Wt1, GFP, DAPI). (F,G) In rare cases, LacZ- or GFP-expressing cells were found in tubular structures reaching into the renal medulla (filled arrowheads). The data shown in (AE) are consistent with analyses performed in n = 5 animals. Scale bars, 2 mm (A,B), 300 µm (C,D), 100 µm (C′,C″,E), 50 µm (E′–E″″), 700 µm (F,G).
Figure 7
Figure 7
Ablation of Wt1 in adult intestine. Tamoxifen was given to mice carrying either the Wt1CreERT2/co or the Wt1CreERT2/+ allele, for 5 consecutive days. Mice were sacrificed on day 10 and the intestines harvested and XGal stained and/or directly processed for histology (Haematoxylin & Eosin or Eosin counter stain). After Tamoxifen, mice with and without the conditional Wt1 allele showed normal architecture of the intestinal wall, with mesothelial cells present as visualised by nuclear Haematoxylin staining (A,B) or by XGal staining (C,D). Scale bars, 100 μm (AD). The data shown are consistent with analyses performed in n = 6 animals.
Figure 8
Figure 8
Wt1 lineage tracing in newborn mice. Tamoxifen was given to female animals on days 1 and 4 after giving birth. Intestine (AC), heart (DF) and kidneys (GJ) of 7 old Wt1CreERT2/+; Rosa26LacZ/+ were stained by XGal and analysed for labelled cells. In the intestine, only mesothelial cells were labelled (A,B, filled arrowheads), while there were no labelled cells found around blood vessels (open arrowheads, AC). In the mesentery, mesothelial (filled arrowhead) and fat cells (arrow) also showed XGal staining (C). The heart (left ventricle and atrium shown, D) was covered with LacZ-labelled cells localised close to coronary vessels (stippled lines in inset D′). Sections revealed LacZ labelling of epicardial cells (filled arrowheads, E), but also of some coronary vessel cells (open arrowhead, F). Labelled cells in the kidneys were abundant throughout (G), predominantly in the glomeruli (H,I, filled arrowheads), but also in nephric tubules (HJ, open arrowheads). Scale bars, 500 μm (A,D,D′,H), 1 mm (G), 50 μm (B,E,F), 100 μm (C,I,J).

References

    1. Wilm B, Ipenberg A, Hastie ND, Burch JBE, Bader DM. The serosal mesothelium is a major source of smooth muscle cells of the gut vasculature. Development. 2005;132:5317–5328. doi: 10.1242/dev.02141. - DOI - PubMed
    1. Winters NI, Thomason RT, Bader DM. Identification of a novel developmental mechanism in the generation of mesothelia. Development. 2012;139:2926–2934. doi: 10.1242/dev.082396. - DOI - PMC - PubMed
    1. Que J, et al. Mesothelium contributes to vascular smooth muscle and mesenchyme during lung development. Proc. Natl. Acad. Sci. USA. 2008;105:16626–16630. doi: 10.1073/pnas.0808649105. - DOI - PMC - PubMed
    1. Carmona R, Cano E, Mattiotti A, Gaztambide J, Munoz-Chapuli R. Cells derived from the coelomic epithelium contribute to multiple gastrointestinal tissues in mouse embryos. PLoS ONE. 2013;8:e55890. doi: 10.1371/journal.pone.0055890. - DOI - PMC - PubMed
    1. Colunga T, et al. Human pluripotent stem cell-derived multipotent vascular progenitors of the mesothelium lineage have utility in tissue engineering and repair. Cell Rep. 2019;26:2566–2579. doi: 10.1016/j.celrep.2019.02.016. - DOI - PMC - PubMed

Publication types

LinkOut - more resources