. 2021 Aug 5;11(1):15895.
doi: 10.1038/s41598-021-95409-5.

Association between clinical and environmental factors and the gut microbiota profiles in young South African children

Affiliations

Association between clinical and environmental factors and the gut microbiota profiles in young South African children

Kristien Nel Van Zyl et al. Sci Rep. .

Abstract

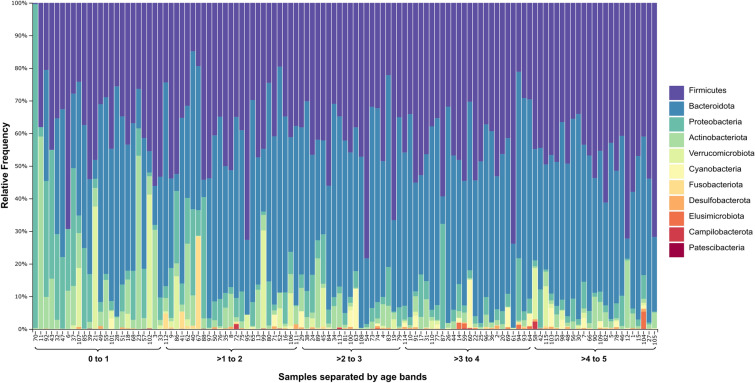
Differences in the microbiota in populations over age and geographical locations complicate cross-study comparisons, and it is therefore essential to describe the baseline or control microbiota in each population. This includes the determination of the influence of demographic, clinical and environmental factors on the microbiota in a setting, and elucidates possible bias introduced by these factors, prior to further investigations. Little is known about the microbiota of children in South Africa after infancy. We provide a detailed description of the gut microbiota profiles of children from urban Cape Town and describe the influences of various clinical and environmental factors in different age groups during the first 5 years of life. Prevotella was the most common genus identified in the participants, and after infancy, the gut bacteria were dominated by Firmicutes and Bacteroidetes. In this setting, children exposed to antibiotics and indoor cooking fires were at the most risk for dysbiosis, showing significant losses in gut bacterial diversity.


Conflict of interest statement

The authors declare no competing interests.

Figures

Figure 1
Figure 1
Taxonomic profiles of participant samples at phylum level. The brackets on the x-axis show the different age bands by year and samples within each band are ordered by increasing age. Features appearing in less than five samples, as well as unassigned and non-bacterial features were removed to simplify visualization.
Figure 2
Figure 2
The relative abundance of the top ten genera in each of the five age groups.
Figure 3
Figure 3
Shannon’s H alpha diversity plotted for significant factors (p < 0.05). (a) Age bands separated by year of life. Lines indicate significant differences between the groups at each end of the line. There were no significant differences between the groups representing the oldest three age bands. (b) Clinical factors, including receipt of antibiotics within 2 weeks from sample collection, treatment from traditional healer within 3 years from sample collection, and deworming within 6 months from sample collection. (c) Environmental factors, including exposure to an indoor cooking fire using paraffin or wood, and exposure to pets in the household (cats/dogs). Faith’s PD results have been summarised in Supplementary Table S2.
Figure 4
Figure 4
Two-dimensional PCoA plots based on three dissimilarity metrics. The three age groups are shown by colour. Yellow = A (0–1); Red = B (> 1 to 2); Blue = C (> 2 to 5). Group C is further subcategorized by shape. (a) Bray–Curtis, (b) Unweighted UniFrac, (c) Weighted UniFrac.
Figure 5
Figure 5
ANCOM generated volcano plots showing differentially abundant features between the age groups. W is the ANCOM test statistic and indicates the number of times the null hypothesis is rejected by the analysis. The higher W, the more likely a feature differs statistically. clr indicates the effect size change between the compared groups. Statistically significant features as identified by ANCOM have been labelled. (a) Comparison between groups A & C. A positive clr indicates higher abundance in A compared to C. (b) Comparison between groups A & B. A positive clr indicates higher abundance in B compared to A. (c) Comparison between groups B & C. A positive clr indicates higher abundance in C compared to B.

References

    1. Turnbaugh PJ, et al. The human microbiome project. Nature. 2007;449:804–810. doi: 10.1038/nature06244. - DOI - PMC - PubMed
    1. Sekirov I, Russell SL, Antunes LCM, Finlay BB. Gut microbiota in health and disease. Physiol. Rev. 2010;90:859–904. doi: 10.1152/physrev.00045.2009. - DOI - PubMed
    1. Lau AWY, et al. The chemistry of gut microbiome in health and diseases. Prog. Microbes Mol. Biol. 2021;4:1–40. doi: 10.36877/pmmb.a0000175. - DOI
    1. Langdon A, Crook N, Dantas G. The effects of antibiotics on the microbiome throughout development and alternative approaches for therapeutic modulation. Genome Med. 2016;8:39. doi: 10.1186/s13073-016-0294-z. - DOI - PMC - PubMed
    1. Wopereis H, Oozeer R, Knipping K, Belzer C, Knol J. The first thousand days—Intestinal microbiology of early life: Establishing a symbiosis. Pediatr. Allergy Immunol. 2014;25:428–438. doi: 10.1111/pai.12232. - DOI - PubMed

Publication types