. 2021 Aug 5;4(1):935.
doi: 10.1038/s42003-021-02437-y.

Neocortical inhibitory interneuron subtypes are differentially attuned to synchrony- and rate-coded information

Affiliations

Neocortical inhibitory interneuron subtypes are differentially attuned to synchrony- and rate-coded information

Luke Y Prince et al. Commun Biol. .

Abstract

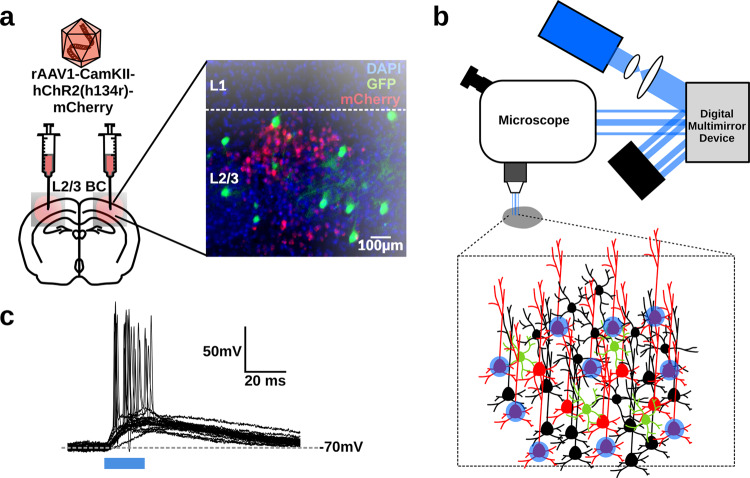
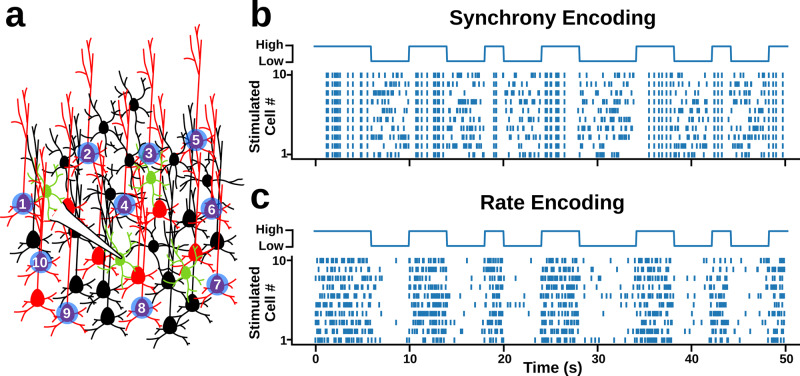
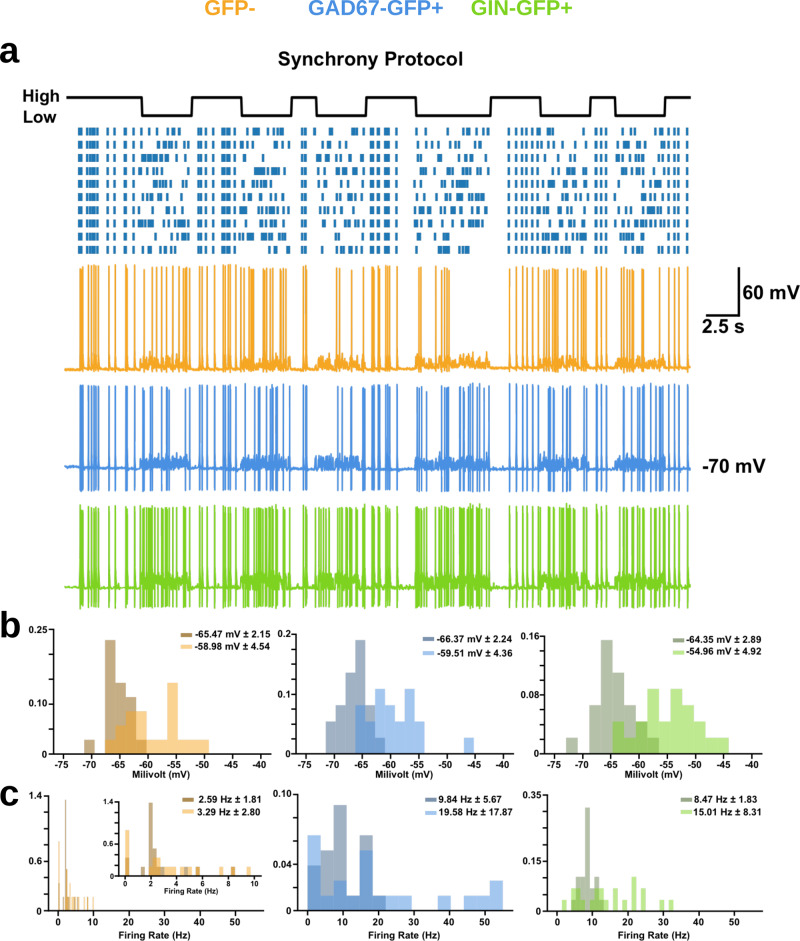
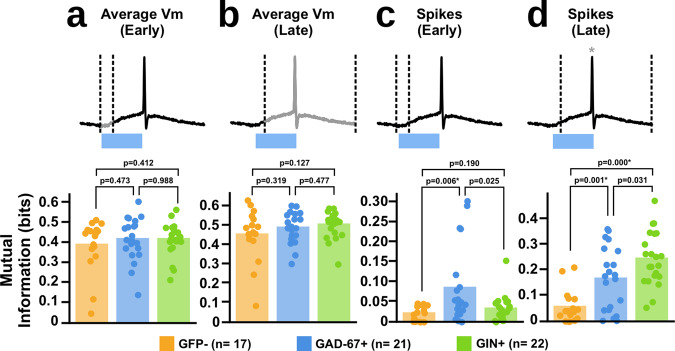
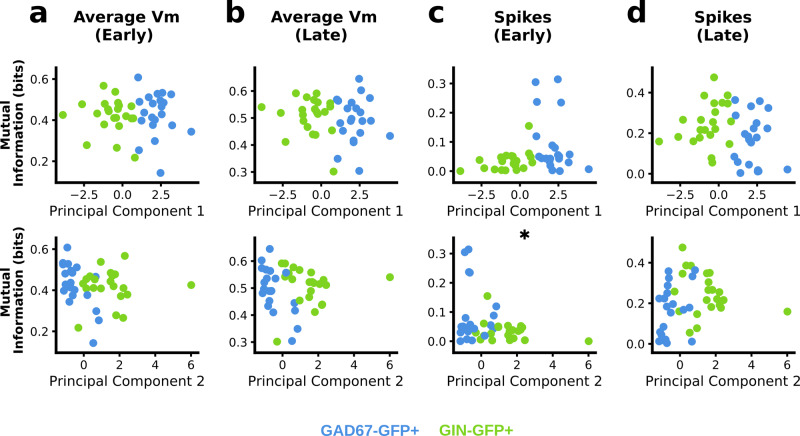
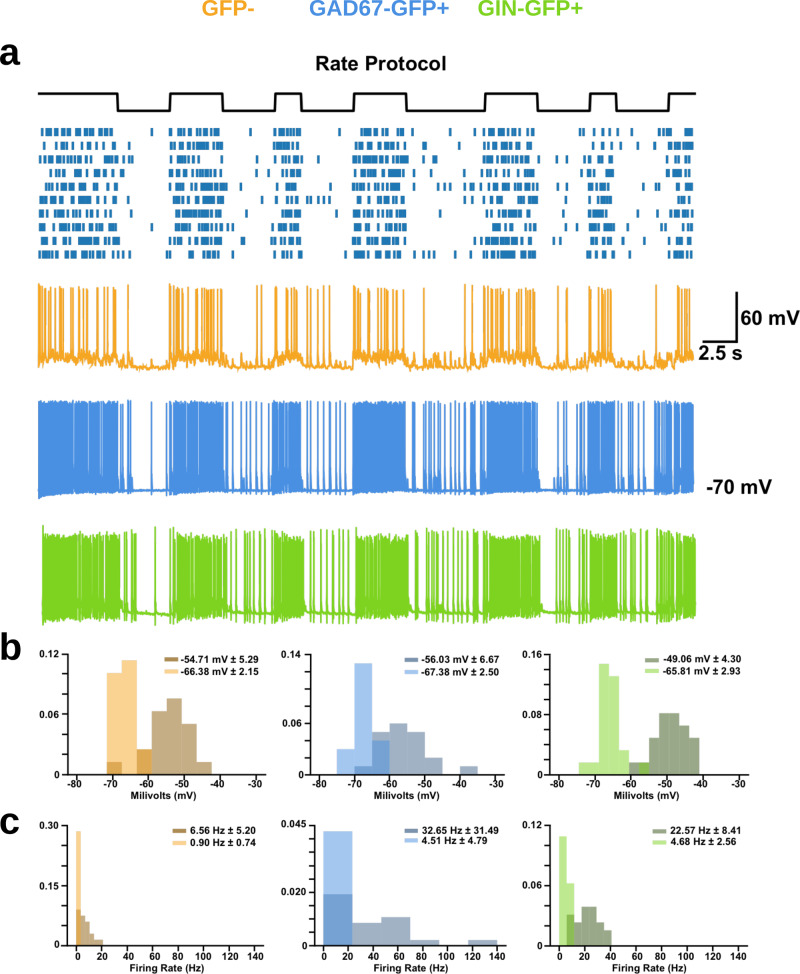
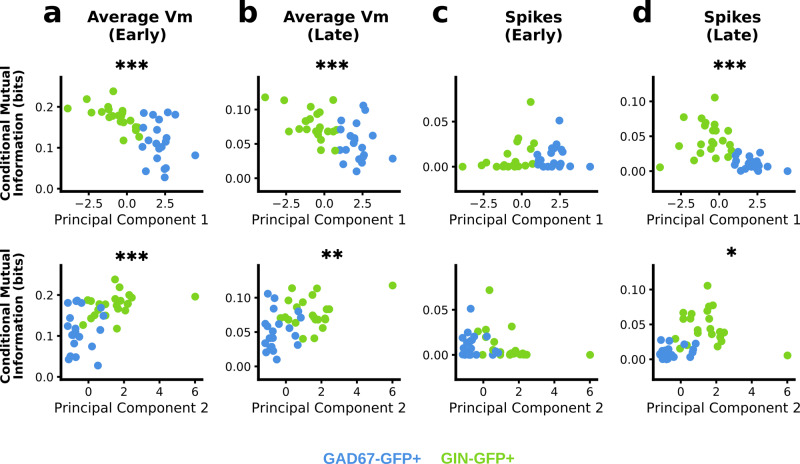
Neurons can carry information with both the synchrony and rate of their spikes. However, it is unknown whether distinct subtypes of neurons are more sensitive to information carried by synchrony versus rate, or vice versa. Here, we address this question using patterned optical stimulation in slices of somatosensory cortex from mouse lines labelling fast-spiking (FS) and regular-spiking (RS) interneurons. We used optical stimulation in layer 2/3 to encode a 1-bit signal using either the synchrony or rate of activity. We then examined the mutual information between this signal and the interneuron responses. We found that for a synchrony encoding, FS interneurons carried more information in the first five milliseconds, while both interneuron subtypes carried more information than excitatory neurons in later responses. For a rate encoding, we found that RS interneurons carried more information after several milliseconds. These data demonstrate that distinct interneuron subtypes in the neocortex have distinct sensitivities to synchrony versus rate codes.


Conflict of interest statement

The authors declare no competing interests.

Figures

Fig. 1
Fig. 1. GAD67-GFP and GIN-GFP mice target distinct populations of neurons, FS, mostly PV+, and SST+ interneurons, respectively.
a Sample electrophysiological traces from each cell type to current injections −80 pA, +160 pA, +400 pA (darkest to lightest). b Frequency vs. current injection (f–I) curves for each cell type. Larger circles represent mean values. c Mean slope of the f–I curves for each cell type. Horizontal lines represent mean values. d 2 Component PCA of each cell type’s electrophysiological characteristics. e Dendrogram clustering. f Sample immunohistochemistry images from both transgenic lines.
Fig. 2
Fig. 2. Patterned optical stimulation of ChR2+ Layer 2/3 Pyramidal Neurons.
a Viral transfection of Channelrhodopsin-2 into L2/3 Pyramidal Neurons. b Illustration of patterned optical stimulation protocol. c Sample responses from ChR2+ layer 2/3 pyramidal neurons (n = 19) to a 15 μm spot placed directly over the soma of the recorded neuron.
Fig. 3
Fig. 3. Artificially encoding a random 1-bit signal using the synchrony or rate of optical inputs to ChR2+ pyramidal neurons in layer 2/3.
a Experimental protocol. b Sample raster plots illustrating how the 1-bit signal was encoded using synchrony of optical inputs. c Sample raster plots illustrating how the 1-bit signal was encoded using the rate of optical inputs.
Fig. 4
Fig. 4. High and low states within the synchrony encodings produced different neuronal responses.
a Sample traces of each cell type to the synchrony encoding. b Probability density functions of the membrane potential of each cell type during high (darker histogram) and low (lighter histogram) states within the synchrony encodings (numbers shown represent mean membrane potential in each state ± s.d.). Two-way Kolmogorov–Smirnov (2-KS) tests indicate differences in the sample distributions of average membrane potential for each cell type between the 0 and 1 state (GFP−: D(30)  = 0.62, p < 0.001; GAD67-GFP: D(26) = 0.65, p < 0.001; GIN-GFP: D(30) = 0.43, p = 0.005). c Probability density functions of the firing frequency of each cell type during high and low states within the synchrony encodings (numbers shown represent mean firing frequency in each state ± s.d.). 2-KS tests indicate differences in the sample distributions of firing rates for GIN-GFP cells between the 0 and 1 state, but not GFP− or GAD67-GFP cells (GFP−: D(30) = 0.24, p = 0.32; GAD67-GFP: D(26) = 0.31, p = 0.4; GIN-GFP: D(30) = 0.43, p = 0.005).
Fig. 5
Fig. 5. Different subtypes of interneurons carry different amounts of information in response to our synchrony encoding.
a Mutual information analysis of the average membrane potential of each cell type to our 1-bit signal within early (0–5 ms) response. Dotted lines indicate window of analysis, with greyed areas indicating what part of the response was analysed (One-way ANOVA, F(2,57) = 0.432, p = 0.656; post-hoc t-tests: GFP− vs. GIN+: t(35) = −0.830, p = 0.412; GAD67+ vs. GIN+: t(41) = −0.00, p = 0.988; GFP− vs. GAD67+: t(36) = −0.737, p = 0.473, * = tests significant at p ≤ 0.017 with Bonferroni correction). b Same analysis as (a) but restricting the analysis to only the later (5–50 ms) responses (One-way ANOVA, F(2,57) = 1.40, p = 0.244; post hoc t-tests: GFP− vs. GIN+: t(37) = −1.56, p = 0.127; GAD67+ vs. GIN+: t(41) = −0.809, p = 0.477; GFP− vs. GAD67+: t(36) = −0.933, p = 0.319; * = tests significant at p ≤ 0.017 with Bonferroni correction). c Mutual information analysis of the spike counts of each cell type to our 1-bit signal within early (0–5 ms) response (Kruskal–Wallis, H(2) = 9.88, p = 0.007; post-hoc t-tests: GFP− vs. GIN+: t(37) = −1.35, p = 0.190; GAD67+ vs. GIN+: t(41) = 2.37, p = 0.025; GFP− vs. GAD67+: t(36) = −3.01, p = 0.006*, * = tests significant at p ≤ 0.017 with Bonferroni correction). d Same analysis as (c) but restricting the analysis to only the later (5–50 ms) responses (Kruskal–Wallis, H(2) = 21.2, p ≤ 0.001; post-hoc t-tests: GFP− vs. GIN+: t(37) = −6.94, p ≤ 0.001*; GAD67+ vs. GIN+: t(41) = −2.26, p = 0.031; GFP− vs. GAD67+: t(36) = −3.49, p = 0.001*, * = tests significant at p ≤ 0.017 with Bonferroni correction).
Fig. 6
Fig. 6. Mutual information between early spike counts in recorded neurons and synchrony code correlates with second principal component of electrophysiological features in GAD67+ and GIN+ interneurons.
a Mutual information between average membrane potential and 1-bit synchrony coded signal correlated with first and second principal components (PC1 and PC2, respectively) of electrophysiological features in the early window (PC1: Pearson’s r =  −0.04, p = 0.818; PC2: Pearson’s r = −0.17; p = 0.281). b Same as (a) but comparing later average membrane potential responses (PC1: Pearson’s r = −0.13; p = 0.394. PC2: Pearson’s r = − 0.09, p = 0.583). c Conditional mutual information between spike counts and 1-bit synchrony coded signal correlated with first and second principal components of electrophysiological features in the early window (PC1: Pearson’s r = 0.27, p = 0.084; PC2: Pearson’s r = − 0.32, p = 0.037). d Same as (c) but comparing spike counts in later window (PC1: Pearson’s r = −0.21, p = 0.169; PC2: Pearson’s r = 0.20, p = 0.191).
Fig. 7
Fig. 7. High and low states within the rate encodings produced different neuronal responses.
a Sample traces of each cell type to the rate encoding. b Probability density functions of the membrane potential of each cell type during high (darker histogram) and low (lighter histogram) states within the rate encodings (numbers shown represent mean membrane potential in each state ± standard deviation). 2-KS tests indicate differences in the sample distributions of average membrane potential for each cell type between the 0 and 1 state (GFP−: D(30) = 0.76, p < 0.001; GAD67-GFP: D(26) = 0.80, p < 0.001; GIN-GFP: D(30) = 0.83, p < 0.001). c Probability density functions of the firing frequency of each cell type during high and low states within the rate encodings (numbers shown represent mean firing frequency in each state ± standard deviation). 2-KS tests indicate differences in the sample distributions of average membrane potential for each cell type between the 0 and 1 state (GFP−: D(30) = 0.55, p < 0.001; GAD67-GFP: D(26) = 0.52, p < 0.001; GIN-GFP: D(30) = 0.73, p < 0.001).
Fig. 8
Fig. 8. Different subtypes of interneurons carry different amounts of information in response to our rate encoding.
a Mutual information analysis of the average membrane potential of each cell type to our 1-bit signal within early (0–5 ms) response. Dotted lines indicate window of analysis, with greyed areas indicating what part of the response was analysed (Kruskal–Wallis, H(2) = 13.9, p ≤ 0.001; post-hoc t-tests: GFP− vs. GIN+: t(37) = −0.806, p = 0.425; GAD67+ vs. GIN+: t(40) = −4.17, p ≤ 0.001*; GFP− vs. GAD67+: t(35) = 3.48, p = 0.001*, * = tests significant at p ≤ 0.017 with Bonferroni correction). b Same analysis as (a) but restricting the analysis to only the later (5–50 ms) responses (One-way ANOVA, F(2,56) = 3.10, p = 0.053; post-hoc t-tests: GFP- vs. GIN+: t(37) = 0.266, p = 0.792; GAD67+ vs. GIN+: t(40) = −1.98, p = 0.054; GFP− vs. GAD67+: t(35) = 1.93, p = 0.062, * = tests significant at p ≤ 0.017 with Bonferroni correction). c Mutual information analysis of the spike counts of each cell type to our 1-bit signal within early (0–5 ms) response (One-way ANOVA, F(2,56) = 2.93, p = 0.066; post-hoc t-tests: GFP− vs. GIN+: t(37) = −2.04, p = 0.048; GAD67+ vs. GIN+: t(40) = −0.226, p = 0.778; GFP− vs. GAD67+: t(35) = −3.66, p = 0.002*, * = tests significant at p ≤ 0.017 with Bonferroni correction). d Same analysis as (c) but restricting the analysis to only the later (5–50 ms) responses (Kruskal–Wallis, H(2) = 30.5, p ≤ 0.001; post-hoc t-tests: GFP− vs. GIN+: t(37) = −6.42, p ≤ 0.001*; GAD67+ vs. GIN+: t(40) = −5.92, p ≤ 0.001*; GFP− vs. GAD67+: t(35) = −1.14, p = 0.324, * = tests significant at p ≤ 0.017 with Bonferroni correction).
Fig. 9
Fig. 9. Conditional mutual information between responses in recorded neurons and rate code correlates with first and second components of electrophysiological features in GAD67+ and GIN+ interneurons.
a Conditional mutual information between average membrane potential and 1-bit rate coded signal correlated with first and second principal components (PC1 and PC2, respectively) of electrophysiological features in the early window (PC1: Pearson’s r = −0.65, p ≤ 0.001; PC2: Pearson’s r = 0.52; p ≤ 0.001). b Same as (a) but comparing later average membrane potential responses (PC1: Pearson’s r = −0.54; p ≤ 0.001. PC2: Pearson’s r = 0.46, p = 0.002). c Conditional mutual information between spike counts and 1-bit rate coded signal correlated with first and second principal components of electrophysiological features in the early window (PC1: Pearson’s r = 0.19, p = 0.237; PC2: Pearson’s r = −0.28, p = 0.078). d Same as (c) but comparing spike counts in later window (PC1: Pearson’s r = −0.56, p ≤ 0.001; PC2: Pearson’s r = 0.36, p = 0.018).

References

    1. Adrian ED, Zotterman Y. The impulses produced by sensory nerve endings. J. Physiol. 1926;61:465–483. doi: 10.1113/jphysiol.1926.sp002308. - DOI - PMC - PubMed
    1. Hubel DH, Wiesel TN. Receptive fields of single neurones in the cat’s striate cortex. J. Physiol. 1959;148:574–591. doi: 10.1113/jphysiol.1959.sp006308. - DOI - PMC - PubMed
    1. O’Keefe J, Dostrovsky J. The hippocampus as a spatial map. Preliminary evidence from unit activity in the freely-moving rat. Brain Res. 1971;34:171–175. doi: 10.1016/0006-8993(71)90358-1. - DOI - PubMed
    1. Georgopoulos AP, Kalaska JF, Caminiti R, Massey JT. On the relations between the direction of two-dimensional arm movements and cell discharge in primate motor cortex. J. Neurosci. 1982;2:1527–1537. doi: 10.1523/JNEUROSCI.02-11-01527.1982. - DOI - PMC - PubMed
    1. VanRullen R, Guyonneau R, Thorpe S. Spike times make sense. Trends Neurosci. 2005;28:1–4. doi: 10.1016/j.tins.2004.10.010. - DOI - PubMed

Publication types