. 2021 Aug;23(8):905-914.
doi: 10.1038/s41556-021-00725-7. Epub 2021 Aug 5.

Diverse heterochromatin-associated proteins repress distinct classes of genes and repetitive elements

Affiliations

Diverse heterochromatin-associated proteins repress distinct classes of genes and repetitive elements

Ryan L McCarthy et al. Nat Cell Biol. 2021 Aug.

Erratum in

Abstract

Heterochromatin, typically marked by histone H3 trimethylation at lysine 9 (H3K9me3) or lysine 27 (H3K27me3), represses different protein-coding genes in different cells, as well as repetitive elements. The basis for locus specificity is unclear. Previously, we identified 172 proteins that are embedded in sonication-resistant heterochromatin (srHC) harbouring H3K9me3. Here, we investigate in humans how 97 of the H3K9me3-srHC proteins repress heterochromatic genes. We reveal four groups of srHC proteins that each repress many common genes and repeat elements. Two groups repress H3K9me3-embedded genes with different extents of flanking srHC, one group is specific for srHC genes with H3K9me3 and H3K27me3, and one group is specific for genes with srHC as the primary feature. We find that the enhancer of rudimentary homologue (ERH) is conserved from Schizosaccharomyces pombe in repressing meiotic genes and, in humans, now represses other lineage-specific genes and repeat elements. The study greatly expands our understanding of H3K9me3-based gene repression in vertebrates.


Conflict of interest statement

Competing Interests Statement

The authors have no competing interests to declare.

Figures
Extended Data Fig. 1
Extended Data Fig. 1. Validation of siRNA efficiency and confirmation of RNA-seq results by qPCR.
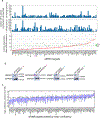
a, qPCR quantification of knockdown for all siRNAs used in this study. siRNAs used for treating cells for RNA-seq analysis indicated in red. Above bar graphs show the number of srHC genes significantly upregulated (DESeq2, Benjamini multiple test corrected Wald test p-value ≤0.05 and log2(foldchange)>0) by each knockdown in reprogramming and non-reprogramming conditions. (n=2 biological replicates per siRNA, two siRNAs per target) b, Protein depletion efficiency for select srHC proteins in study, asterisk color corresponds to knockdown in (a). Arrows indicate location of indicated molecular weight markers. Experiment repeated independently 2 times with similar results. Unprocessed blots are provided as source data. c, Quantification of cell confluency using PHANTAST from phase contrast images (n=4 images for each condition; two independently targeting siRNAs per target, two replicates per siRNA). Boxplot center, bounds and whiskers represent the median, 25–75% range and minimum to maximum values.
Extended Data Fig. 2
Extended Data Fig. 2. Extended analysis of top noTF srHC proteins.
a, Sucrose gradient fractionation of sonicated DNA, DNA concentration of each fraction indicated (20ul loaded per lane), followed by western blot probing for ERH with RBMX and H3 as controls. Experiment repeated independently 2 times with similar results. b, qRT-PCR in siControl (n=3) and siERH treated (n=3 for each of two different siRNAs) human fibroblasts of pre-RNAs of genes upregulated at mRNA level by ERH depletion (two tailed Student’s t-test). Boxplot center, bounds and whiskers represent the median, 25–75% range and minimum to maximum values. c, Spermatogenic TF motif enrichment in srHC spermatogenesis genes upregulated and not upregulated by each of the n=97 siRNA targets (two tailed Student’s t-test). Boxplot center, bounds and whiskers represent the median, 25–75% range and minimum to maximum values. d, Western blots for transcription factors involved in spermatogenesis to assess levels in fibroblast whole cell lysate. e, Western blots for transcription factors with motifs enriched in promoters of srHC genes activated by ERH knockdown. f, Expanded Salmon TE heatmaps for knockdowns showing highest repeat activation (arrows indicate subtypes with the highest percent of upregulation by indicated knockdown). P values from b,c are denoted in the panels. Statistical information and unprocessed blots are provided as source data.
Extended Data Fig. 3
Extended Data Fig. 3. ERH depletion causes a global decrease in H3K9me3 but does not decrease H3K9 HMT expression or H3K9me2 levels.
a, Quantification of H3K9me3 immunofluorescence in siControl and siERH treated human fibroblasts (Student’s two tailed t-test). Boxplot center, bounds and whiskers represent the median, 25–75% range and minimum to maximum values. N numbers are denoted in the panel and represent the number of cells imaged per treatment. b, Volcano plots showing expression change and significance of indicated H3K9 histone methyltransferase for 97 siRNA knockdowns by RNA-seq (n=2). siRNA knockdowns causing significant (DEseq2, Benjamini multiple test corrected Wald test p-value ≤0.05 and log2(foldchange)>0) upregulation (red) or downregulation (blue) are listed within graph. c, H3K9me3 immunofluorescence (left) and quantification (right) in siControl (n=352 cells) and siERH (n=365 cells) treated HepG2 cells (two tailed Student’s t-test). Experiment repeated independently 2 times with similar results. Boxplot center, bounds and whiskers represent the median, 25–75% range and minimum to maximum values. P values denoted in panel. d, Western blots for H3K9me3 histone methyltransferases in siControl and siERH treated human fibroblasts. Experiment repeated independently 2 times with similar results. e, Western blots for ERH, SUV39H1 and H3K9me3 in the sonicated chromatin fraction from siControl and siERH treated human fibroblasts. Arrows indicate location of indicated molecular weight markers. Experiment repeated independently 2 times with similar results. f, H3K9me3 immunofluorescence comparison between siERH and HMTs siSUV39H1 and siSETDB1. Experiment repeated independently 2 times with similar results. g, H3K9me2 (green) and DAPI (blue) immunofluorescence in siControl and siERH treated human fibroblasts using an alternative antibody. Experiment repeated independently 2 times with similar results. h, H3K9me3 immunofluorescence in siControl and siSKIV2L2 treated human fibroblasts. Scale bars indicate 50μm for all images. Experiment repeated independently 2 times with similar results. Unprocessed blots are provided as source data.
Extended Data Fig. 4
Extended Data Fig. 4. ERH regulates gametogenic genes and a subset of repeat elements.
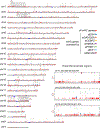
a, RNA-seq tracks showing SPANX cluster expression in siERH and several additional srHC protein knockdowns; same scale used for all mRNA-seq tracks. b, Protein sequence alignment of the ERH interacting domain of Mmi1 (95–122) and corresponding regions, determined by full length protein alignment, of the closest human orthologs. Purple arrow indicates tryptophan residue previously observed in a separate study to be important for ERH interaction. c, R-Deep database showing control and RNase treated fractionation and mass spectrometry detection of ERH. Other proteins observed to fractionate with ERH in fraction 22 which also exhibit a RNase induced shift listed in red box. d, Correlation of RepEnrich analysis of H3K9me3 and expression changes of repeat element classes in siERH relative to siControl. Alu and ERVK elements showed the greatest negative correlation between H3K9me3 and expression and are plotted separately. R correlation coefficient and p-value calculated using corrcoef in MATLAB; p-value calculated as the corresponding two-sided p-value for the t-distribution with n-2 degrees of freedom. N numbers stated in panel and represent the number of distinct repeat elements of indicated class. e, Violin plots of H3K9me3 and expression fold change (log2(siERH/siControl)) as determined by RepEnrich for the repeat element classes exhibiting significant H3K9me3 and expression changes (two tailed Student’s t-test). N numbers stated in panel and represent the number of distinct repeat elements of indicated class. f, H3K27me3 changes at satellite repeats in siERH relative to siControl. g, Motif occurrence for FOXA3, HNF1α and HNF4α in ERV (n=1641 element sequences), LINE (n=471 element sequences) and SINE (n=147 element sequences) elements (two tailed Student’s t-test). Boxplot center, bounds and whiskers represent the median, 25–75% range and minimum to maximum values. h, Quantification of flow cytometry assay of siRNA+hiHep cells stained for the hepatic marker ASGPR1 (two tailed Student’s t-test to siControl). N numbers stated in panel and representthe number of cells quantified to calculate percent positive per condition. P values in d,e,g,h are denoted in the panels.
Extended Data Fig. 5
Extended Data Fig. 5. Chromosomal positions of srHC gene activation for noTF and hiHep.
Chromosomal positions for hiHep activation of srHC genes by indicated knockdowns. Expanded example regions 1–3 are marked by grey background.
Extended Data Fig. 6
Extended Data Fig. 6. Histone profiles of genes targeted by hub proteins.
a,b,c, H3K9me3 (a), H3K27me3 (b) and srHC (c) meta profiles of genes targeted by hub proteins 2.5kb upstream of TSS to 2.5kb downstream of TTS.
Extended Data Fig. 7
Extended Data Fig. 7. Extended cluster specific analysis.
a, Gene Ontology analysis for statistical overrepresentation of biological processes for srHC genes uniquely repressed by each cluster; non-redundant GO categories shown (p-value calculated by PANTHER Statistical overrepresentation test, denoted in panel). N numbers represent number of genes in GO category repressed by srHC protein member of indicated cluster and are stated in panel. b, Profiles of A/B compartment enrichment, H4K20me1 and DNA methylation by bisulfide sequencing across genes uniquely regulate by each cluster. c, TargetScan database analysis for enrichment of miRNA target sequences in srHC genes uniquely repressed by each cluster; -log2(p-value) shown for the top 55 enriched miRNA target sequences per cluster (p-value calculated using the statistical model developed in Agarwal et al., 2017). d, Heatmap of H3K9me3, H3K27me3 and srHC-seq profiles of srHC genes uniquely regulated by each srHC protein cluster and sorted by mean H3K9me3 level within each cluster set. N numbers represent number of srHC gene profiles depicted and are stated in the panel.
Extended Data Fig. 8
Extended Data Fig. 8. srHC protein ChIP-seq.
a, ChIP-seq profiles of HMGA1 and MYBBP1A at srHC genes repressed by both factors or repressed by the other factor. b, Browser track showing ERH at a H3K9me3 marked euchromatin domain. c, srHC and euchromatin H3K9m3 gene expression changes in siERH+hiHep. N numbers represent the number of srHC or euchromatin srHC genes and are stated in the panel. The number of genes in each set significantly up (red) or down (blue) are indicated. d, DNA fragment size profiles by BioAnalyzer of INPUT and eluted DNA after ChIP of the indicated srHC protein. e, Table showing the percent of DNA fragments with length>=1kb as determined by paired-end sequencing for reads mapping with over 50% overlap with euchromatin or srHC domains (two tailed Student’s t-test, n=3 biological replicates sequenced as INPUT).
Extended Data Fig. 9
Extended Data Fig. 9. Quantification of confocal images and extended analysis.
a, Methodology for defining nuclear border and quantifying fluorescence intensity. b, H3K9me3 and H3K27me3 immunofluorescence in siControl and siXRN2 treated human fibroblasts. Images representative of 2 experiments. c, H3K9me3 immunofluorescence in siControl and siYTHDC1 treated human fibroblasts. Images representative of 4 experiments. d,e Representative images (d) and quantification (e) of H3K27me3 for cells depleted by siRNA for hub proteins. Images representative of 2 experiments. Boxplot center, bounds and whiskers represent the median, 25–75% range and minimum to maximum values. N numbers for e represent the number of cells imaged and are stated in the panel. f, Plot showing correlation of H3K9me3 immunofluorescence intensity relative to siControl vs the number of hepatic srHC genes induced during hiHep reprogramming for the target srHC proteins in Fig. 5b. R correlation coefficient and p-value calculated using corrcoef in MATLAB; p-value calculated as the corresponding two-sided p-value for the t-distribution with n-2 degrees of freedom. N numbers stated in panel and represent the number of siRNA targets. All scale bars indicate 50 μm.
Extended Data Fig. 10
Extended Data Fig. 10. Expanded analysis of ChIP-seq and srHC-seq in siERH.
a, DNA size profiles of sonicated fractions from siControl and siERH. b, Combinatorial H3K9me3 and H3K27me3 levels for srHC genes in siControl treated human fibroblasts. c, Heatmap displaying enrichment of H3K9me3, H3K27me3, dual-marked, and unmarked srHC gene subtypes in siControl and siERH from 2kp upstream of TSS to 2kp downstream of TTS. d, Activation of srHC alternative lineage genes in siERH relative to siControl during hiHep reprogramming not activated by siERH without hiHep factors. e, Percent occurrence of top 5 motifs enriched in promoters of non-hepatic genes upregulated in siERH+hiHep conditions and corresponding expression of the putative targeting factors in 4 siControl+hiHep replicates. f, H3K9me3 changes at classes of key hepatic genes, cytochrome p450 (n=50), UGT (n=21), SLC transporter (n=196) and ABC transporter (n=27), in siERH compared to siControl. Boxplot center, bounds and whiskers represent the median, 25–75% range and minimum to maximum values. g,h, Location of srHC genes gaining H3K9me3 (g) and H3K27me3 (h) on t-SNE embedding. i, hiHep motifs from Jaspar database and identified motifs in promoter regions (tss +/− 200) of srHC genes with motif scores >=10. j, Table showing total gene numbers and activation rates in siERH for sets of srHC genes defined by presence of strong hiHep motifs and specific changes in H3K9me3 and H3K27me3 levels.
Figure 1 |
Figure 1 |
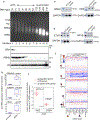
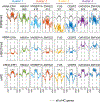
Heterochromatin associated proteins maintain repression of genes and repetitive elements. a, Experimental design of siRNA treatments and sample collection. b, Fraction of srHC genes and repetitive elements upregulated vs siControl (Bejamini multiple test corrected Wald test p-value≤0.05 and log2(foldchange)>0) by each knockdown for specified gene lineage category or repetitive element class in human fibroblasts; hierarchically clustered by target gene across all lineage categories. DESeq2 results are provided as source data. c, Number of all repressed srHC genes shared between the 8 indicated srHC proteins. d, expression in human fibroblasts across four siControl treated replicates of canonical transcription factors for hepatic, neuro, pluripotent, sperm and oocyte lineages. e, Transcription factor binding site motifs enriched in promoters of srHC genes induced or not induced by ERH knockdown and their RNA expression in control cells.
Figure 2 |
Figure 2 |
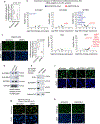
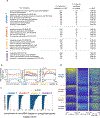
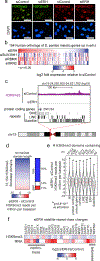
ERH functions through conserved mechanisms to maintain H3K9 methylation and gene repression. a, Immunofluorescence of H3K9me3 (green), H3K9me2 (red) and DAPI (blue) after siControl or siERH siRNA treatment in human fibroblasts. Experiment repeated independently 8 times with similar results. Scale bars indicate 50 μm. b, Expression changes of 154 human gene orthologs of S. pombe meiotic genes upregulated in erhΔ compared to other knockdowns (DESeq2, Benjamini multiple test corrected Wald test p-value ≤0.05 and log2(foldchange)>0). Gene names, lfc and p-value provided as source data. c, Gene track of example H3K9me3 domain showing H3K9me3 levels in siControl and siERH and locations of incident protein coding genes and repeats. d, Heatmap of H3K9me3 ChIP-seq in siERH minus siControl at 15154 length normalized H3K9me3 domains, and the corresponding percentages of domains with H3K9me3 loss, gain or no change. e, H3K9me3 changes for domains containing at least one of protein coding genes, pseudo-genes, non-coding RNA, LINE, SINE, ERV or Satellite repeats (one sample t-test *p<0.5*10−12). Boxplot center, bounds and whiskers represent the median, 25–75% range and minimum to maximum values. N numbers are denoted in the panel and represent the number of annotated srHC domains containing each type of gene or repeat. f, Analysis of H3K9me3 levels and RNA expression by RepEnrich for classes of satellite repeats after siERH knockdown. Statistical information is provided as source data.
Figure 3 |
Figure 3 |
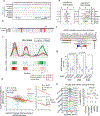
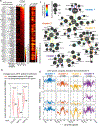
Heterochromatin associated proteins function cooperatively and distinctly to regulate silencing during reprogramming. a, Heatmap representation of the fraction of srHC genes upregulated vs siControl (DESeq2, Benjamini multiple test corrected Wald test p-value ≤0.05 and log2(foldchange)>0) by each knockdown for specified gene lineage category in normal fibroblasts and hiHep reprogrammed cells. DESeq2 results are provided as source data. Knockdown targets ordered by number of hepatic genes upregulated in hiHep conditions. b, Violin plots showing hiHep transcription factor motif enrichment in all hepatic gene promoters (black) and in activated genes (red) by all siRNA knockdowns upregulating at least 25 srHC hepatic genes during hiHep reprogramming (n=63 independent siRNA targets, one tailed Student’s t-test). Boxplot center, bounds and whiskers represent the median, 25–75% range and minimum to maximum values. P values denoted in panel. c, Graph of nearest neighbors clustering analysis of srHC genes upregulated by each knockdown (black nodes) during hiHep reprogramming, and display of fraction total genes shared with the connected knockdown (colored connections) represented in a counterclockwise manner. d, Histone profiles, input subtracted, for H3K9me3, H3K27me3 and srHC for srHC genes upregulated uniquely by each cluster. Statistical information is provided as source data.
Figure 4 |
Figure 4 |
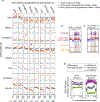
srHC proteins bind repressed target genes. a, ChIP-seq profiles of 8 srHC proteins across the gene body +/−10kb of all srHC genes (grey), srHC genes upregulated by the indicated siRNA + hiHep condition (red) and srHC genes not upregulated by the indicated siRNA + hiHep (blue). b, c, Browser tracks showing H3K9me3, sonication resistance and two replicates of ERH ChIP-seq at regions of chromosome 16 (b) and chromosome 20 (c). d, ERH ChIP-seq signal across srHC and euchromatin H3K9me3, H3K27me3 and unmarked domains.
Figure 5 |
Figure 5 |
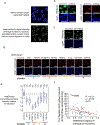
srHC protein clusters regulate heterochromatin histone modifications. a, Example IF images showing H3K9me3 (green) changes and DAPI (blue) with hub node knockdowns in human BJ fibroblasts. Scale bars indicate 50μm. Image is representative of 4 experiments. b, Quantification of H3K9me3 immunofluorescence for knockdowns of hub and peripheral node srHC proteins relative to siControl (n>100 nuclei for each treatment). Boxplot center, bounds and whiskers represent the median, 25–75% range and minimum to maximum values respectively. Statistical information is provided as source data.
Figure 6 |
Figure 6 |
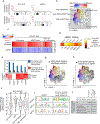
Locus specific and global changes in heterochromatin drive de-repression of srHC genes. a, t-SNE plots of H3K9me3, H3K27me3 and srHC levels across 9275 srHC genes. Colorbar ranges from bottom 5% to upper 95% of data points. b, t-SNE plots of changes in H3K9me3, H3K27me3 and srHC levels in siERH relative to siControl. c, Heatmap displaying percentage of alternative lineage srHC gene activation by siERH during hiHep reprogramming. d,e, Browser track showing H3K9me3, H3K27me3, srHC and expression changes for example srHC gene losing H3K9me3 (d) and example srHC gene losing H3K9me3 and gaining H3K27me3 (e).

Comment in

References

    1. Becker JS, Nicetto D & Zaret KS H3K9me3-Dependent Heterochromatin: Barrier to Cell Fate Changes. Trends Genet. 32, 29–41 (2016). - PMC - PubMed
    1. Becker JS et al. Genomic and Proteomic Resolution of Heterochromatin and Its Restriction of Alternate Fate Genes. Mol. Cell 68, 1023–1037.e15 (2017). - PMC - PubMed
    1. Margueron R. & Reinberg D. The Polycomb complex PRC2 and its mark in life. Nature 469, 343–349 (2011). - PMC - PubMed
    1. Bulut-Karslioglu A. et al. Suv39h-dependent H3K9me3 marks intact retrotransposons and silences LINE elements in mouse embryonic stem cells. Mol. Cell 55, 277–290 (2014). - PubMed
    1. Nicetto D. et al. H3K9me3-heterochromatin loss at protein-coding genes enables developmental lineage specification. Science 363, 294–297 (2019). - PMC - PubMed

References for Methods

    1. van Pelt JF, Decorte R, Yap PSH & Fevery J. Identification of HepG2 variant cell lines by short tandem repeat (STR) analysis. Mol Cell Biochem 243, 49–54 (2003). - PubMed
    1. Jaccard N. et al. Automated method for the rapid and precise estimation of adherent cell culture characteristics from phase contrast microscopy images. Biotechnol Bioeng 111, 504–517 (2014). - PMC - PubMed
    1. Huang J. et al. A reference human genome dataset of the BGISEQ-500 sequencer. Gigascience 6, 1–9 (2017). - PMC - PubMed
    1. Chen Y. et al. SOAPnuke: a MapReduce acceleration-supported software for integrated quality control and preprocessing of high-throughput sequencing data. Gigascience 7, 1–6 (2018). - PMC - PubMed
    1. Li B. & Dewey CN RSEM: accurate transcript quantification from RNA-Seq data with or without a reference genome. BMC Bioinformatics 12, 323 (2011). - PMC - PubMed

Publication types