. 2021 Aug;18(8):903-911.
doi: 10.1038/s41592-021-01222-3. Epub 2021 Aug 5.

SCITO-seq: single-cell combinatorial indexed cytometry sequencing

Affiliations

SCITO-seq: single-cell combinatorial indexed cytometry sequencing

Byungjin Hwang et al. Nat Methods. 2021 Aug.

Abstract

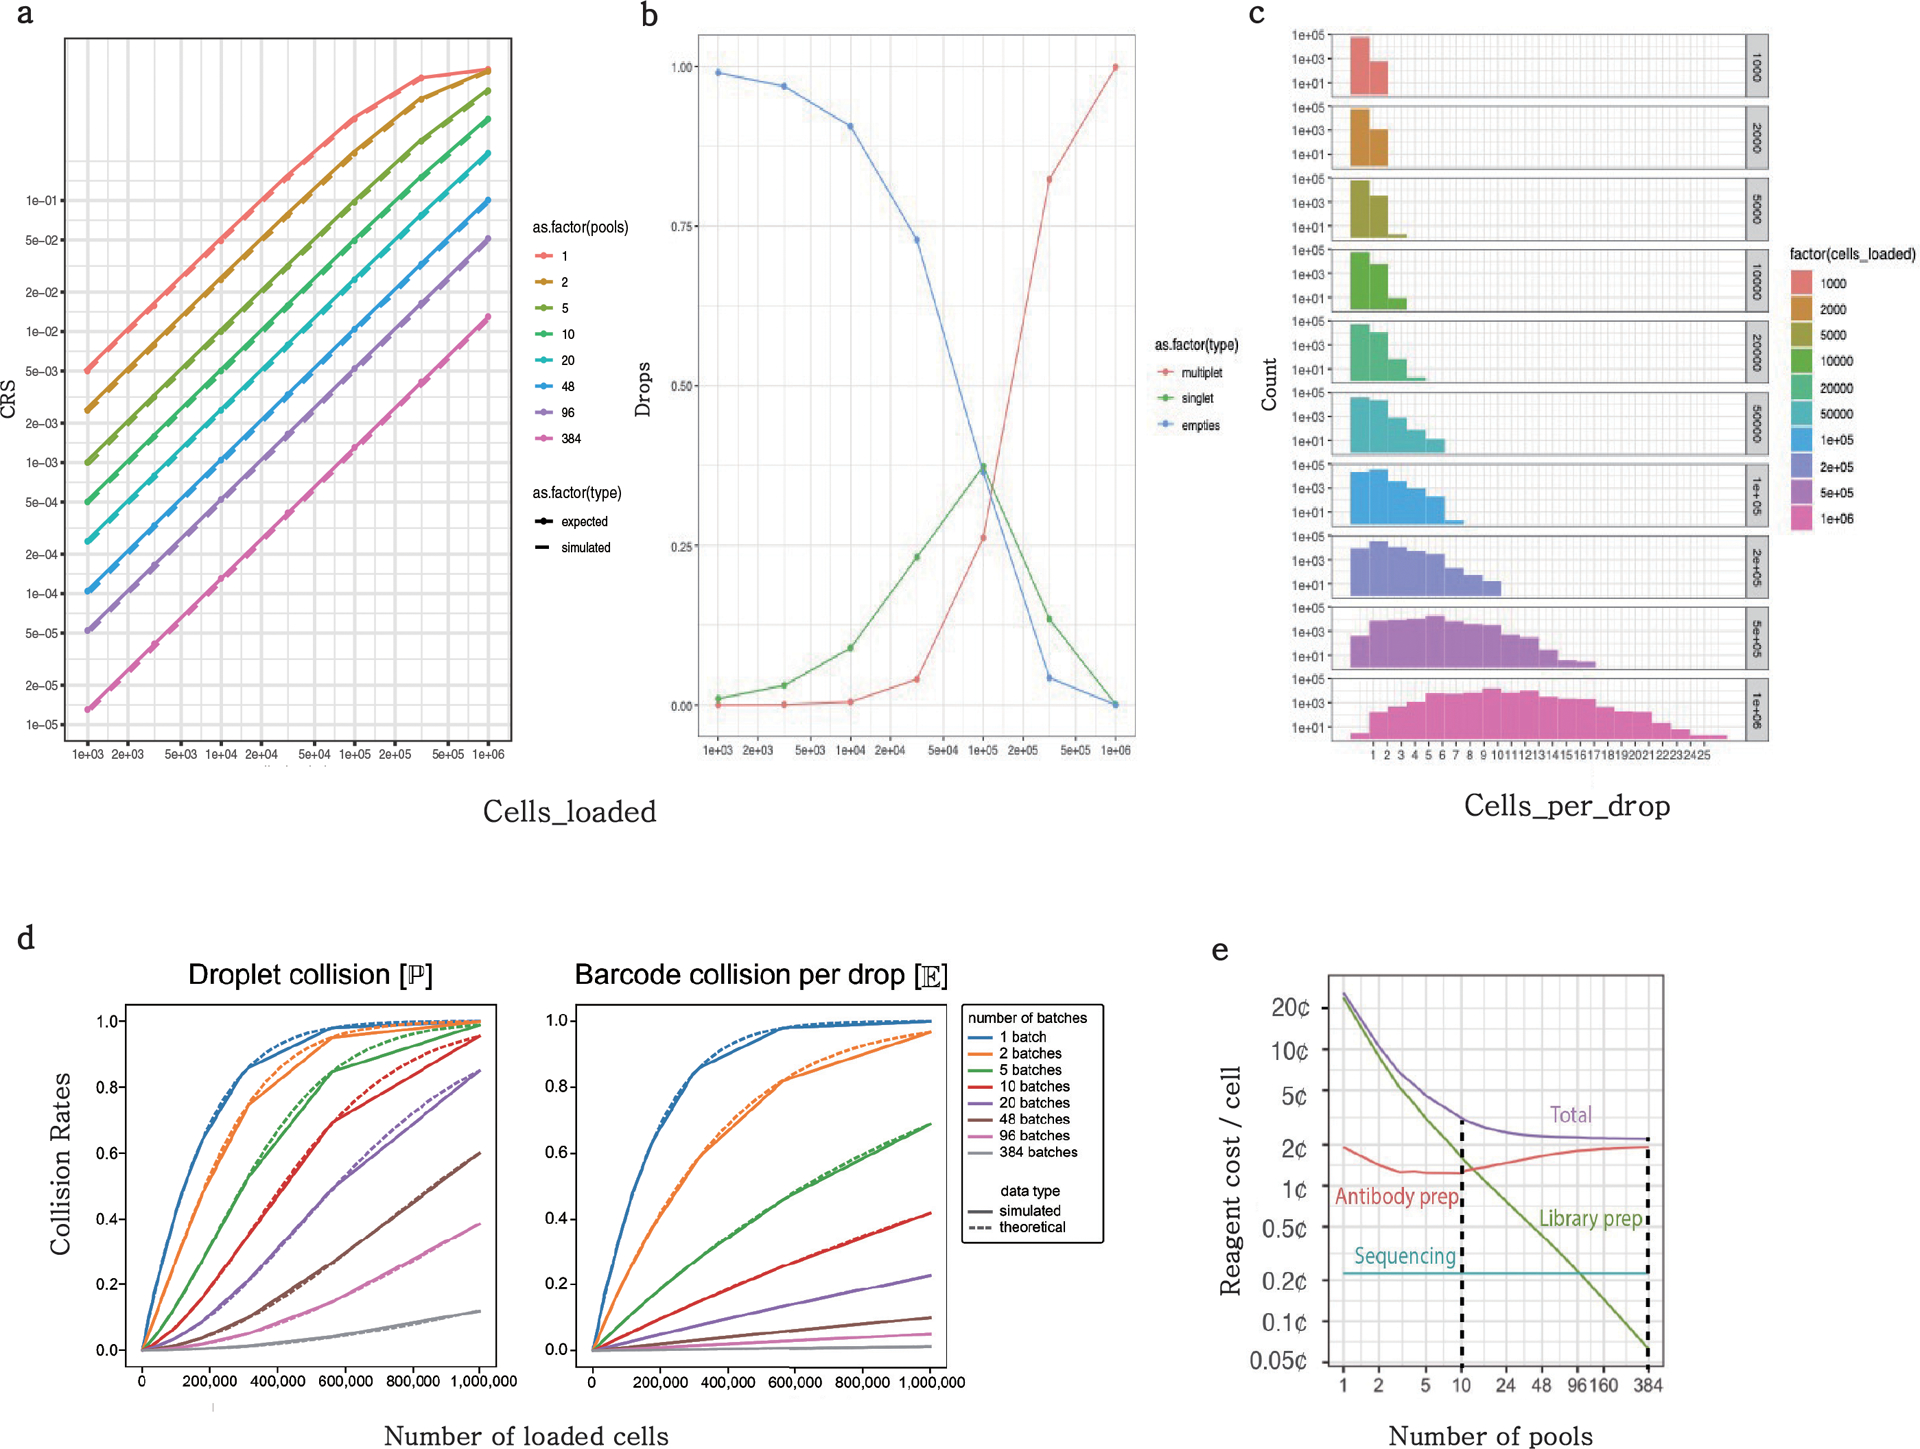
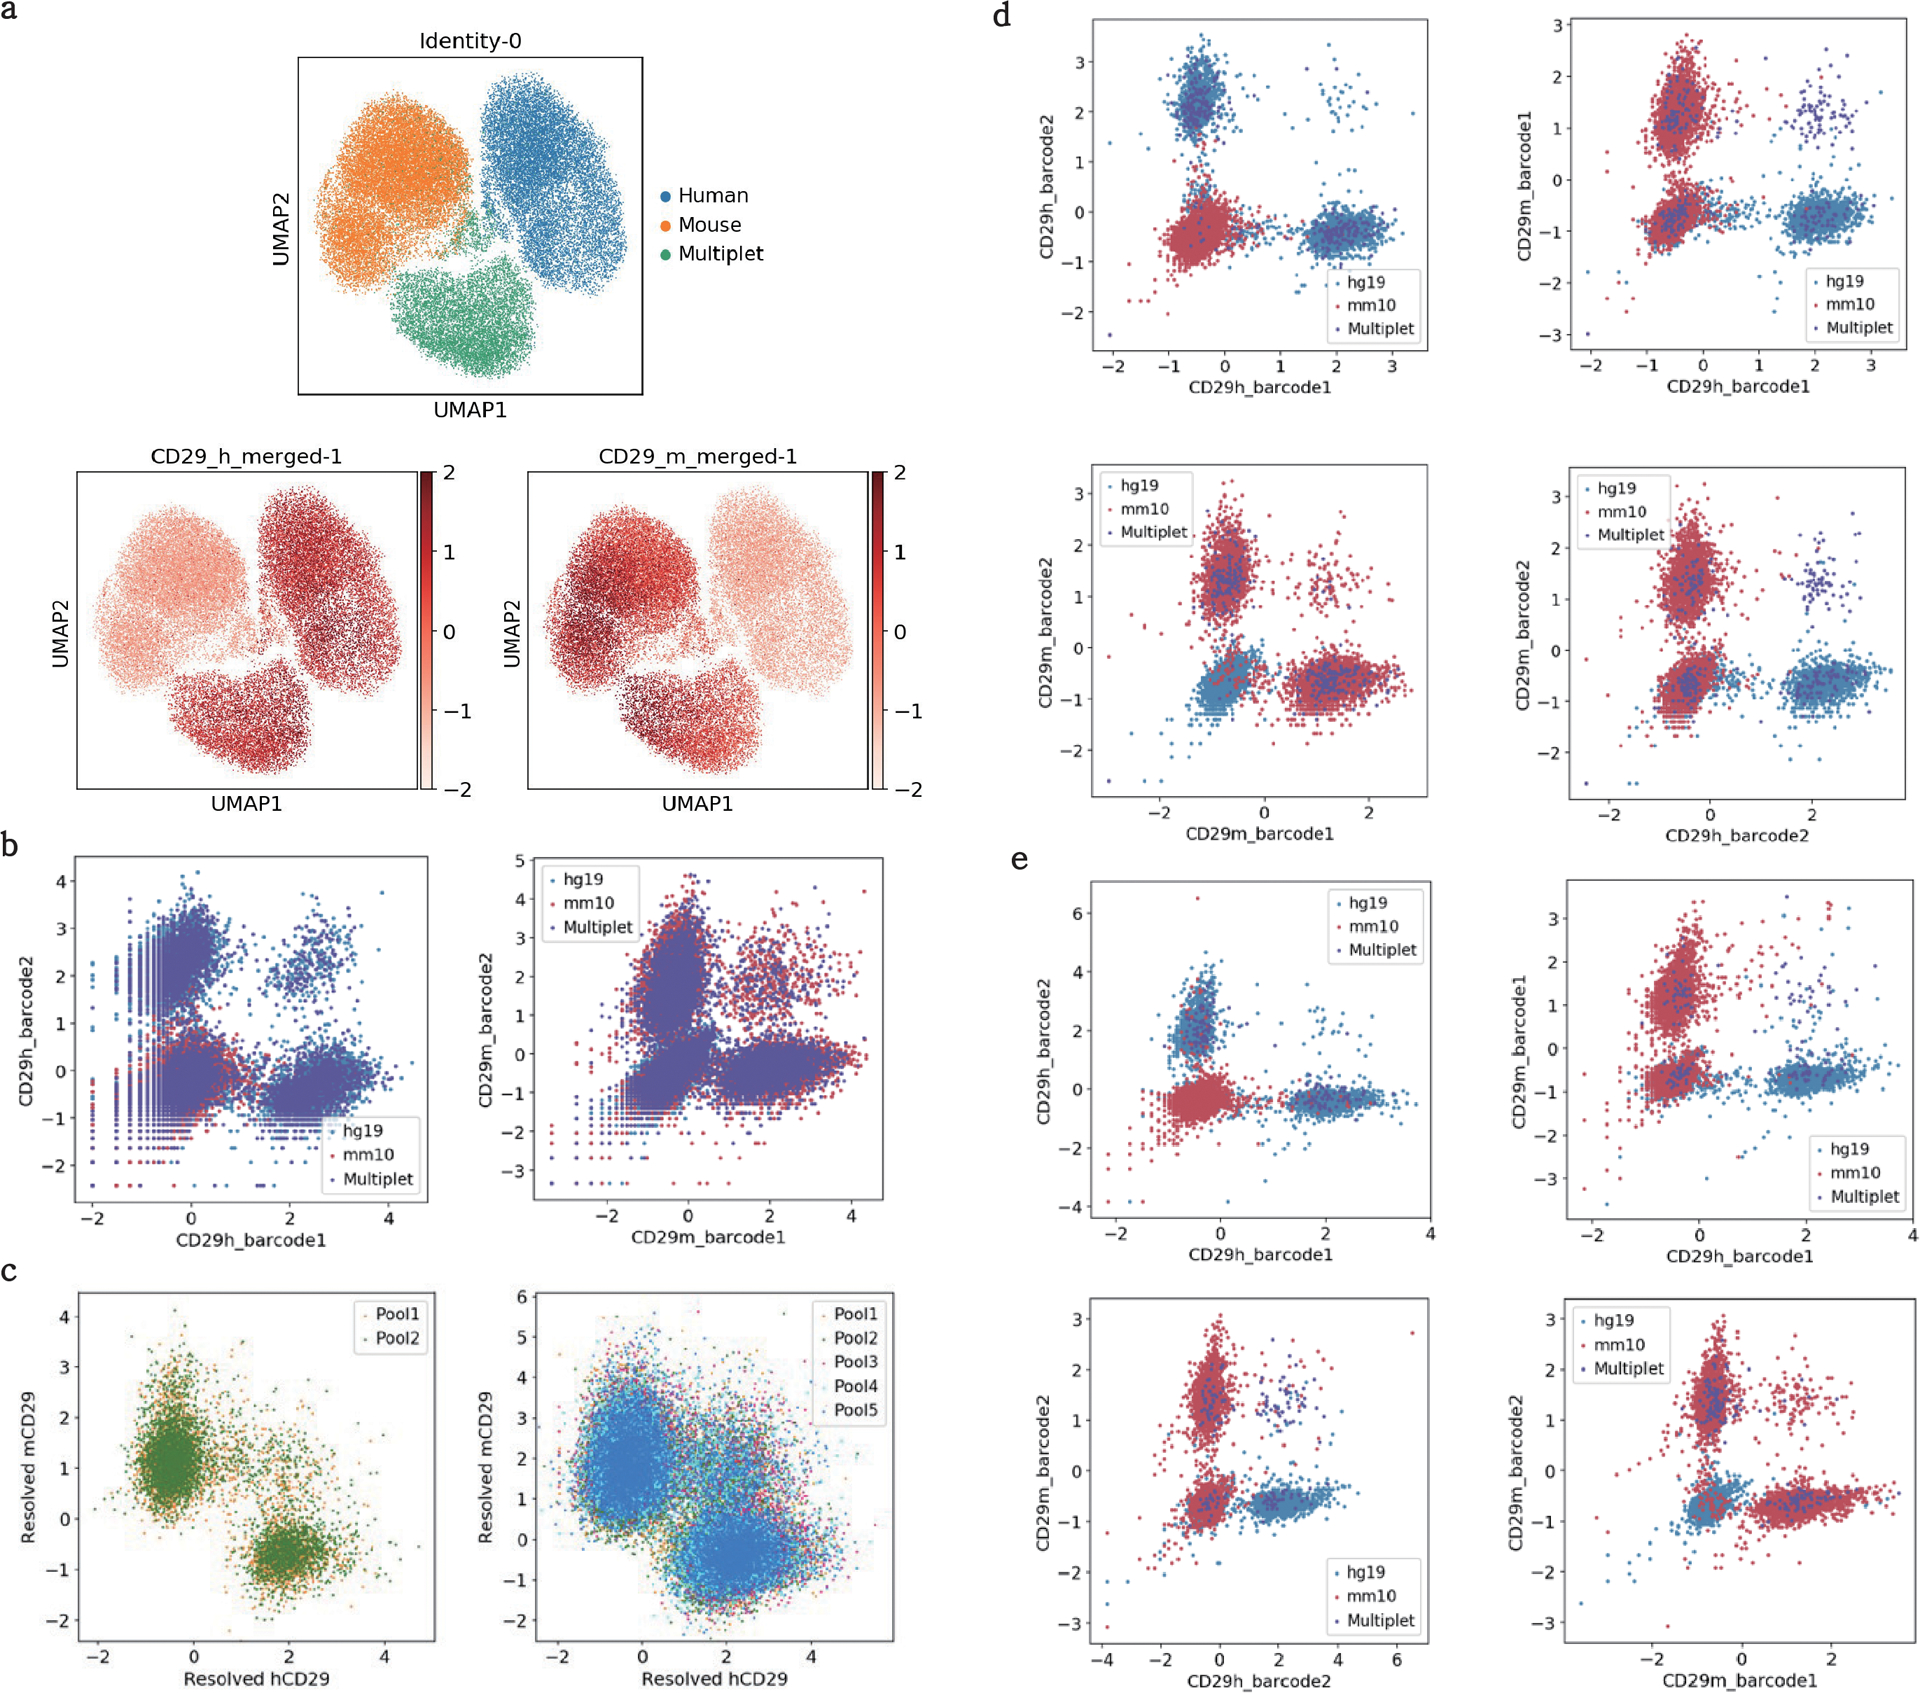
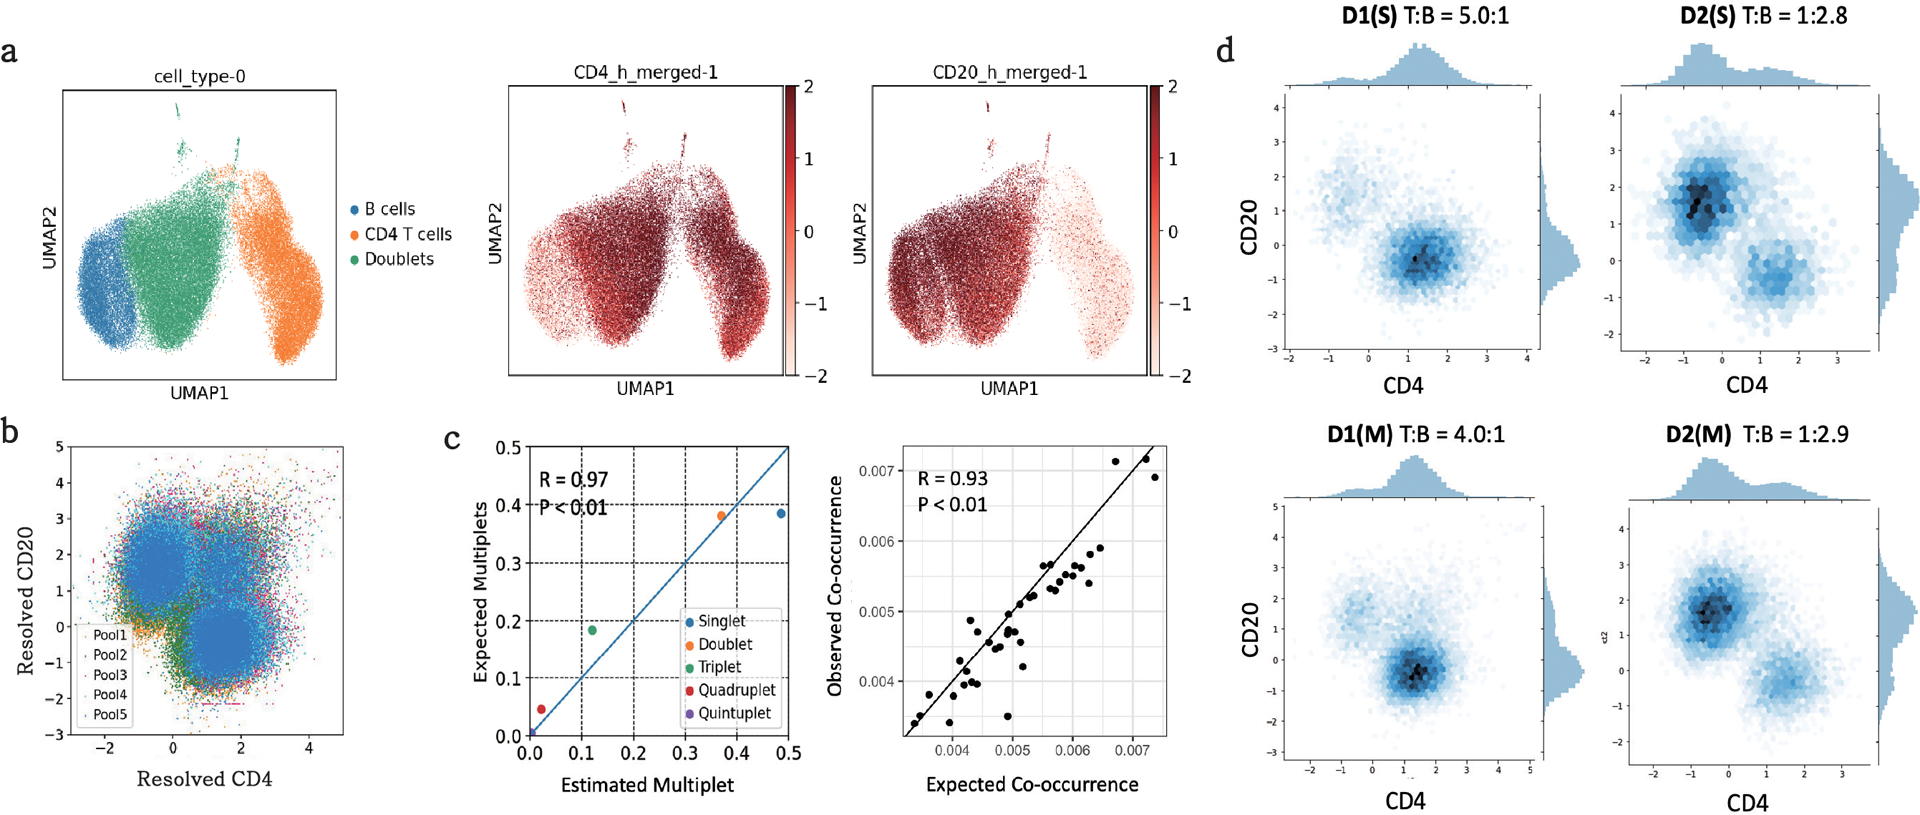
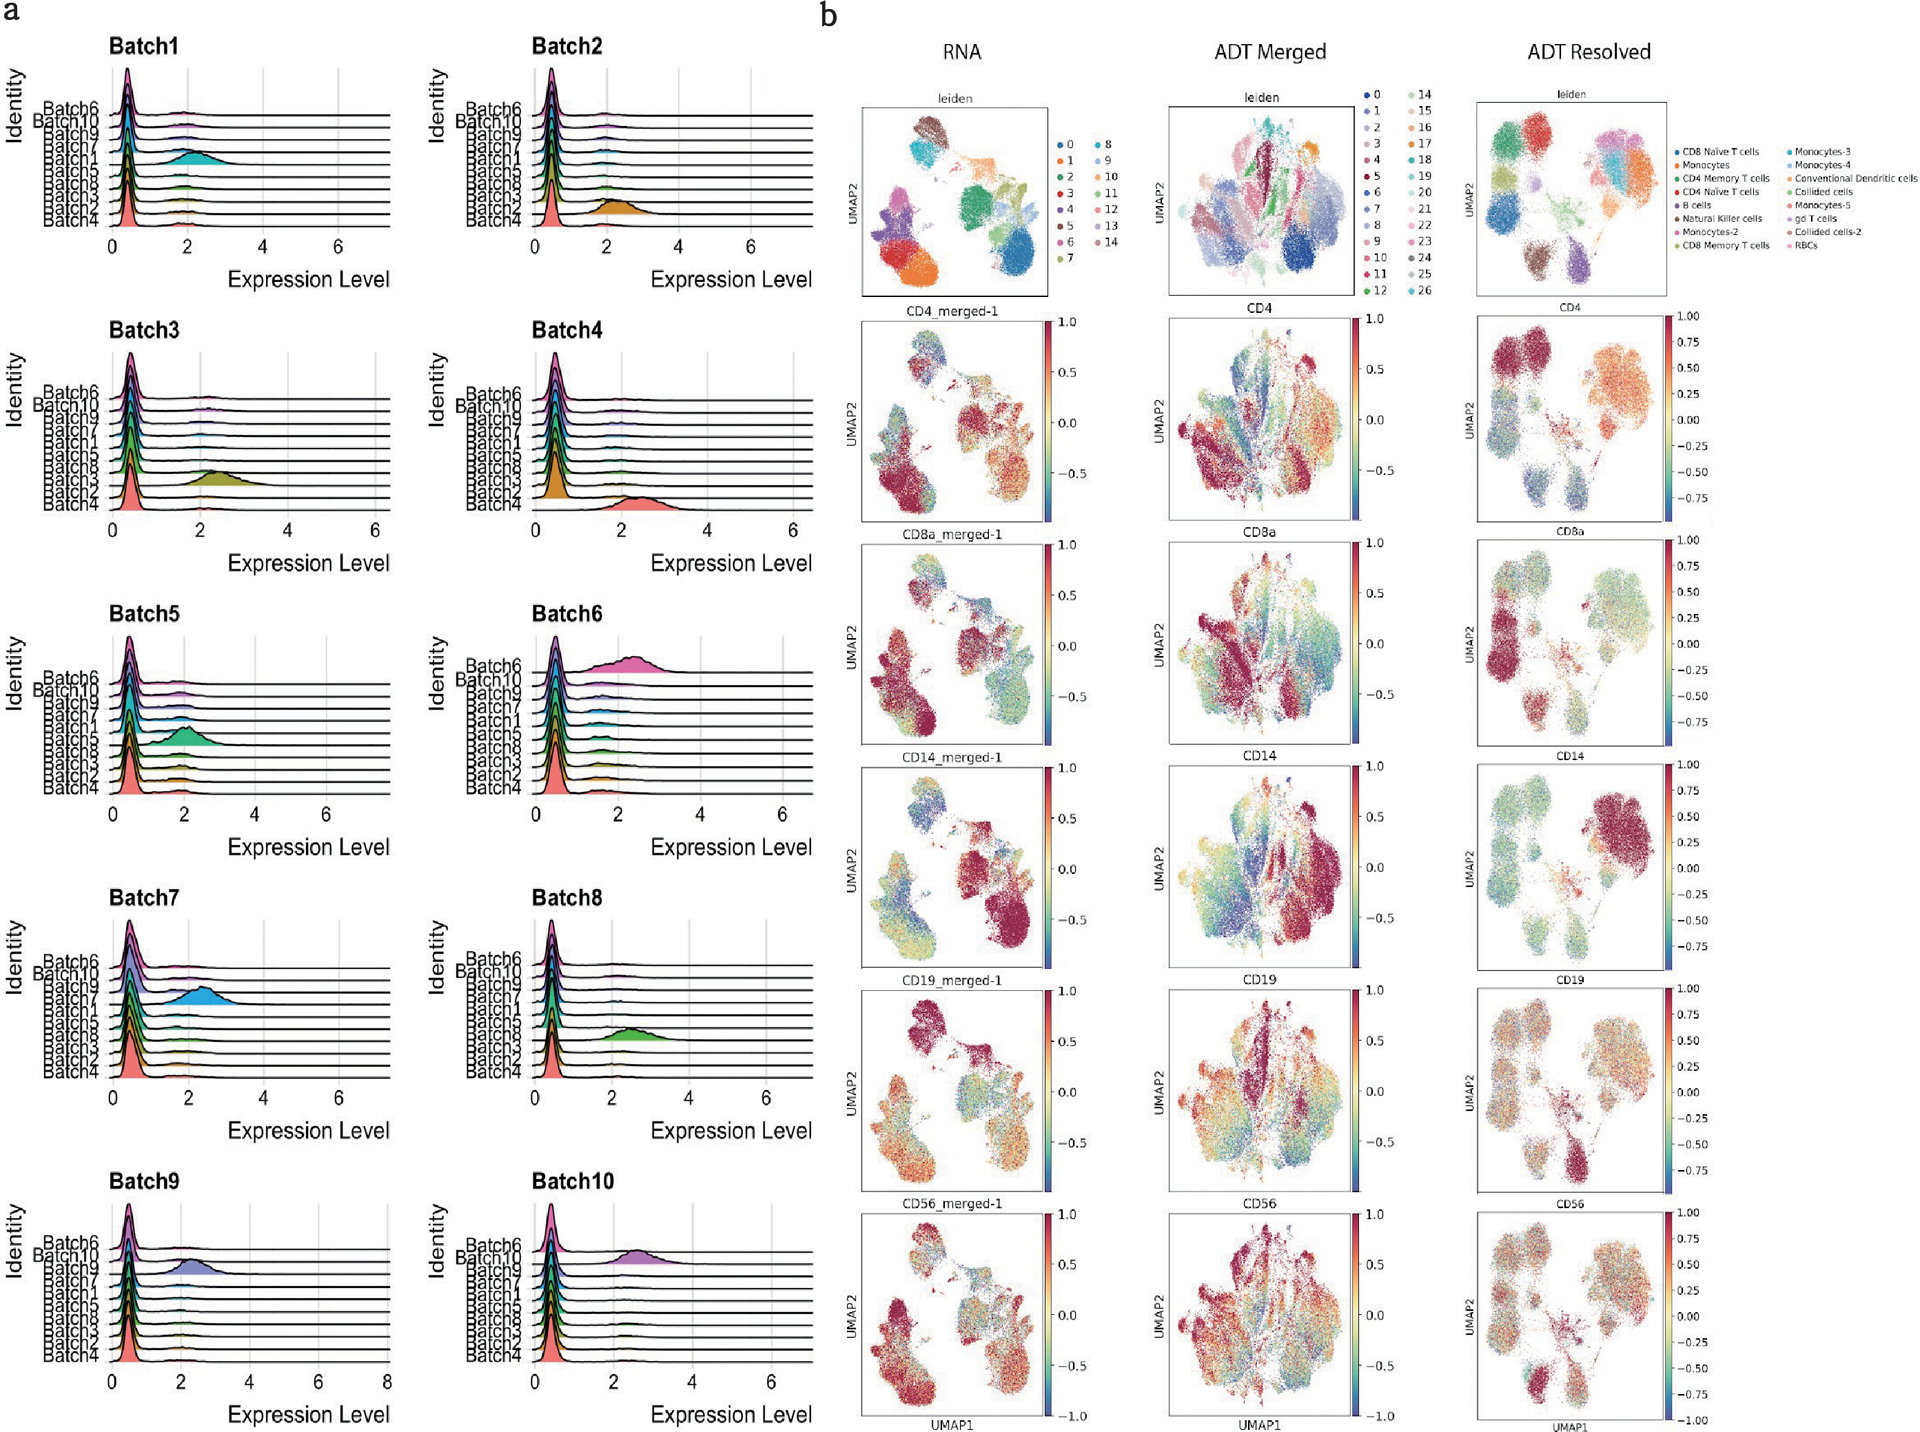
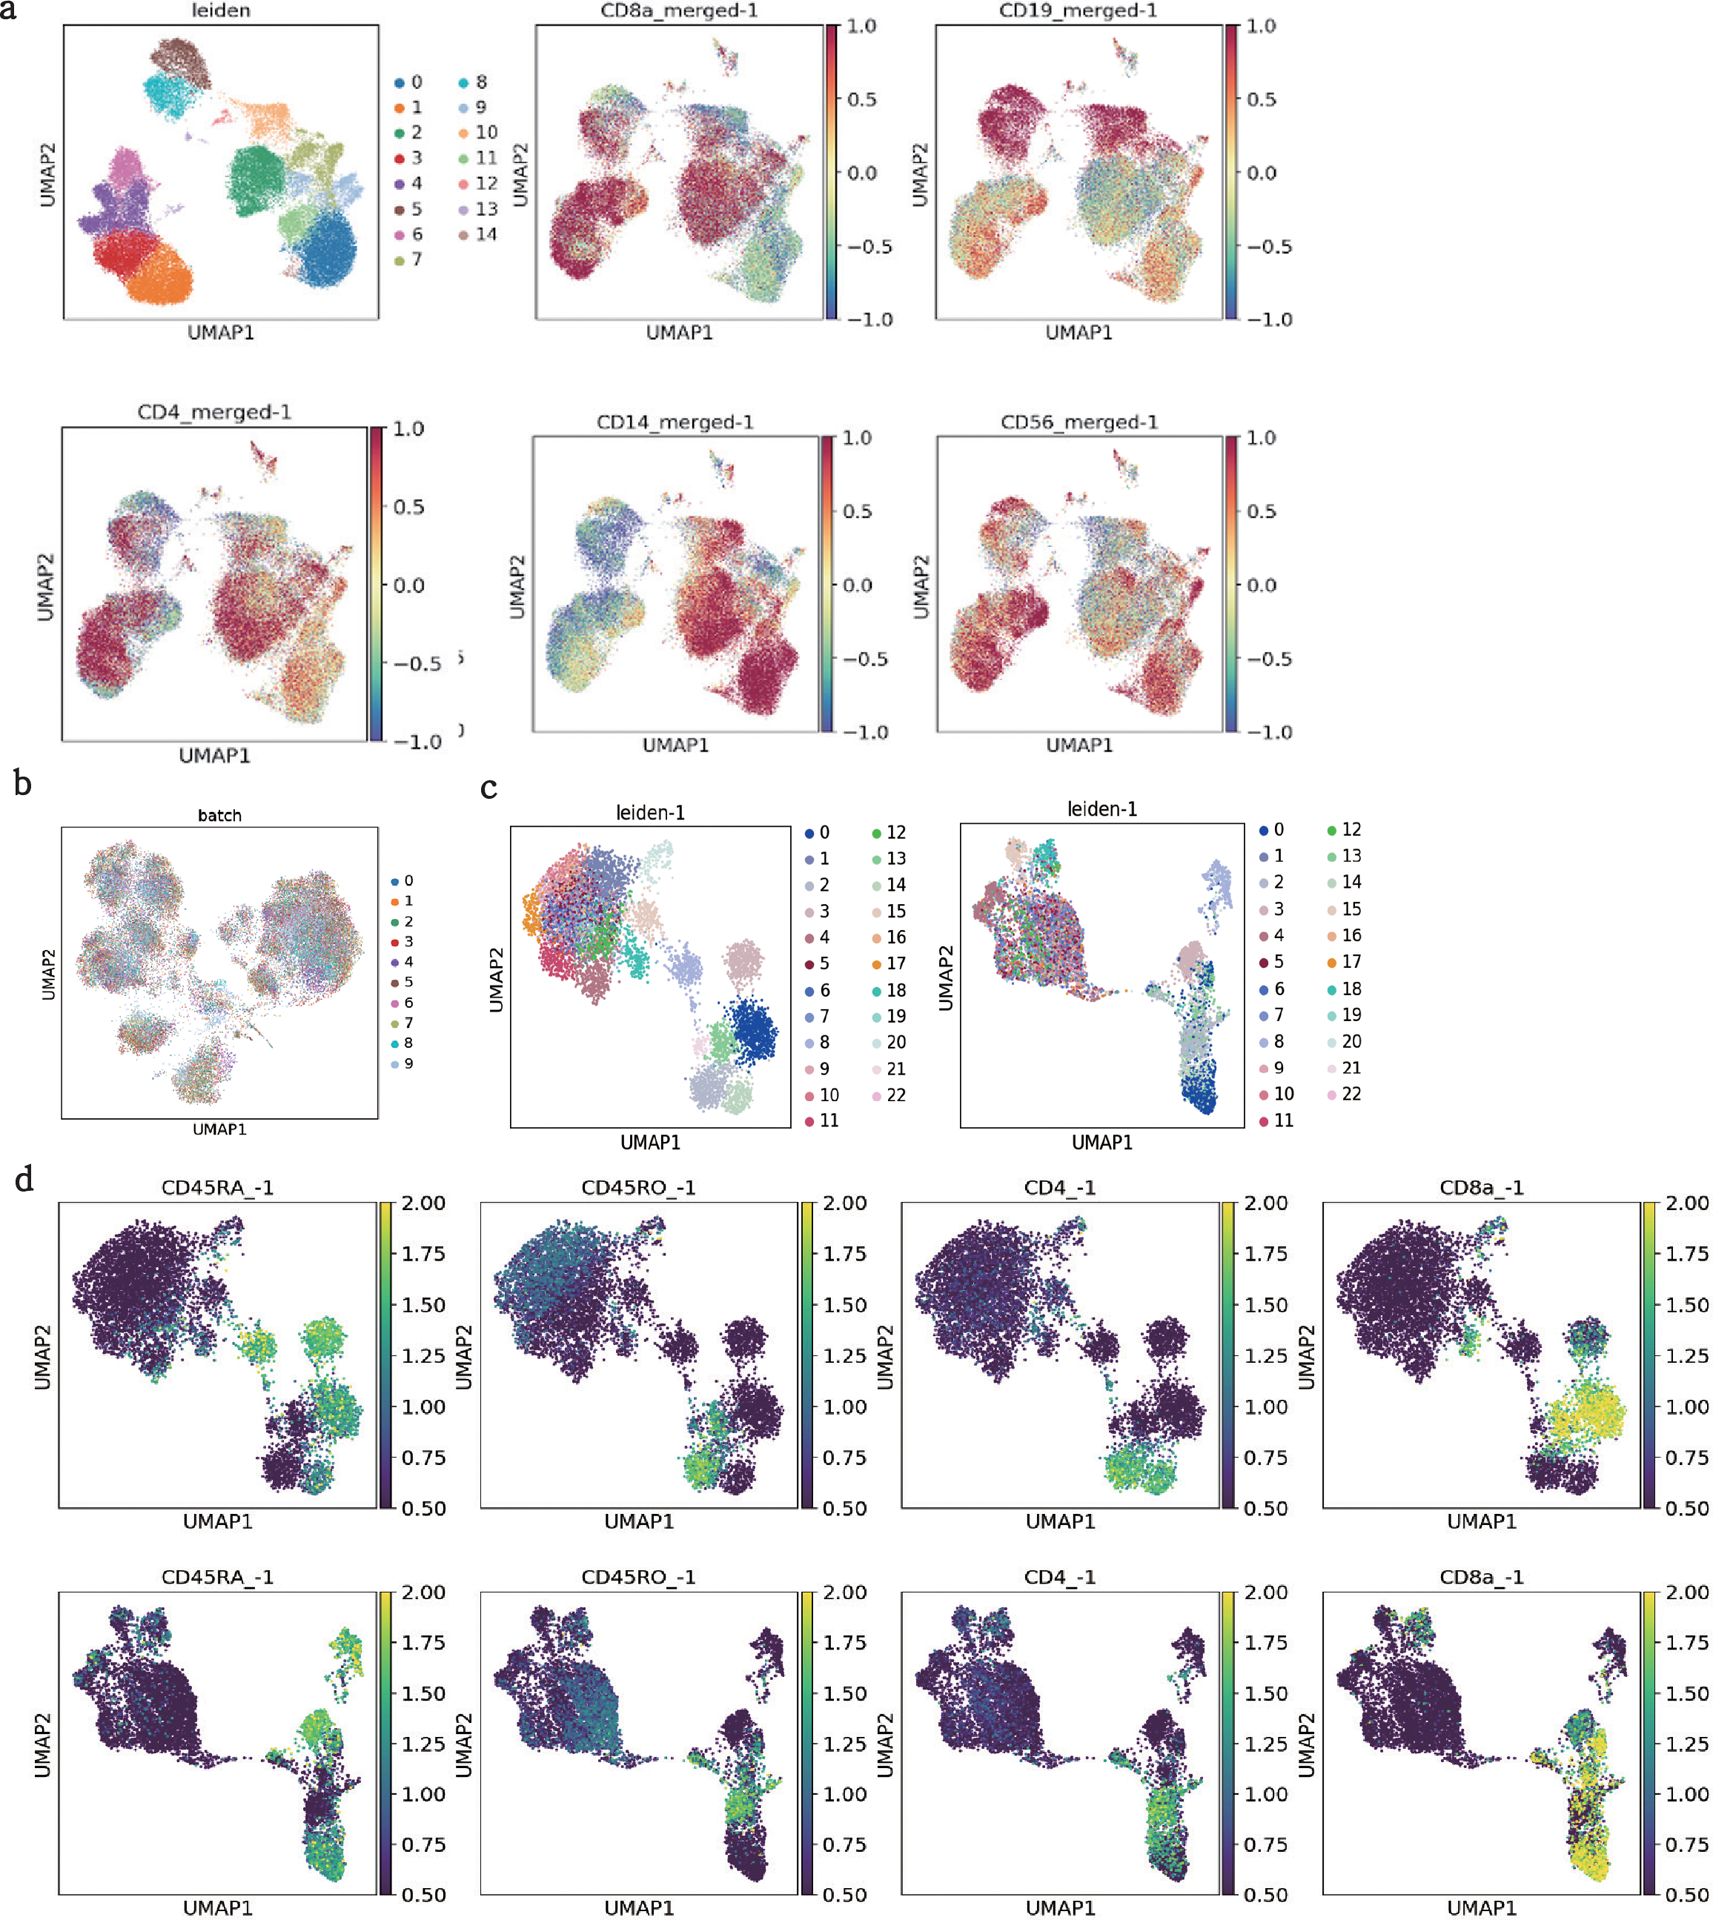
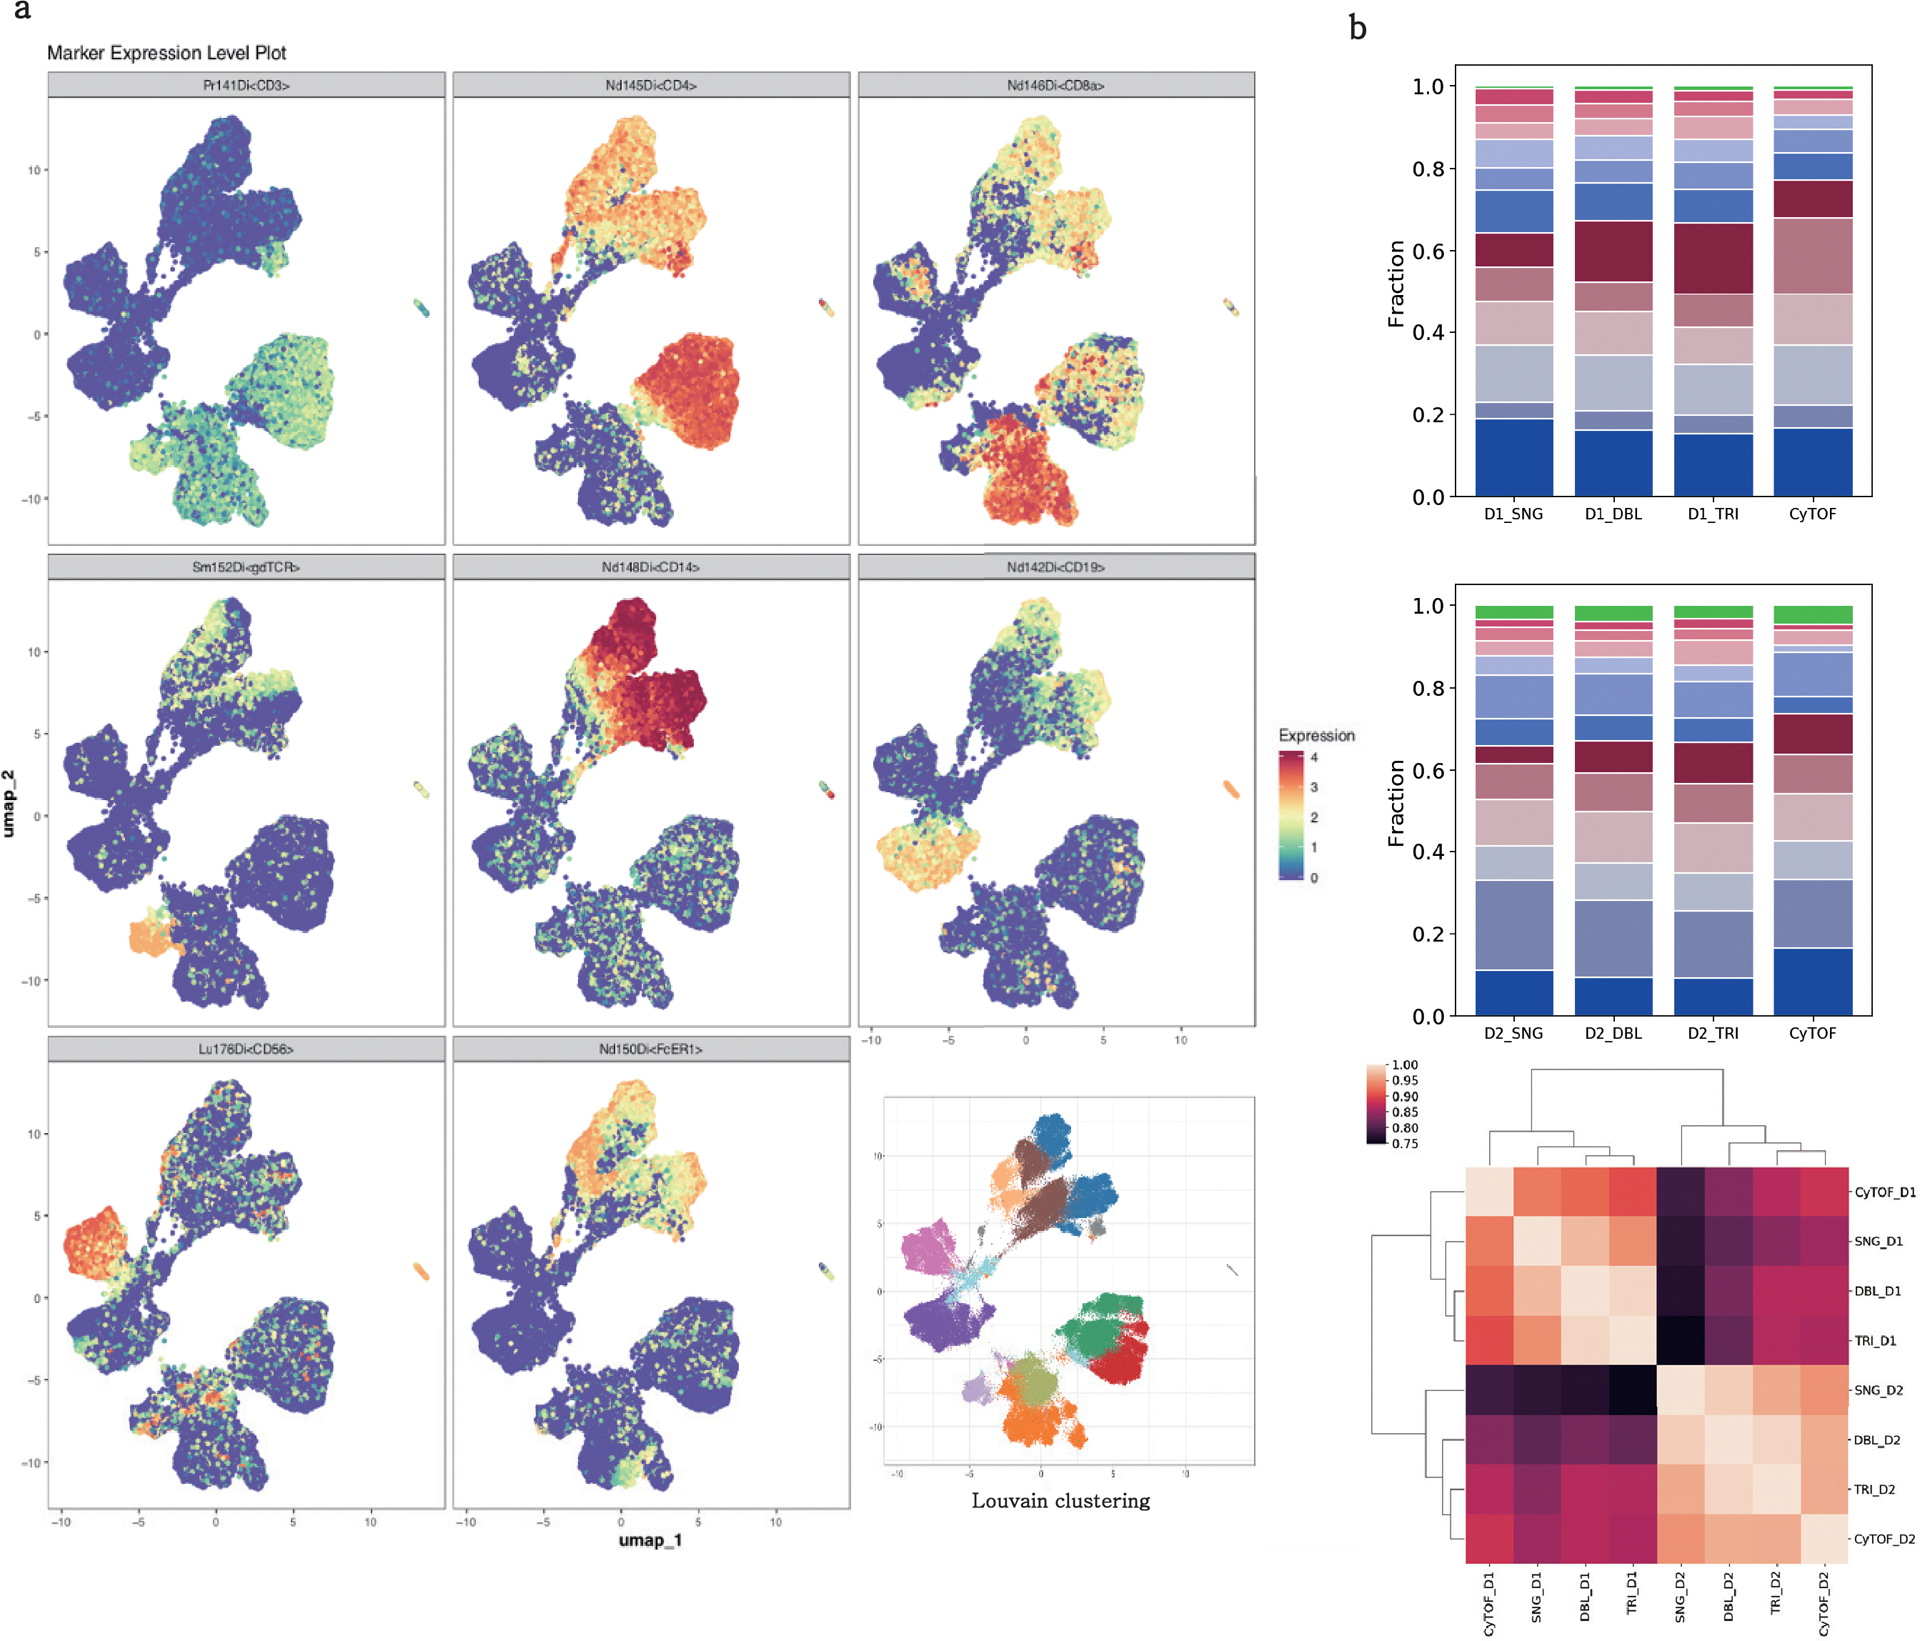
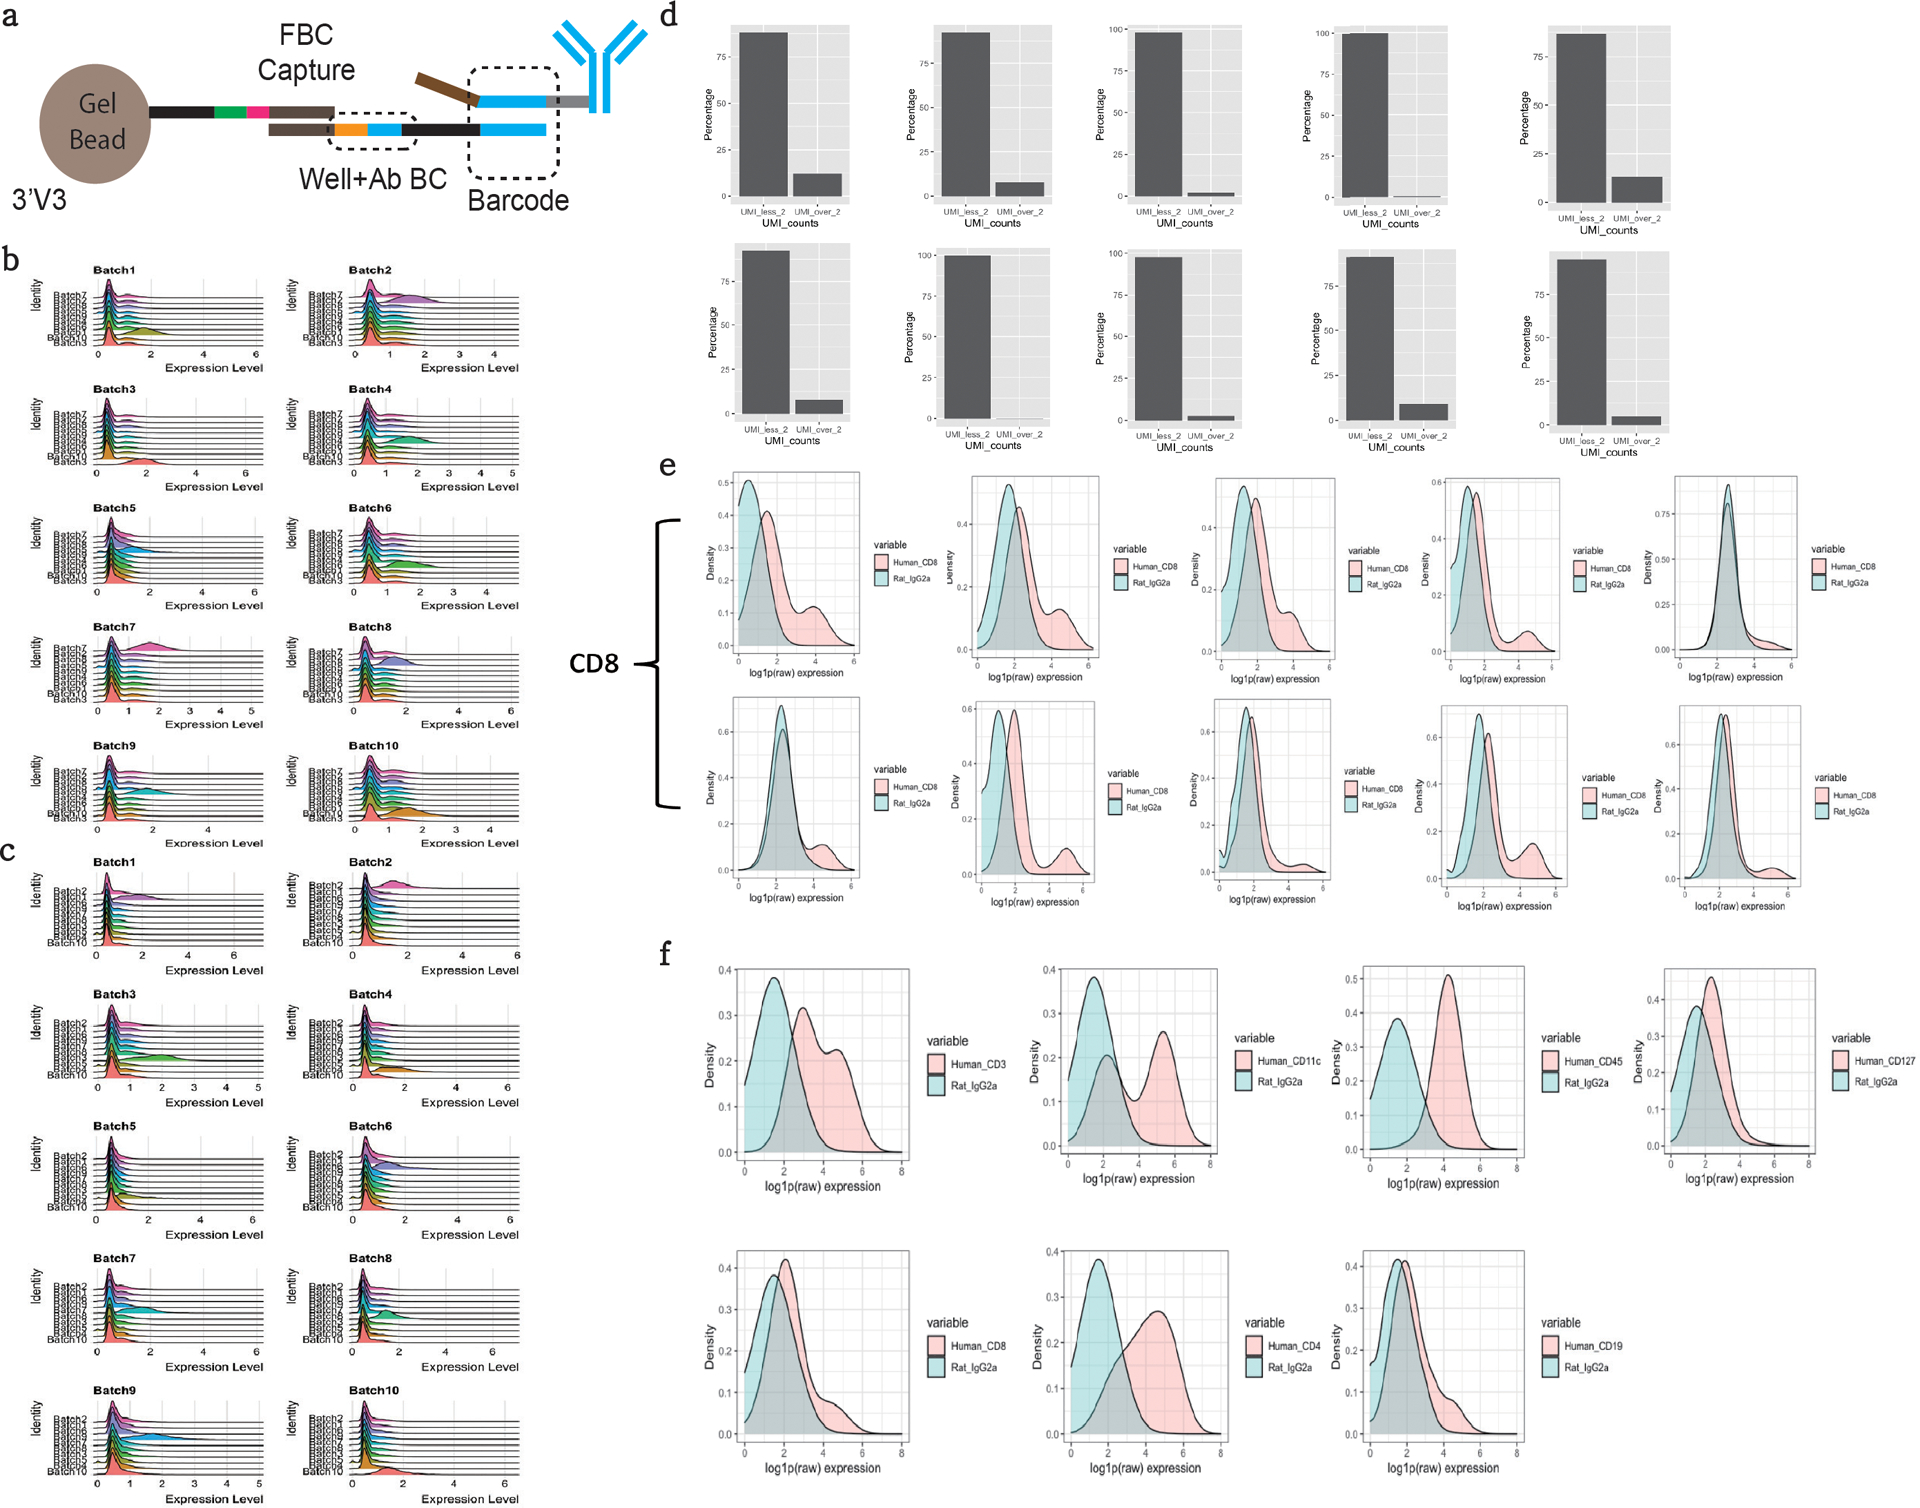
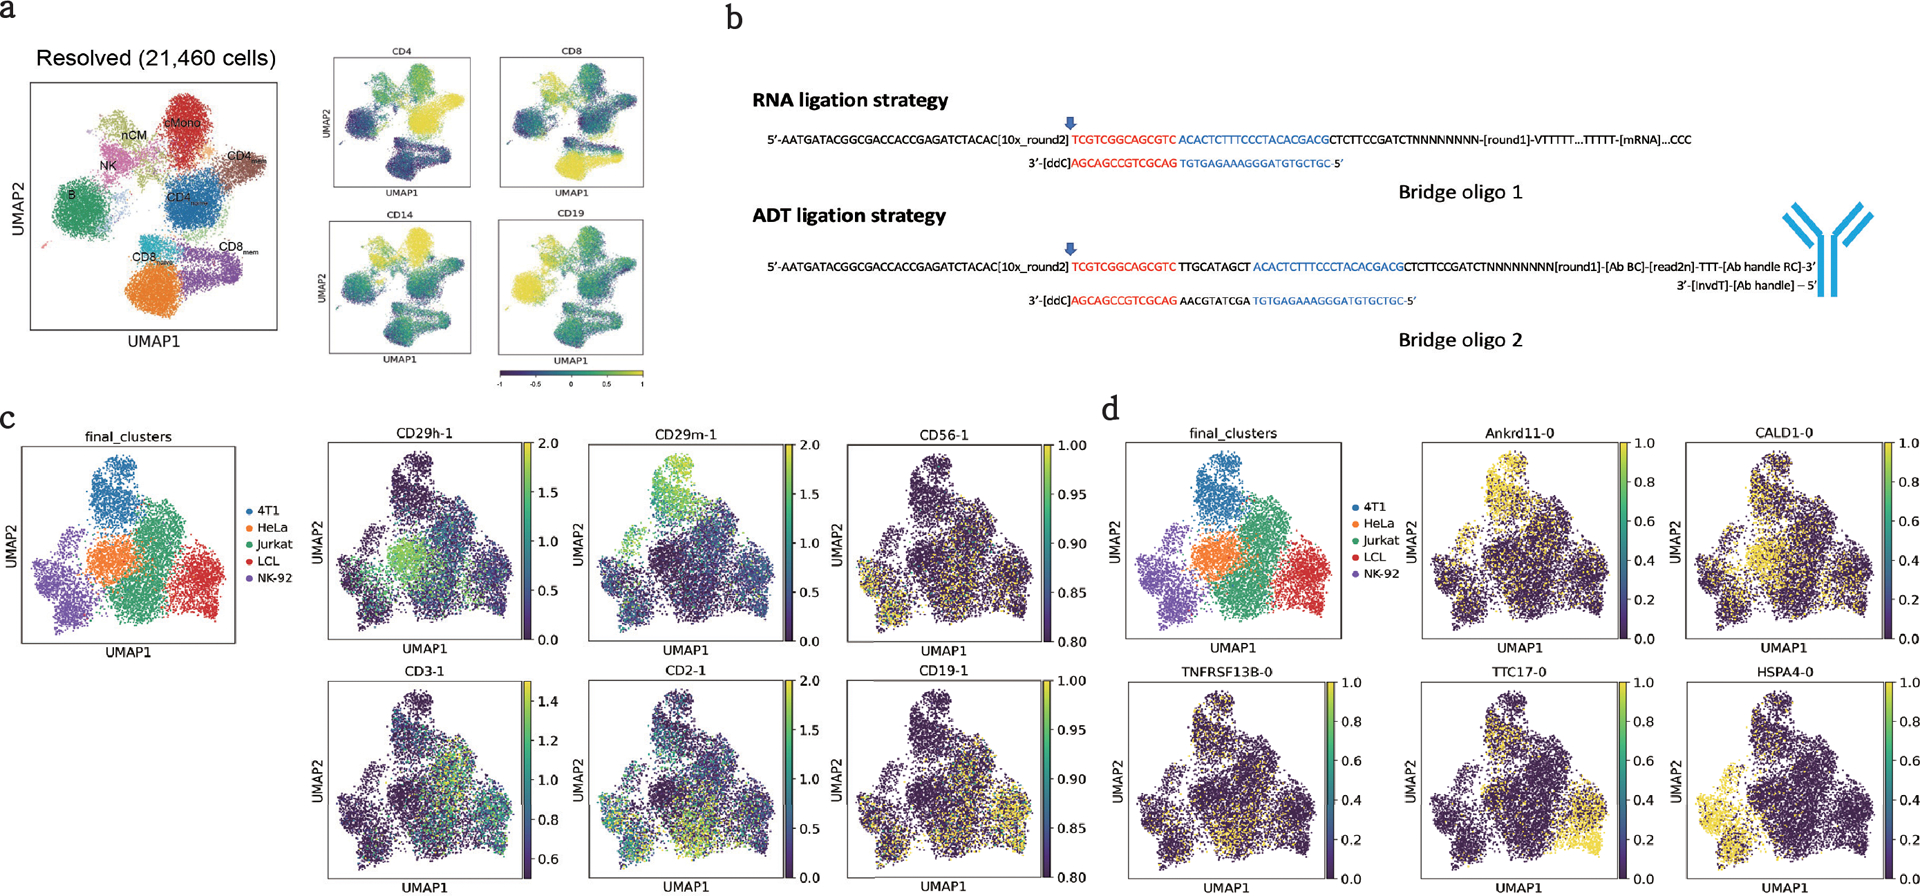
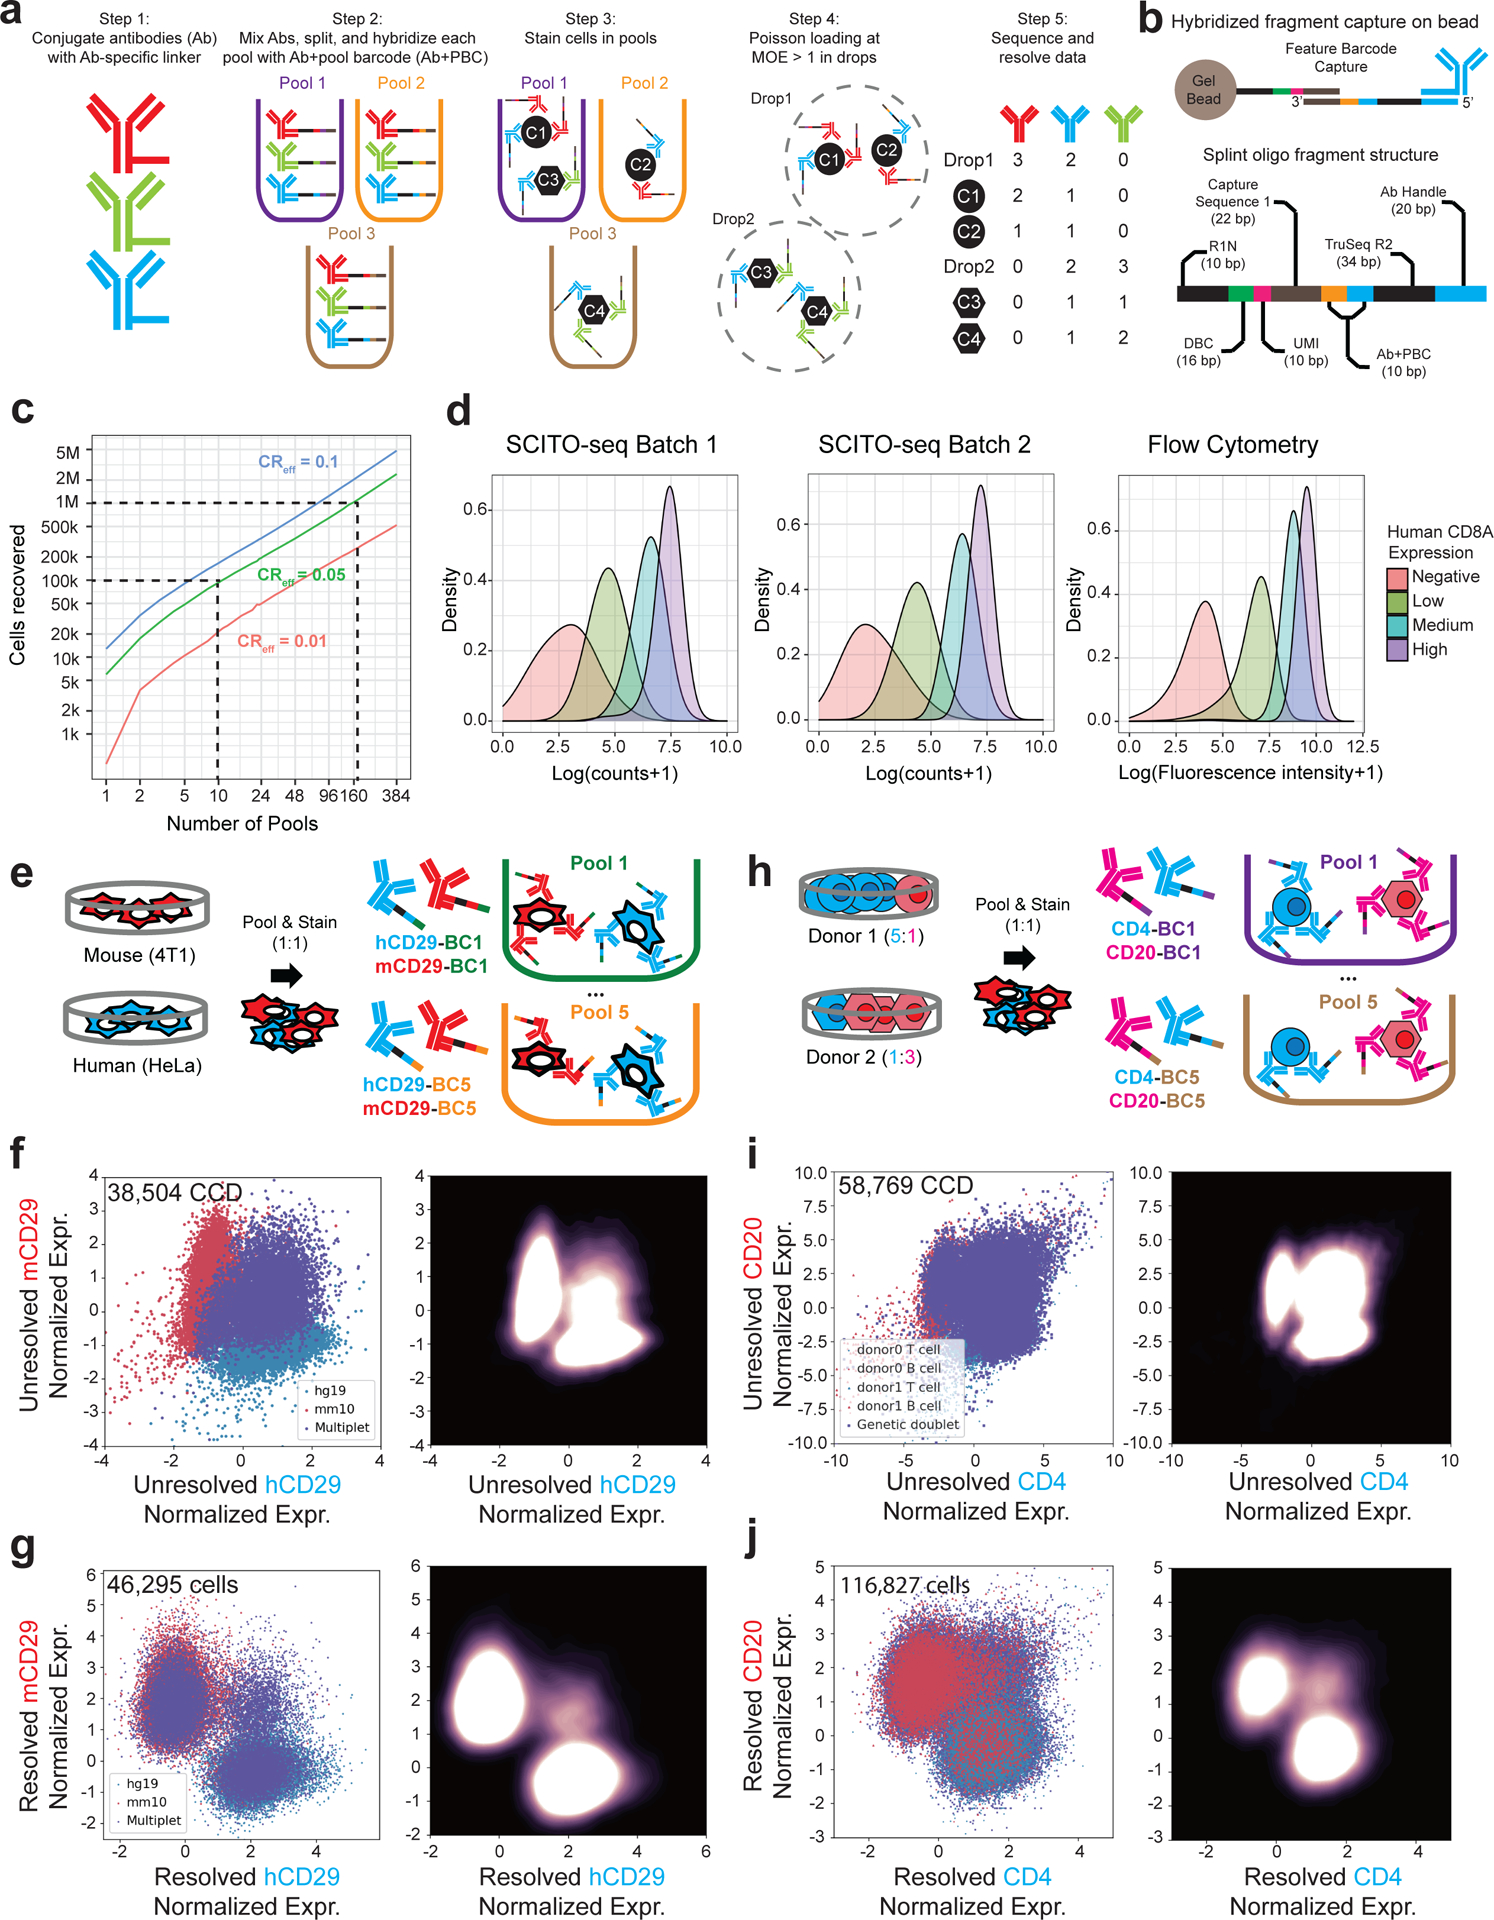
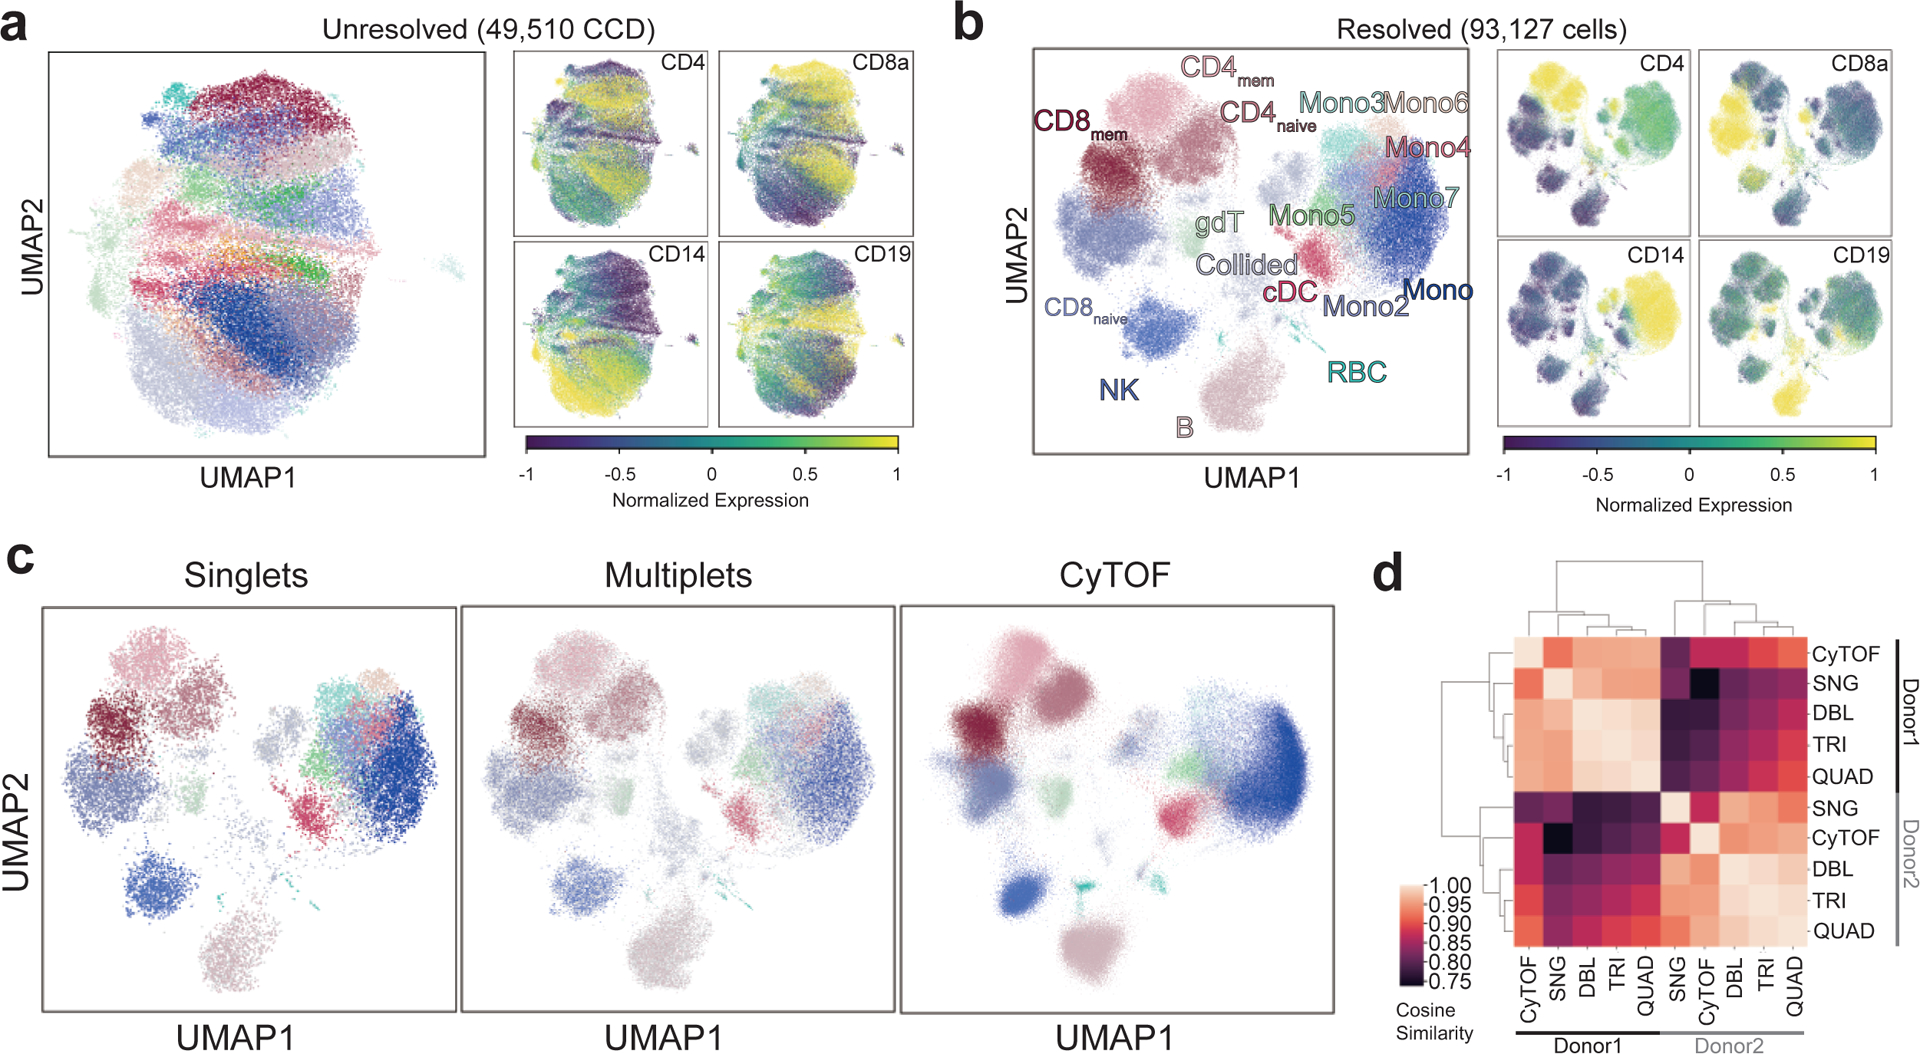
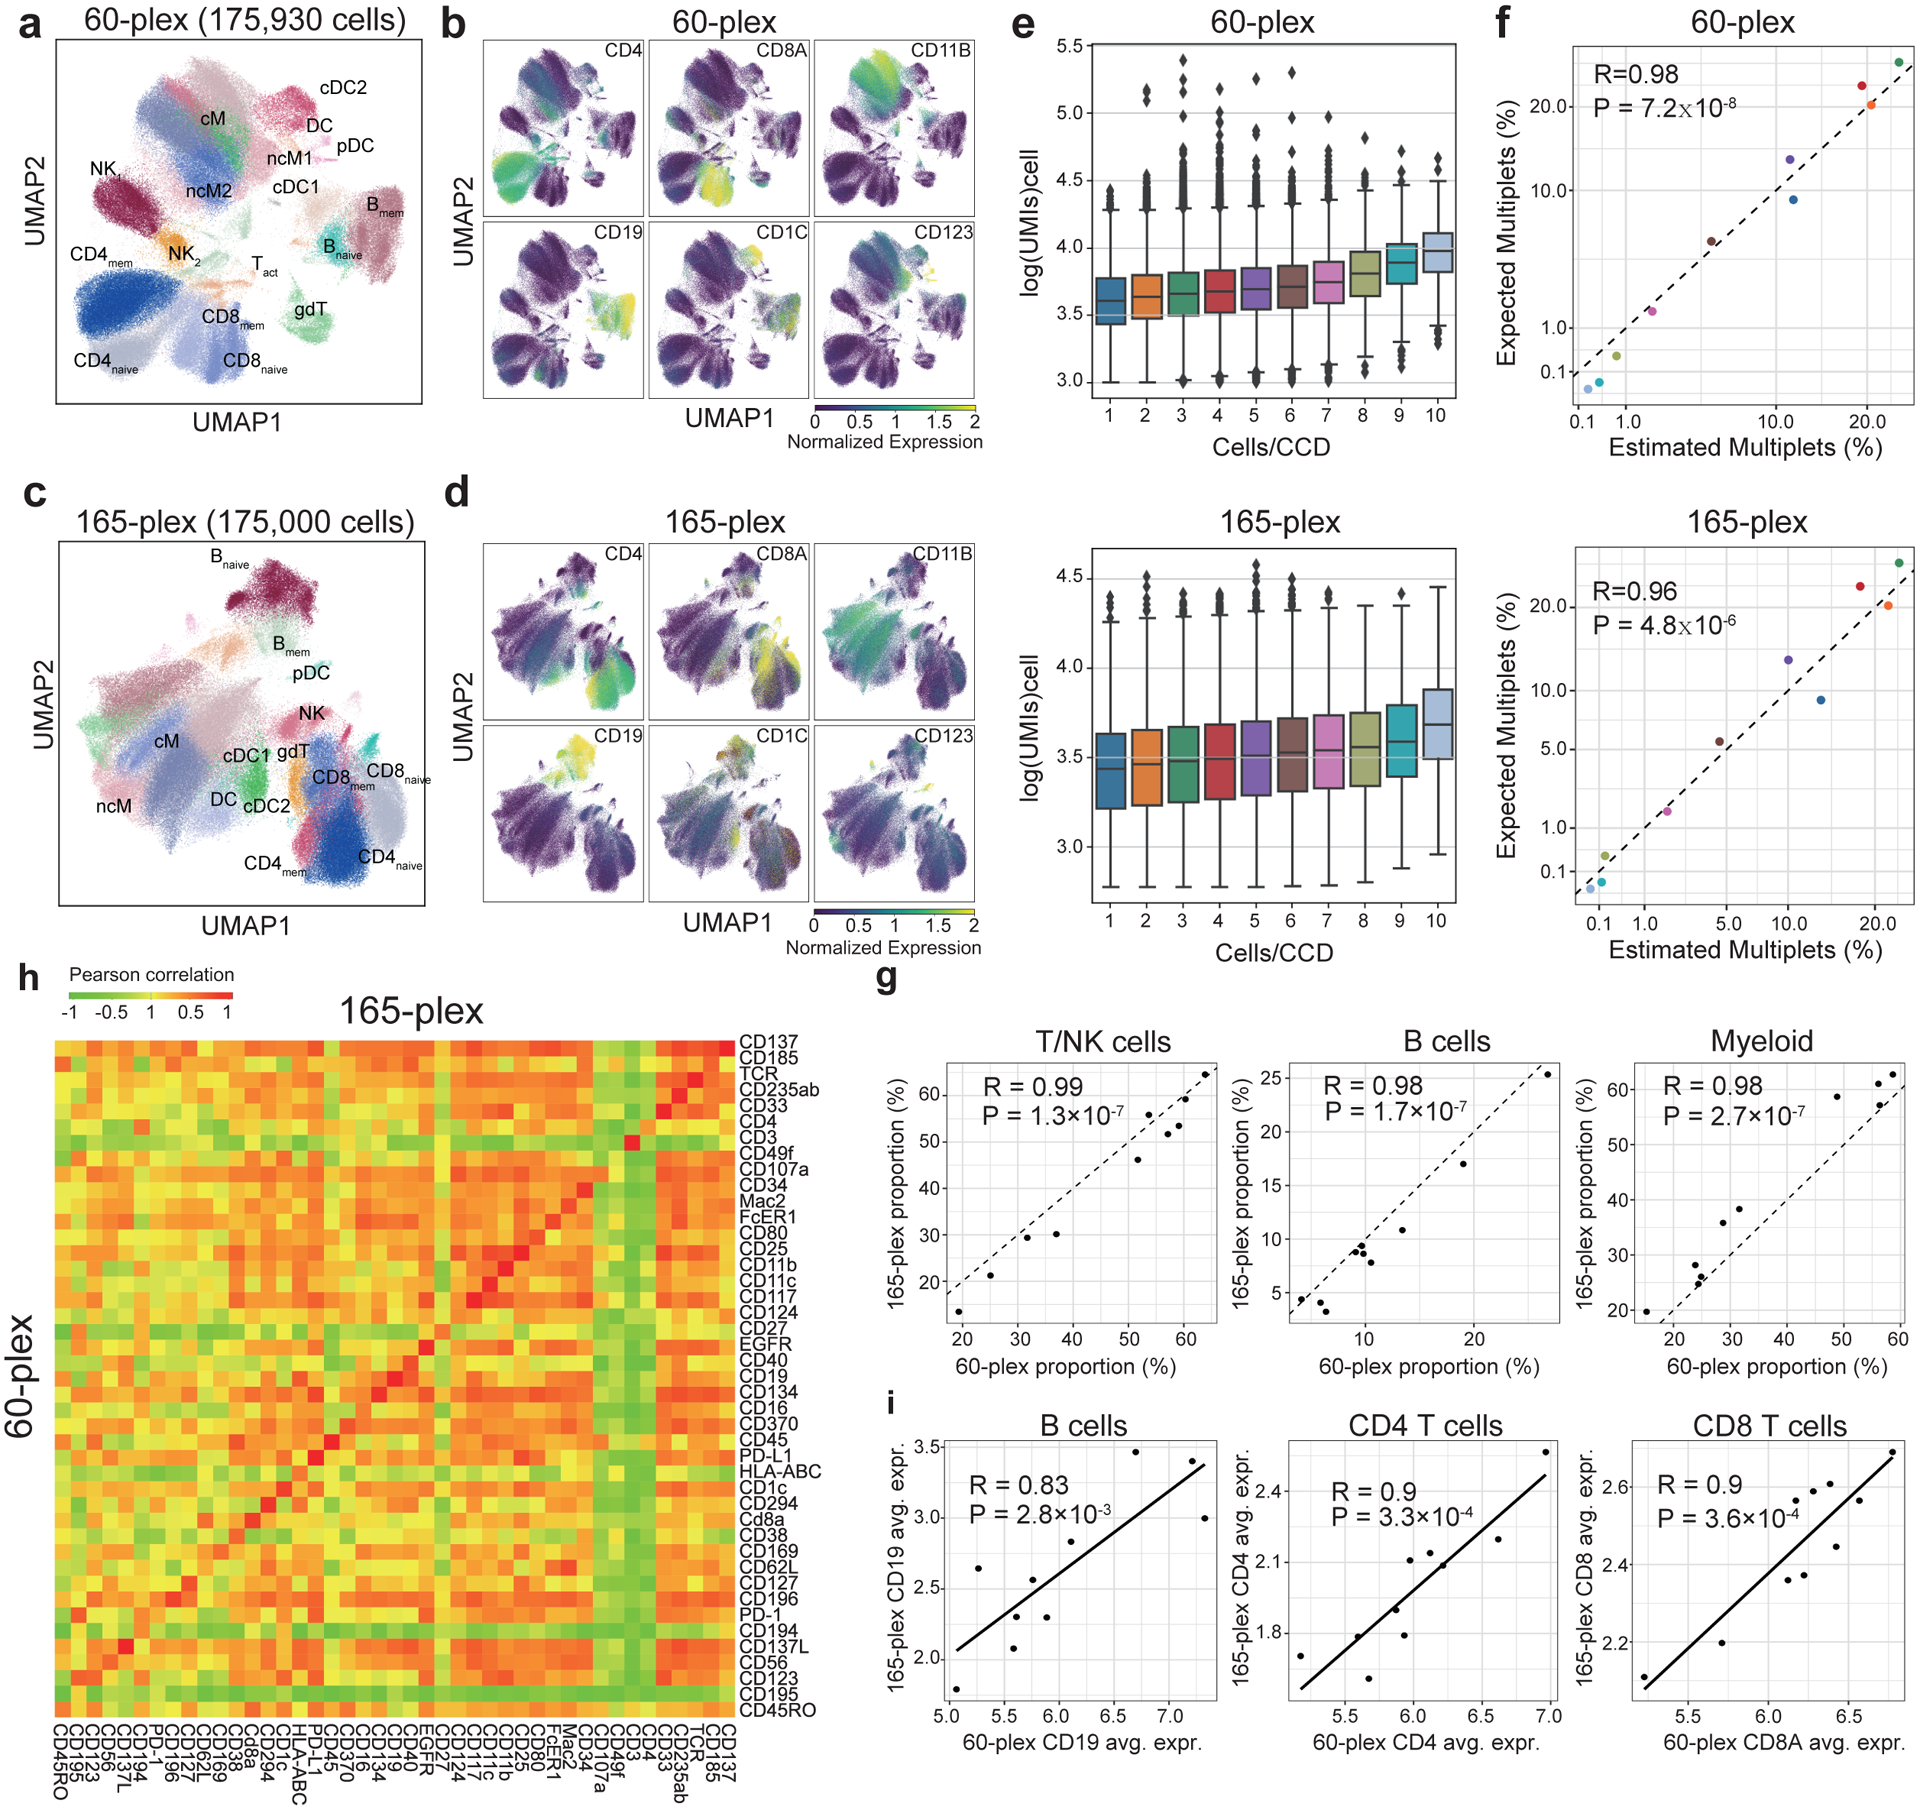
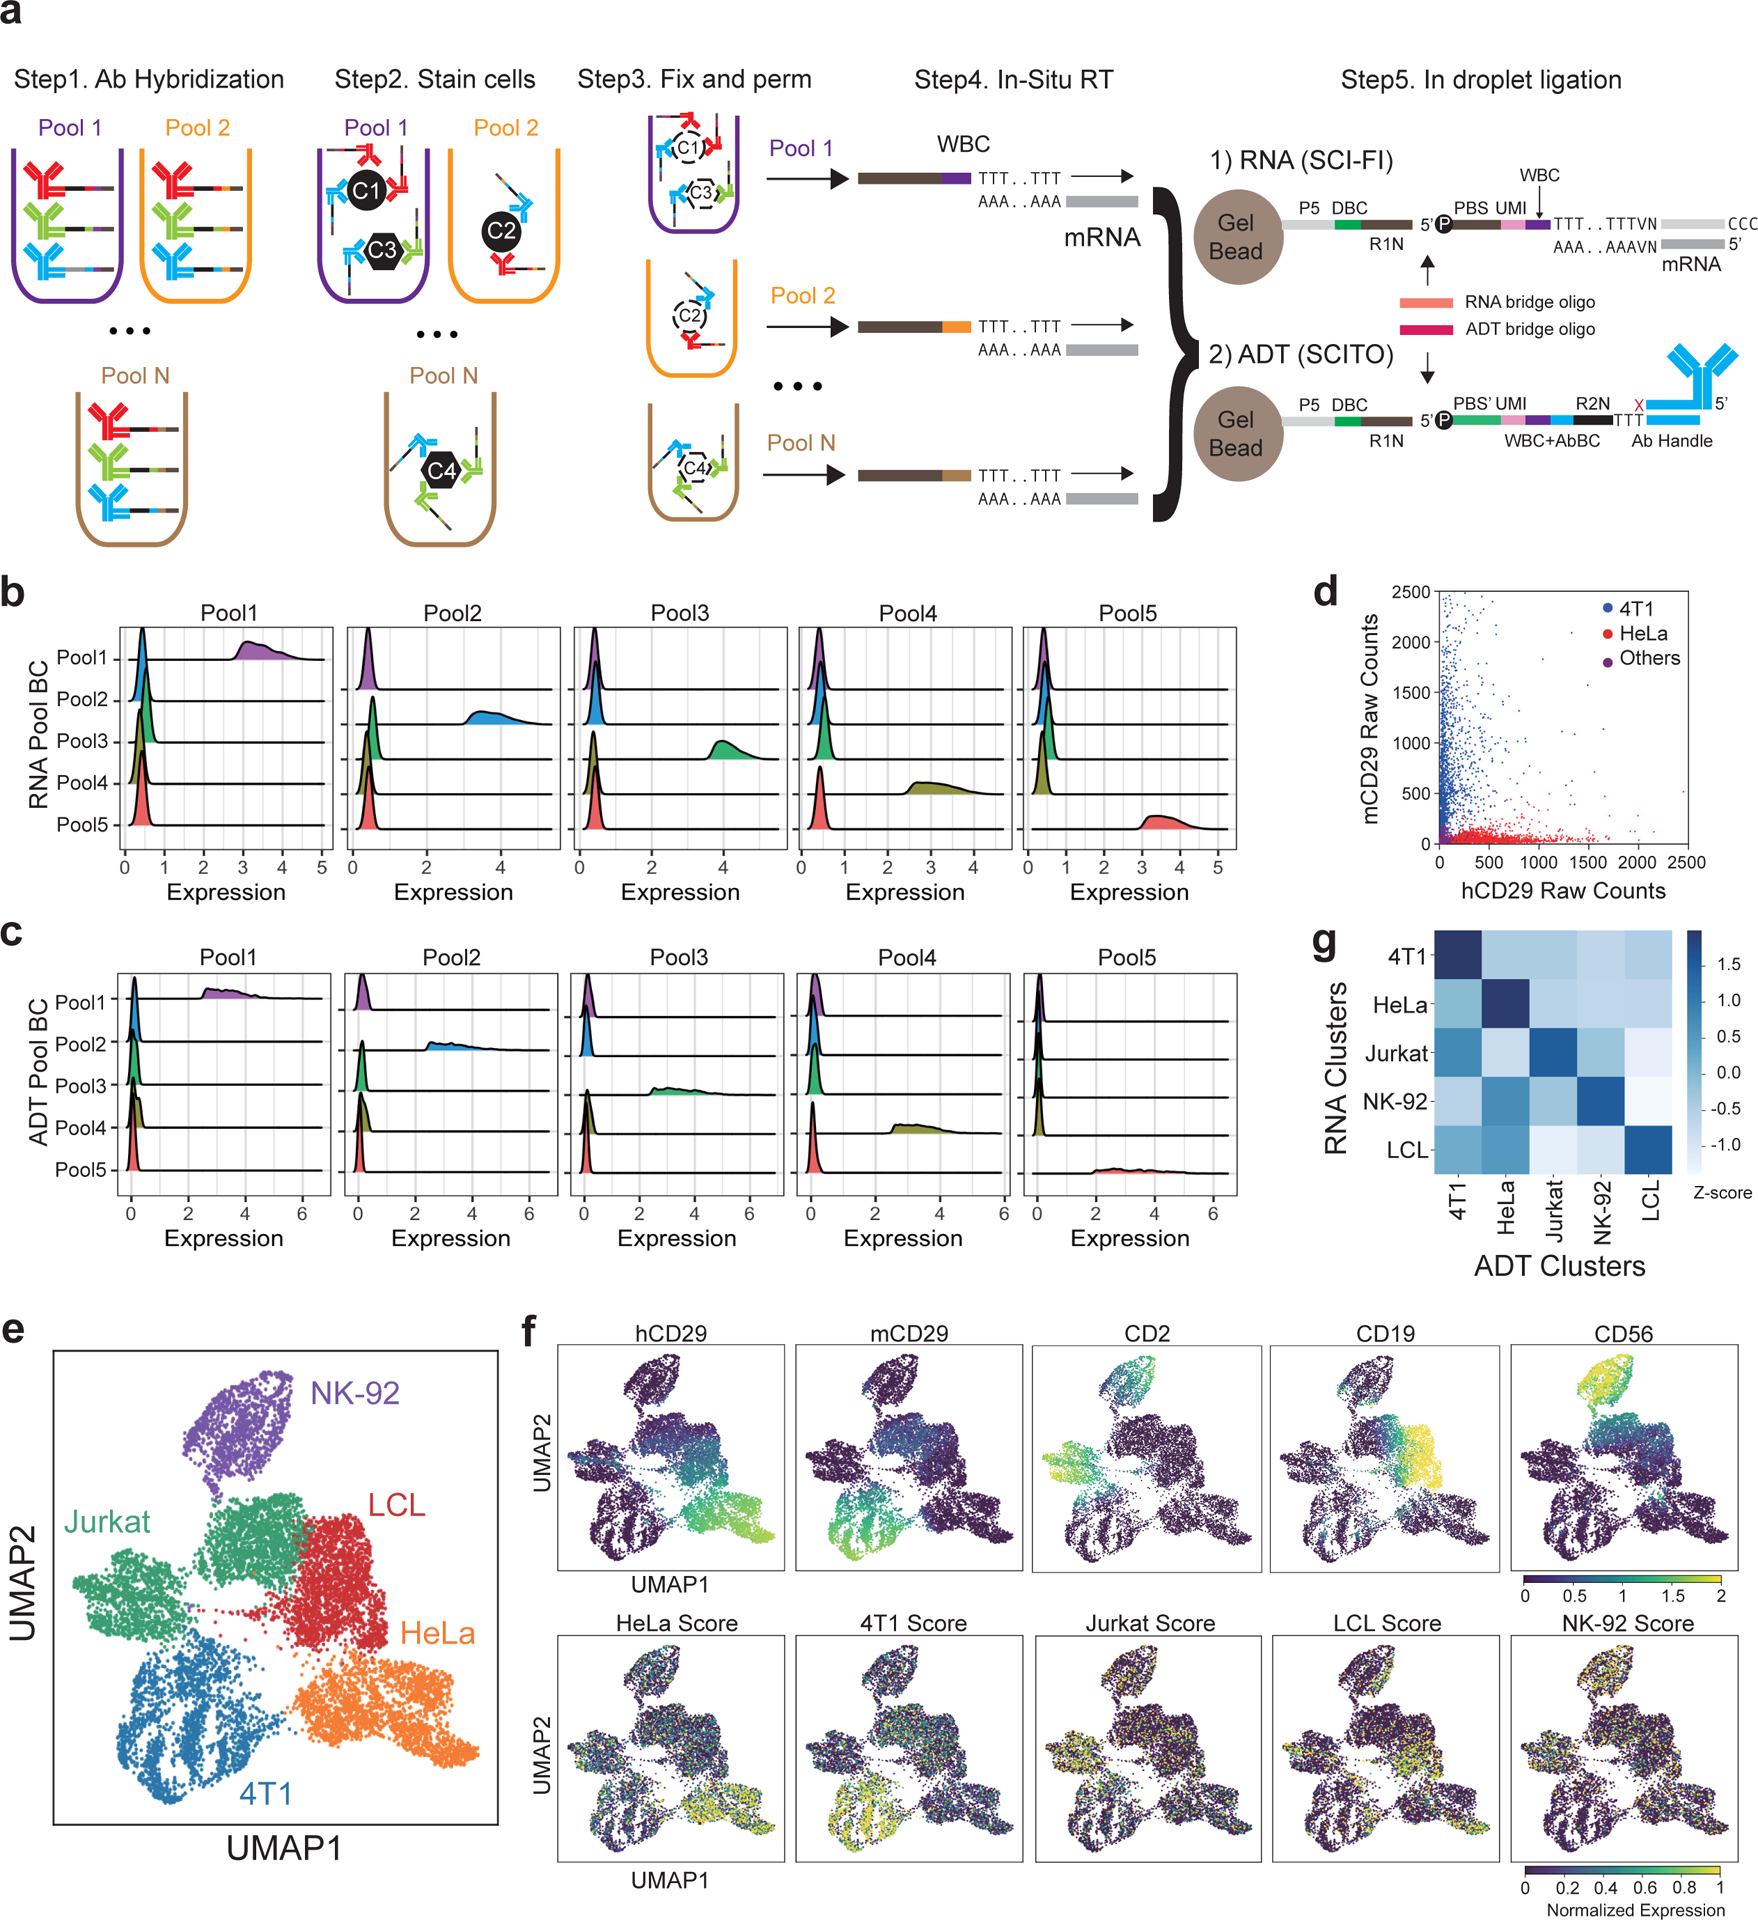
The development of DNA-barcoded antibodies to tag cell surface molecules has enabled the use of droplet-based single-cell sequencing (dsc-seq) to profile protein abundances from thousands of cells simultaneously. As compared to flow and mass cytometry, the high per cell cost of current dsc-seq-based workflows precludes their use in clinical applications and large-scale pooled screens. Here, we introduce SCITO-seq, a workflow that uses splint oligonucleotides (oligos) to enable combinatorially indexed dsc-seq of DNA-barcoded antibodies from over 105 cells per reaction using commercial microfluidics. By encoding sample barcodes into splint oligos, we demonstrate that multiplexed SCITO-seq produces reproducible estimates of cellular composition and surface protein expression comparable to those from mass cytometry. We further demonstrate two modified splint oligo designs that extend SCITO-seq to achieve compatibility with commercial DNA-barcoded antibodies and simultaneous expression profiling of the transcriptome and surface proteins from the same cell. These results demonstrate SCITO-seq as a flexible and ultra-high-throughput platform for sequencing-based single-cell protein and multimodal profiling.


Figures

Extended Data Fig. 1
Extended Data Fig. 1. Simulation and cost analysis of SCITO-seq
a, Collision rate (y-axis, denoted as CRS) as a function of the number of cells loaded and the number of pools (denoted by different colors). Here, number of simulations were performed as follows: maxSim = 1000 for cells_loaded <= 1e4, maxSim = 100 for 1e4 < cells_loaded <= 1e5, and maxSim = 10 for 1e5 < cells_loaded. Expected (solid lines) and simulated (dotted lines) collision rates are based on the Poisson statistics for 100,000 droplets and the number of droplets containing cells is modeled as 0.6 × 100,000 in simulation. When the number of cells loaded is not large (e.g., less than 10,000), there is noticeable variance in the number of collisions, so multiple simulation runs were used to estimate the collision rates shown in dotted lines. b, Number of droplets (y-axis) containing no cells (blue), exactly one cell (green) or greater than one cell (red) as a function of the number of cells loaded (x-axis). Singlets refer droplets that contain one cells, multiplets contain more than one cell (>2) and empties meaning no cells in the droplet. c, Distribution (Y-axis, counts) of number of cells per droplet (X-axis) for different cell loading numbers (cells_loaded) based on Poisson distribution. d, (Left) Droplet collision rate, depicting proportion of droplets with at least one barcode collision. (right) Barcode collision rate, estimating proportion of batches (pools) with a collision in a given droplet. Collision rates were calculated using simulations of a Poisson Point Process (solid lines) or a closed form solution (dashed lines; see Methods). Estimates from a closed form solution robustly and almost identically recapitulate simulations and can be used to calculate collision rates for an experiment. e, Total cost estimates (purple) including library prep (green), antibody prep (red) and sequencing cost (blue) assuming 40 reads/Ab/cell and a panel of 30 antibodies for different number of SCITO-seq pools.
Extended Data Fig. 2
Extended Data Fig. 2. Species mixing QC analysis (Human/Mouse)
a, (Upper) Transcriptomic UMAP of human and mouse cells, distinguished by transcript alignment. (Lower) ADT staining of mouse and human cells overlaid on the transcriptomic UMAP for 100k loading experiment. Pool barcodes per antibody were merged (i.e. CD29_h_merged-1 = CD29_h_barcode-1+….+CD29_h_barcode-5, where the latter number represents the pool number). Species classification was transcriptomically determined by a >95% cutoff based on normalized counts specific to either species. Cells which did not meet the threshold were classified as Multiplets. Overlaid normalized ADT counts shows human and mouse antibody staining. b, Scatterplot showing within species multiplets (shown on double-positive axes) across batches when loading 100k cells. Resolution of cell types with a single batch barcode and annotation of Multiplets (positive for both pool barcodes, such as CD29h_barcode1 and CD29h_barcode2 positive or CD29m_barcode1 and CD29m_barcode2). c, Scatterplots for species mixing 20k (left) and 100k (right) loading experiments colored by pool showing pool specific staining level. Resolved hCD29 or mCD29 on the axes refers to normalized antibody counts after resolution into single cells. If a droplet contained a mixture of hCD29 from pool 1 and pool 2, the droplet was resolved as two cells with the pool-normalized counts. d, Scatter plots of SCITO-seq normalized counts from 2×10⁴ loading of species mixing to determine cross pool or within pool background level. e, Scatter plots of directly-conjugated hCD29 and mCD29 antibody-based normalized counts from 2×10⁴ loading of species mixing to show cross pool or within pool background level using direct conjugation. Hg19, mm10, and Multiplet define cell populations based on respective transcriptomic alignment. Direct conjugates provide a baseline for noise in the SCITO-seq system.
Extended Data Fig. 3
Extended Data Fig. 3. Species mixing QC analysis (Human B/T cells)
a, UMAP projection (left) of T/B cell experiments with 2×10⁵ loading colored by cell types as determined transcriptomically (cutoff value of 0.9 for differences in highly variable genes). Doublets (multiplets) represent a mixture of T and B and are colored in green. The other two panels demonstrate specific staining of merged (merging all 5 pool barcodes) and normalized SCITO-seq counts. b, Scatterplot for 200k T/B experiments loading colored by pool. Resolved hCD4 or hCD20 on the axes refers the normalized antibody count after resolution into single cells. For example, if droplet is a mixture of hCD20 from pool 1 to 5, the resolved count should be either of the normalized counts from specific pool only (for Pool1 legend, the Resolved axes are represented by the normalized pool 1 counts). c, Estimated (x-axis) versus expected (y-axis) frequencies of Multiplets (frequencies of droplets that contain 1 cell to 5 cells) between estimated (observed) vs expected (simulated) for 2×10⁵ loading experiment (left). The five dots represent the number of the cells in the droplets (from single to five cells). Expected (x-axis) versus observed (y-axis) frequencies (right) of co-occurrences between antibody pool barcodes for loading concentrations of 2×10⁵ cells. Expected frequencies were calculated based on the frequencies of barcodes in singlets. Correlation value and p-value are also shown. Observed co-occurrence of antibody pool barcodes is calculated using R package mixtools (v1.0.4) implementing normalmixEM function with default parameters (epsilon = 1e-08, maxit = 1000). d, Distribution of the normalized UMI counts for each antibody in cells resolved from droplet containing single pool barcodes (S) and multiple pool barcodes (M) per donor for 200k loading experiment. Distribution of the antibodies in pool multiplets shows expected prior mixture proportions (5:1 for donor1 (D1) and 1:3 for donor2 (D2)) and overlaps with the corresponding distribution in pool singlets
Extended Data Fig. 4
Extended Data Fig. 4. Human donor PBMC QC analysis (28plex)
a, Ridgeplots of 28-plex experiment of the pool specific antibodies. The normalized expression values of 60 antibodies within each pool was summed for thresholding. An individual plot contains the batch specific normalized expression values for demonstrating the signal to noise distribution of the expected specificity. b, UMAP projections for 100k PBMC loading experiment for representative markers. UMAP projection comparison using RNA expression (left), merged antibody counts before resolution (middle) and after resolution (right). The scale represents the normalized merged ADT counts (left and the middle) and resolved ADT counts (right).
Extended Data Fig. 5
Extended Data Fig. 5. Human donor PBMC QC analysis 2
a, RNA expression based UMAP projections for representative markers of 200k PBMC loading. Since the RNA molecules are not combinatorially indexed, these UMAPs show stark contrast with the resolved UMAP based on normalized ADT counts where we see clear distinction of all clusters. b, UMAP ADT projection of 200k loading PBMC data colored by different pools (color numbers 0 through 9). Two pooled donors prior to aliquoting into 10 different pools to investigate batch effects across all stained wells and found no significant batch effects. c, ADT UMAP clusters overlaid on ADT UMAP (left) and ADT UMAP clusters overlaid on transcriptomic UMAP. d, (top) Protein expression on ADT UMAP of CD4/8 and CD45RA/RO. (down) Protein expression on transcriptomic UMAP of CD4/8 and CD45RA/RO.
Extended Data Fig. 6
Extended Data Fig. 6. Human donor PBMC QC analysis 3
a, UMAP (x-, y- axis with UMAP1 and UMAP2 dimensions) with representative PBMC markers based on CyTOF experiment using the same donor and antibody panel as in SCITO-seq. The scale shows arcsinh (hyperbolic inverse sine) transformed normalized values. b, Comparisons of SCITO-seq with CyTOF per donor (D1: top, D2: middle) for 100k loading data (SNG:singlet, DBL:doublet, TRI:triplet). Pairwise correlation heatmap plot (bottom) is also shown (similar to Fig 2d and e in the main figure). Within donors, the proportion each Leiden cluster was highly correlated (Cosine similarity within donor1:0.95, donor2:0.94).
Extended Data Fig. 7
Extended Data Fig. 7. Scalability experiment and QC analysis (60- and 165-plex)
a, Design of splint oligo with Totalseq-C compatible system. The splint oligos (FBC RC (reverse complement) + Well + Ab BC (5+5,10bp) + Read2 + Totalseq-C Barcode RC) are hybridized to the barcode region of the Totalseq-C oligo conjugated antibodies (right dotted lines around the blue region). 1uM splint oligo is also used and incubated 15min of hybridization (same workflow as conventional SCITO-seq). The well and the antibody barcode sequences are encoded in orange and blue above. b, Ridgeplots of 60-plex experiment showing the specificity of the pool specific antibodies. The normalized expression values of 60 antibodies with 10 pool result is shown above. Individual plot contains the batch specific normalized expression values to show signal to noise distribution of the expected specificity (first Batch1 plot is expected show a shift of Batch1 only (all batch1 60 normalized anitbody counts are aggregated). c, Ridgeplots of 165-plex experiment showing the specificity of the pool specific antibodies. The normalized expression values of 60 antibodies with 10 pool result is shown above. Individual plot contains the batch specific normalized expression values to show signal to noise distribution of the expected specificity (first Batch1 plot is expected show a shift of Batch1 only (all batch1 165 normalized anitbody counts are aggregated). d, Barplots of 165-plex experiment showing low UMI counts of an example Isotype control ADT counts (Rat IgG) for all 10 pools (top 1–5 batches, bottom 6–10 batches). The percentage of cells (y-axis) that express the ADT less than 2 UMI or over is calculated. Background noise across batches shows less than 2 UMI counts in ~92% of the cells. e, Overlay density histograms of the example CD8 vs Isotype control Ab (Rat IgG) to assess the ‘noise’ level for all 10 pools (top 1–5 batches, bottom 6–10 batches) in 165-plex data. X-axis for log1p(raw counts) transformed values and y-axis for density. f, Overlay density histograms of the example antibodies aggregated over all 10 pools (CD3, CD11c, CD45, CD127, CD8, CD4, CD19) vs Isotype control Ab (Rat IgG) to assess the ‘noise’ level in 165-plex data. X-axis for log1p(raw counts) transformed values and y-axis for density.
Extended Data Fig. 8
Extended Data Fig. 8. Scalability experiment and QC analysis 2 (60- and 165-plex)
a, UMAPs of 60-plex (upper) and 165-plex (lower) experiment showing normalized expression of cDC1, cDC2 and pDC markers. CD141 and CD370 for cDC1 and CD1c for cDC2 and CD123 and CD303 for pDC markers. b, Schematic of sample multiplexed SCITO-seq where different samples are hashed with different pool barcodes (Red, Blue, Purple). Droplets containing cells from different individuals (two different colors) can be resolved into separate cells. c, The example of pairwise correlation plots (using the ggpair R package) of normalized expression values of all 45 combinations (combinations of choosing 2 pairs from 10 pools) for CD4 antibody in 60-plex experiment. If spillover is present (if secondary oligo that encodes pool1 is not washed sufficiently, this could hybridize to other conjugated handle (same antibody) from different well), you would expect have staining on the double positive axis, which we do not see in this experiment. d, Another example of pairwise correlation plots (using the ggpair R package) of normalized expression values of all 45 combinations (combinations of choosing 2 pairs from 10 pools) for CD4 antibody in TSC 165-plex experiment. If spillover is present (if secondary oligo that encodes pool1 is not washed sufficiently, this could hybridize to other conjugated handle (same antibody) from different well), you would expect have staining on the double positive axis, which we do not see in this experiment.
Extended Data Fig. 9
Extended Data Fig. 9. Development of comodality experiment and QC analysis
a, Proof-of-concept experiment to analyze SCITO-seq using ATAC-kit. Representative PBMC with 12 surface markers (CD4, 8, 14, 16, 45, 45RA, 45RO, 19, 20, 56, 11c, HLA-DR) are stained in 5 separate pools loading 50k cells in this experiment showing specific staining profiles above (nCM: non-conventional monocytes, cMono: conventional monocytes). B, Schematic of the comodality experiment during the GEM ligation step using 10x Genomics ATAC kit. Detailed sequence structure of the RNA and ADT capture during the GEM reaction using the scifi-RNA-seq workflow. A more detailed workflow for the RNA can be found in the Supplementary Figure 2 in the scifi-RNA-seq paper. 10x_round2 refers to the 16bp droplet barcode, round1 barcode refers to the well barcode (11bp) used in the in-situ reverse transcription reaction. Untemplated ‘CCC’ is add at the end of the reverse transcription reaction. Antibody barcode (Ab BC fixed 10bp) and antibody handle (Ab handle fixed 20bp, conjugated directly to the blue antibody) sequences are specific to the antibody. Read2n stands for Read2 Nextera sequence. Compared to the bridge oligo 1 (used to capture in-situ RT mRNA molecules), bridge oligo 2 has extra 10bp (AACGTATCGA between red and blue colored sequences). ddC (dideoxy C) and InvdT (inverted dT) for preventing extension. Arrow indicates the ligation site during the GEM reaction. c, Dimensional reduction using UMAP with normalized RNA counts and corresponding cell line specific ADT marker expressions on the UMAP space. d, Dimensional reduction using UMAP with normalized RNA counts and corresponding single RNA marker expressions on the UMAP space.
Extended Data Fig. 10
Extended Data Fig. 10. Flow validation experiment of SCITO-seq
a, To reduce the non-specific staining of secondary oligonucleotides, we titrated oligonucleotides at 1uM (right) and 100uM (left). After hybridization of oligonucleotide conjugated antibodies with a Cy5 conjugated reverse complementary oligonucleotide for 15 minutes, a mixture of LCLs and primary monocytes were stained with the hybridized material an CD13-BV421 for 30 minutes, washed twice and analyzed on a LSRII. CD13 BV421 antibody was captured by the Violet-F channel (x-axis) and Cy5 tagged secondary oligonucleotides was captured on the Red-C channel to check the level of background staining (Q6 gated population refers to the spillover of non-cognate secondary oligonucleotides in the primary monocyte population). b, To determine if 1 ul of 1 uM reverse complementary oligonucleotide would saturate 1 ug antibody, we first hybridized 1 ug of oligonucleotide conjugated CD3 with 1 ul of 1 uM reverse complementary oligonucleotide conjugated to Cy5. Following this, another 1 ul of 1 uM reverse complementary oligonucleotide was added, but with a FAM conjugated instead. This was incubated for 15 minutes before being added to the whole PBMC and washed twice before running on an LSRII. Left figure shows the positive shift (red) when first hybridization occurs, and second histograms shows there is essentially no significant shift because of the near saturation of the first handle sequence. c, Lymphocytes were gated for singlets and live cells (Live/dead gate, YG C-A is the PI dye channel) prior to binning samples across CD8a expression for sorting. Red-C represents CD8a-APC and Blue-B represents isotype control-AF488.
Fig. 1 |
Fig. 1 |. Design of SCITO-seq and mixed-species proof-of-concept.
(a) SCITO-seq workflow. Each antibody is conjugated with a unique antibody barcode (red, green and blue) and hybridized with a splint oligo containing antibody and pool barcodes (Ab+PBC (Pool barcode): [red, blue, green] × [purple, orange, brown]). Cells are split into pools and stained and then mixed and loaded for dsc-seq at high loading concentrations. Cells are resolved from the resulting data using the combinatorial index of Ab+PBC and droplet barcodes. (b) A detailed structure of the SCITO-seq fragment produced. The primary antibody-specific universal oligo is also a hybridization handle. The splint oligo consists of the reverse complement sequence to the handle followed by a TruSeq adaptor (black), the compound Ab+PBC (blue+orange), and a gelbead bound sequence (i.e., the 10× 3’v3 feature barcode capture sequence 1 (brown)). The Ab+PBC and the droplet barcode (DBC) form a combinatorial index unique to each cell. (c) Cell recovery and collision rate analysis. Number of cells recovered as a function of the number of pools at three commonly accepted collision rates (1%, 5% and 10%). (d) Density histograms of SCITO-seq vs FACS showing 4 different bins of CD8A expression. Log1p transformed SCITO-seq counts for two pools are compared with the log1p fluorescence intensity per cell from FlowJo (v10). (e) Mixed species (HeLa and 4T1) proof-of-concept experiment. HeLa and 4T1 cells are mixed and stained in five separate pools at a ratio of 1:1 with pool-barcoded human and mouse anti-CD29 antibodies. Scatter (left) and density (right) plots of (f) 38,504 unresolved cell-containing droplets (CCD) and (g) 46,295 resolved cells while loading 105 cells. (h) Schematic of human mixing experiment where different ratios of T and B cells (5:1 and 1:3) were mixed prior to splitting and staining with five pools of CD4 and CD20 antibodies. Cell types are indicated by color (T: blue, B: red) while shapes indicate donors. Side-by-side scatter plot and density plots of (i) unresolved and (j) resolved cells for loading 2 × 10⁵ cells. Merged ADT counts are generated by summing all counts for each antibody across pools. Resolved data obtained after assigning cells based on Ab+PBC and DBC barcodes.
Fig. 2 |
Fig. 2 |. Ultra high-throughput PBMC profiling of healthy controls using SCITO-seq.
(a) UMAP projection of 49,510 CCDs using merged ADT counts of a 28-plex antibody panel showing key lineage markers. (b) UMAP projection of 93,127 PBMCs resolved using Ab+PBCs show the canonical myeloid and lymphoid cell types defined by known markers. (c) UMAP projections of PBMCs resolved from singlets (left), resolved from multiplets (middle), and profiled using CyTOF (right). Principle Component Analysis (PCA)-based integration of data (Ingest function from Scanpy) was used to determine overlapping cell populations between SCITO-seq and CyTOF. (d) Heatmap of pairwise cosine similarity (scaled colors) between estimated cell type proportions for cells originating from singlets (SNG), doublets (DBL), triplets (TRI), quadruplets (QUAD), and CyTOF per donor.
Fig. 3 |
Fig. 3 |. Extending SCITO-seq for compatibility with 60-plex custom and 165-plex commerical antibody panels.
(a) UMAP projection of 175,930 resolved PBMCs using a panel of 60-plex antibodies colored by Leiden clusters and (b) key lineage markers. Subscripts/prefixes stands for: c:conventional, nc:non-conventional, act:activated, gd:gamma-delta. (c) UMAP projection of 175,000 resolved PBMCs using a panel of 165-plex TotalSeq-C antibodies (TSC 165-plex) colored by Leiden clusters and (d) key lineage markers. (e) Distributions of UMIs per cell (y-axis) for CCDs with different numbers of cells (1–10) encapsulated for 60-plex (up, n=6,831, 24,031, 42,274, 44,251, 31,805, 16,094, 6,600, 2,437, 1,068, 538) and TSC 165-plex (down, n=7,779, 25,573, 40,949, 42,036, 28,954, 15,411, 6,957, 3,178, 1,859, 2,304) experiments. Lines are medians, box extends from 25% to 75%, dots are outliers beyond 1.5× interquartile range. (f) Correlation plots for 60-plex (up) and TSC 165-plex (down) experiments comparing estimated (x-axis) and expected multiplet rates (y-axis). Ten points are shown from 1 to 10 cells encapsulated per CCD and colors are matched to panel (e). (g) Correlations of the cell composition estimates using the 60-plex (x-axis) versus TSC 165-plex (y-axis) experiments for major cell lineages (T and NK cell (left), B cell (middle), myeloid cells (right)) across the same 10 donors represented in each pooled experiment. (h) Row-clustered heatmap of pairwise correlation of 43 overlapping markers between the 60-plex (row) and 165-plex (column) experiments. (i) Correlations of representative marker expressions within specific cell types between the 60-plex (x-axis) and 165-plex (y-axis) experiments (CD19 in B cell, CD4 in CD4 T cells, CD8A in CD8 T cells). The p-values for (f), (g) and (i) is calculated as the corresponding two-sided p-value for the t-distribution with n-2 degrees of freedom. The same 10 donors in 10 pools (1 donor stained in each well) were used for both 60- and 165-plex data.
Fig. 4 |
Fig. 4 |. Integrating SCITO-seq and scifi-RNA-seq for simultaneous profiling of transcripts and surface proteins.
(a) Schematic of the SCITO-seq and scifi-RNA-seq coassay. Hybridized SCITO-seq antibodies are used to stain cells in different pools. Cells are washed with buffer then fixed and permeabilized with methanol. Transcripts undergo in-situ reverse transcription (RT) with pool-barcoded RT primers (well barcode denoted as WBC). cDNA and ADT molecules are then captured with RNA- and ADT-specific bridge oligos (orange and red hybridized to PBS and PBS’) and ligated to DBCs in droplet (See Extended Data Fig. 9b for details). Ridgeplots of distribution of cells with specific pool barcodes for the (b) RNA library and (c) ADT library. (d) Barnyard plot showing expected staining of human anti-CD29 (x-axis) and mouse anti-CD29 (y-axis) antibodies on HeLa cells and 4T1 cells respectively. Other cell lines are negative for both antibodies as expected. (e) UMAP projection generated from ADT data colored by Leiden clusters. (f) UMAP projection colored by ADT markers (top) and corresponding cell-line-specific transcriptomic signatures scored using the Scanpy’s score genes function (bottom). (g) Heatmap of the overlap analysis of mRNA (y-axis) and ADT markers (x axis), mRNA marker genes are mapped onto cell-type specific ADT clusters (Gene scores are calculated on cells corresponding to ADT based clusters) for all 5 cell lines. The color-scaled values are standardized z–score scale.

Similar articles

Cited by

References

MAIN REFERENCES

    1. Macosko EZ et al. Highly Parallel Genome-wide Expression Profiling of Individual Cells Using Nanoliter Droplets. Cell 161, 1202–1214 (2015). - PMC - PubMed
    1. Klein AM et al. Droplet barcoding for single-cell transcriptomics applied to embryonic stem cells. Cell 161, 1187–1201 (2015). - PMC - PubMed
    1. Buenrostro JD et al. Single-cell chromatin accessibility reveals principles of regulatory variation. Nature 523, 486–490 (2015). - PMC - PubMed
    1. Stoeckius M et al. Simultaneous epitope and transcriptome measurement in single cells. Nat. Methods 14, 865–868 (2017). - PMC - PubMed
    1. Shahi P, Kim SC, Haliburton JR, Gartner ZJ & Abate AR Abseq: Ultrahigh-throughput single cell protein profiling with droplet microfluidic barcoding. Sci. Rep 7, 44447 (2017). - PMC - PubMed

METHOD REFERENCES

    1. Zunder ER et al. Palladium-based mass tag cell barcoding with a doublet-filtering scheme and single-cell deconvolution algorithm. Nat. Protoc 10, 316–333 (2015). - PMC - PubMed
    1. Traag VA, Waltman L & van Eck NJ From Louvain to Leiden: guaranteeing well-connected communities. Sci. Rep 9, 5233 (2019) - PMC - PubMed

Publication types