

ILC2 Cells Promote Th2 Cell Differentiation in AECOPD Through Activated Notch-GATA3 Signaling Pathway
- PMID: 34354706
- PMCID: PMC8329850
- DOI: 10.3389/fimmu.2021.685400
ILC2 Cells Promote Th2 Cell Differentiation in AECOPD Through Activated Notch-GATA3 Signaling Pathway
Abstract
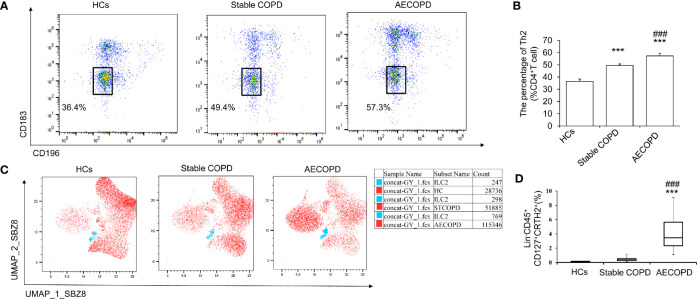
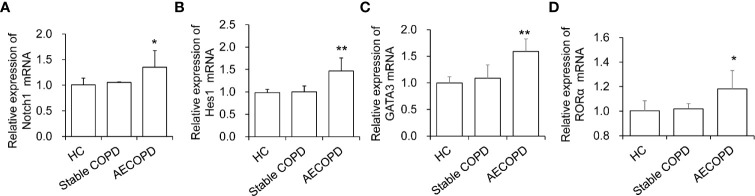
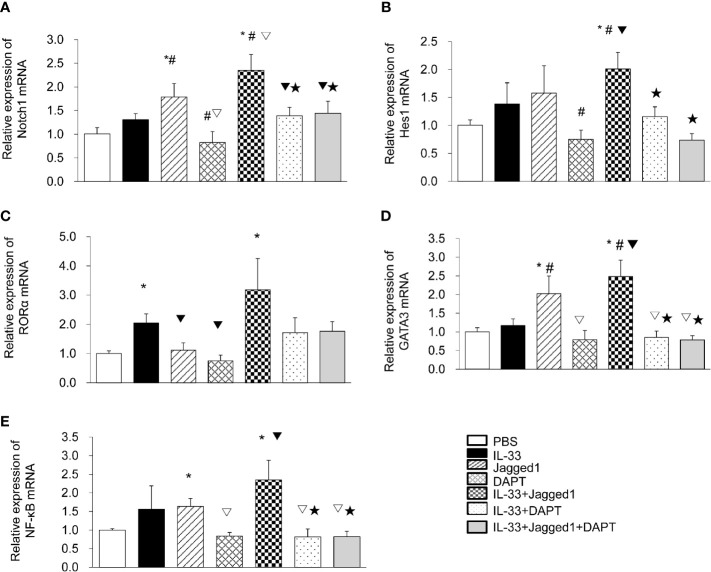
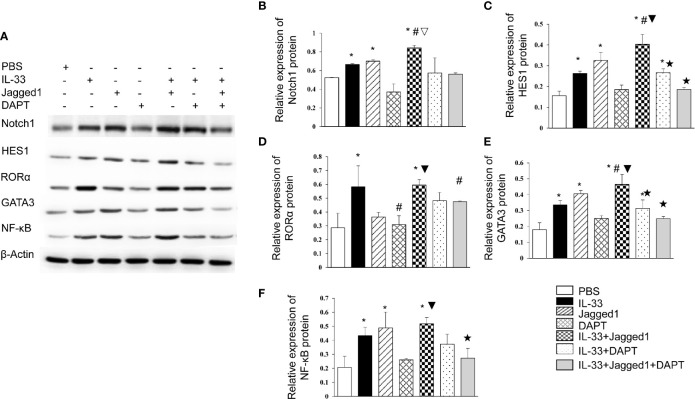
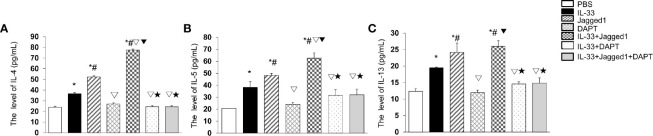
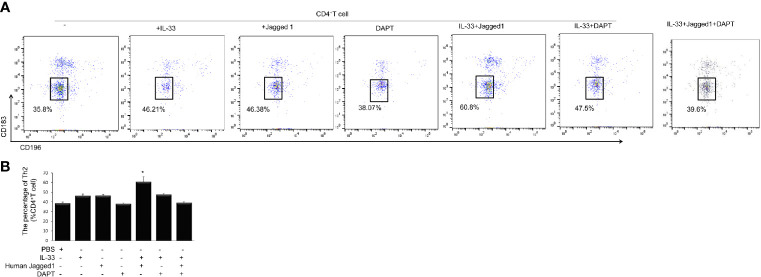
This study is to investigate the capacity of type 2 innate lymphoid cells (ILC2s) in regulating the Th2 type adaptive immune response of acute exacerbation of chronic obstructive pulmonary disease (AECOPD). The study enrolled healthy people, stable chronic obstructive pulmonary disease (COPD) patients, and AECOPD patients. Flow cytometry was used to detect Th2 and ILC2 cells in the peripheral blood. In addition, ILC2s from the peripheral blood of AECOPD patients were stimulated with PBS, IL-33, Jagged1, DAPT, IL-33+Jagged1, IL-33+DAPT, and IL-33+Jagged-1+DAP in vitro. The levels of cytokines in the culture supernatant were detected by ELISA and the culture supernatant was used to culture CD4 + T cells. The mRNA and protein levels of Notch1, hes1, GATA3, RORα, and NF-κB of ILC2s were detected by real-time PCR and Western blot. The proportion of Th2 and ILC2s was significantly increased in the peripheral blood of AECOPD patients, alone with the increased Notch1, hes1, and GATA3 mRNA levels. In vitro results showed that the mRNA and protein levels of Notch1, hes1, GATA3 and NF-κB were significantly increased after stimulation with Notch agonist, meanwhile, the level of type 2 cytokines were increased in the supernatant of cells stimulated with Notch agonist, and significantly promoted differentiation of Th2 cells in vitro. Disruption of Notch pathway weakened GATA3 expression and cytokine production, and ultimately affected the differentiation of Th2 cells. In conclusion, our results suggest that ILC2s can promote Th2 cell differentiation in AECOPD via activated Notch-GATA3 signal pathway.
Keywords: Notch-GATA3 pathway; Th2 polarized; acute exacerbation of chronic obstructive pulmonary disease; cell differentiation; type 2 innate lymphoid cell.
Copyright © 2021 Jiang, Cai, Wang, Li, Xu, Jing, Zhang, Li and Ding.
Conflict of interest statement
The authors declare that the research was conducted in the absence of any commercial or financial relationships that could be construed as a potential conflict of interest.
Figures
Similar articles
-
ILC2s Induce Adaptive Th2-Type Immunity in Acute Exacerbation of Chronic Obstructive Pulmonary Disease.Mediators Inflamm. 2019 Jun 20;2019:3140183. doi: 10.1155/2019/3140183. eCollection 2019. Mediators Inflamm. 2019. PMID: 31320835 Free PMC article.
-
ILC2s induce adaptive Th2-type immunity in different stages of tuberculosis through the Notch-GATA3 pathway.Int Immunopharmacol. 2021 Dec;101(Pt B):108330. doi: 10.1016/j.intimp.2021.108330. Epub 2021 Nov 30. Int Immunopharmacol. 2021. PMID: 34862127
-
Down-regulation of Notch signaling pathway reverses the Th1/Th2 imbalance in tuberculosis patients.Int Immunopharmacol. 2018 Jan;54:24-32. doi: 10.1016/j.intimp.2017.10.026. Epub 2017 Oct 28. Int Immunopharmacol. 2018. PMID: 29100034
-
T helper 2 (Th2) cell differentiation, type 2 innate lymphoid cell (ILC2) development and regulation of interleukin-4 (IL-4) and IL-13 production.Cytokine. 2015 Sep;75(1):14-24. doi: 10.1016/j.cyto.2015.05.010. Epub 2015 Jun 1. Cytokine. 2015. PMID: 26044597 Free PMC article. Review.
-
'All things considered': transcriptional regulation of T helper type 2 cell differentiation from precursor to effector activation.Immunology. 2013 Sep;140(1):31-8. doi: 10.1111/imm.12121. Immunology. 2013. PMID: 23668241 Free PMC article. Review.
Cited by
-
Examining the contribution of Notch signaling to lung disease development.Naunyn Schmiedebergs Arch Pharmacol. 2024 Sep;397(9):6337-6349. doi: 10.1007/s00210-024-03105-8. Epub 2024 Apr 23. Naunyn Schmiedebergs Arch Pharmacol. 2024. PMID: 38652281 Review.
-
Notch1 activation of Jagged1 contributes to differentiation of mesenchymal stem cells into endothelial cells under cigarette smoke extract exposure.BMC Pulm Med. 2022 Apr 11;22(1):139. doi: 10.1186/s12890-022-01913-3. BMC Pulm Med. 2022. PMID: 35410206 Free PMC article.
-
The treatment of Qibai Pingfei Capsule on chronic obstructive pulmonary disease may be mediated by Th17/Treg balance and gut-lung axis microbiota.J Transl Med. 2022 Jun 21;20(1):281. doi: 10.1186/s12967-022-03481-w. J Transl Med. 2022. PMID: 35729584 Free PMC article.
-
ILC2 Diversity, Location, and Function in Pulmonary Disease.Immunol Rev. 2025 Jul;332(1):e70036. doi: 10.1111/imr.70036. Immunol Rev. 2025. PMID: 40454563 Free PMC article. Review.
-
Effects of the Zbtb1 Gene on Chromatin Spatial Structure and Lymphatic Development: Combined Analysis of Hi-C, ATAC-Seq and RNA-Seq.Front Cell Dev Biol. 2022 Apr 25;10:874525. doi: 10.3389/fcell.2022.874525. eCollection 2022. Front Cell Dev Biol. 2022. PMID: 35547816 Free PMC article.
References
-
- Ho TW, Tsai YJ, Ruan SY, Huang CT, Lai F, Yu CJ. In-Hospital and One-Year Mortality and Their Predictors in Patients Hospitalized for First-Ever Chronic Obstructive Pulmonary Disease Exacerbations: A Nationwide Population-Based Study. PloS One (2014) 9(12):e114866. 10.1371/journal.pone.0114866 - DOI - PMC - PubMed
Publication types
MeSH terms
Substances
LinkOut - more resources
Full Text Sources
Medical
Research Materials