

Temporal metabolic response yields a dynamic biosignature of inflammation
- PMID: 34355150
- PMCID: PMC8319798
- DOI: 10.1016/j.isci.2021.102817
Temporal metabolic response yields a dynamic biosignature of inflammation
Abstract
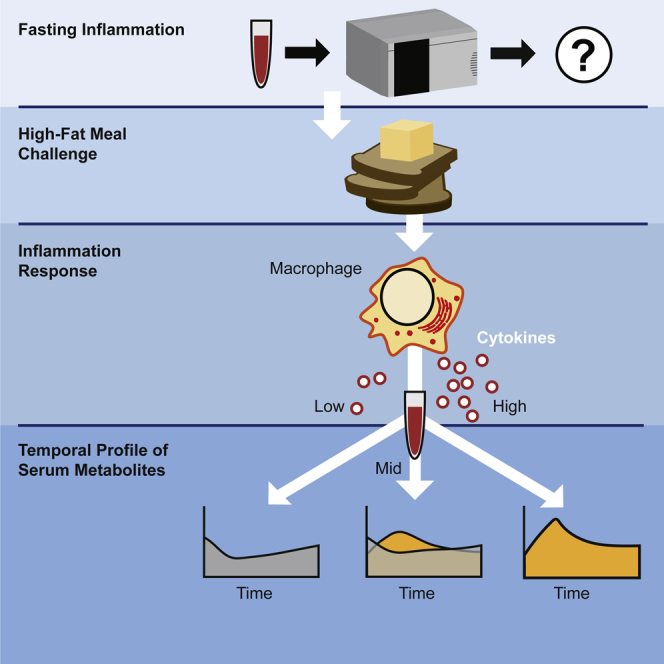
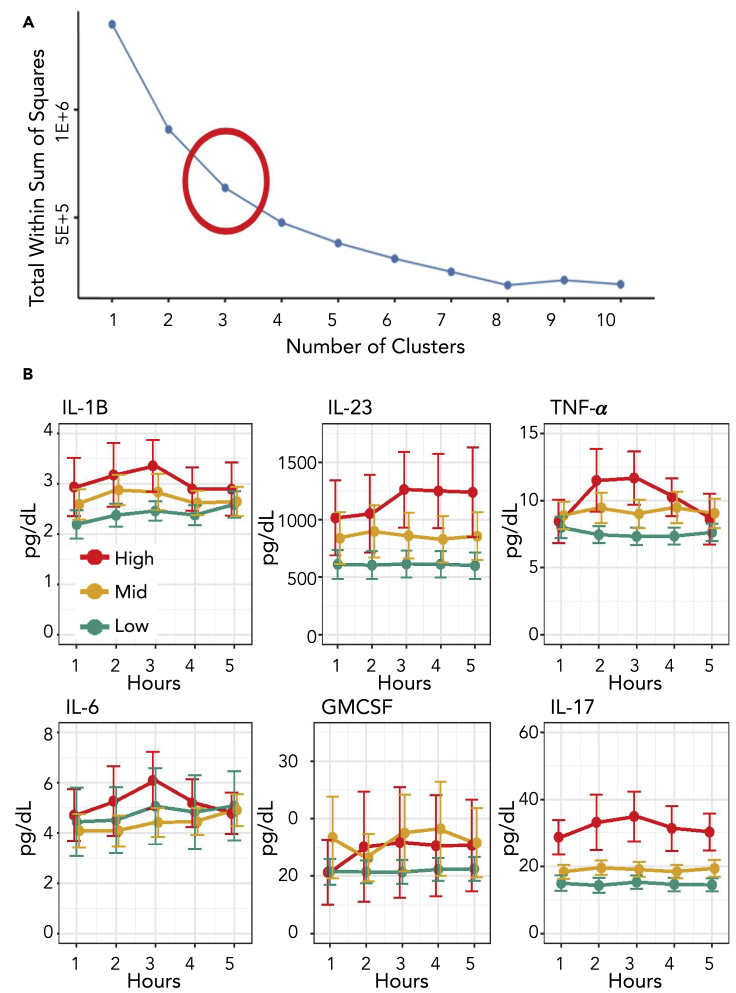
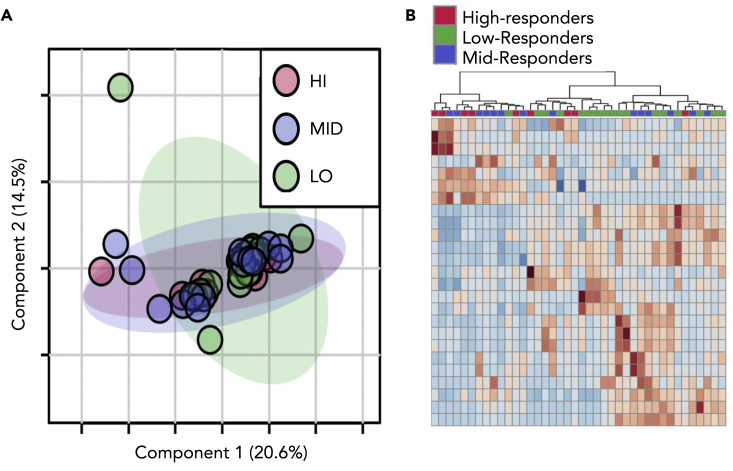
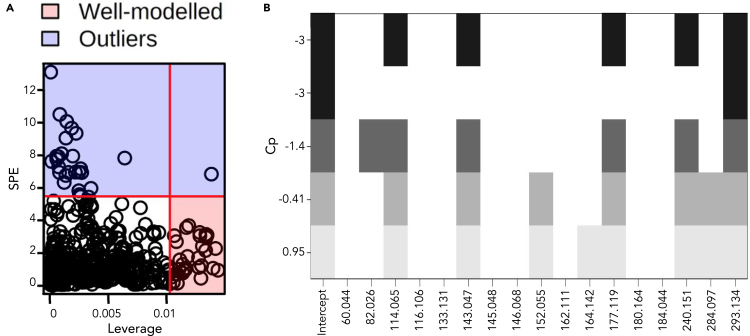
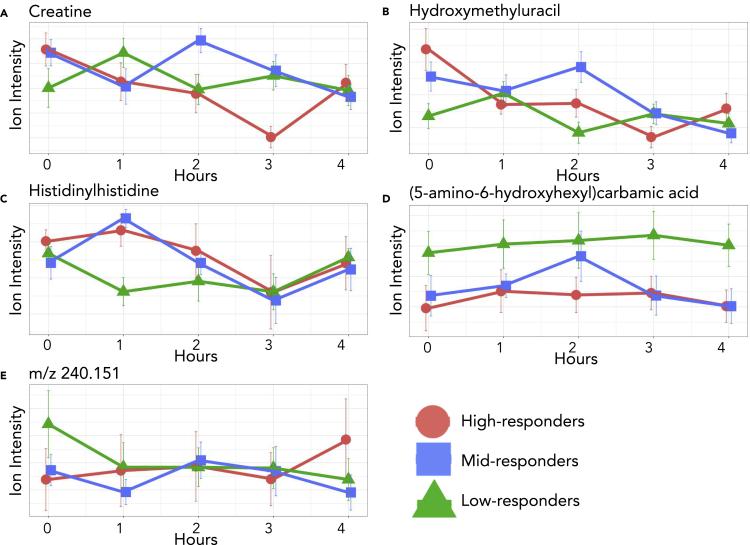
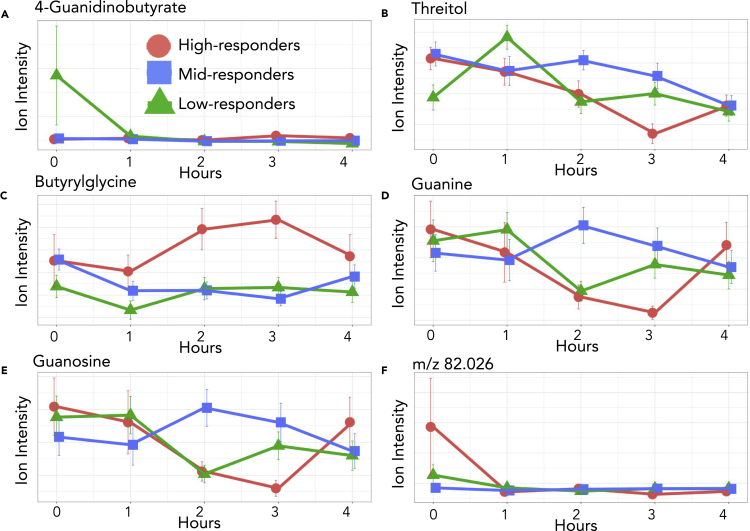
Chronic low-grade inflammation is a subclinical condition directly and indirectly linked to the development of a wide range of diseases responsible for the vast majority of morbidity. To examine mechanisms coupled to chronic disease, a group of overweight and obese human subjects without known inflammatory diseases participated in a high-fat meal challenge as an acute inflammation stimulus. Analysis of serum metabolites grouped by baseline cytokine levels revealed that single samples had little power in differentiating groups. However, an analysis that incorporated temporal response separated inflammatory response phenotypes and allowed us to create a metabolic signature of inflammation which revealed metabolic components that are crucial to a cytokine-mediated inflammation response. The use of temporal response, rather than a single time point, improved metabolomic prediction of high postprandial inflammation responses and led to the development of a dynamic biosignature as a potential tool for stratifying risk to a wide range of diseases.
Keywords: Metabolomics; Pathophysiology; Systems biology.
© 2021 The Authors.
Conflict of interest statement
The authors declare no competing interests.
Figures
References
-
- Awwad H.M., Geisel J., Obeid R. Determination of trimethylamine, trimethylamine N-oxide, and taurine in human plasma and urine by UHPLC-MS/MS technique. J. Chromatogr. B Analyt. Technol. Biomed. Life Sci. 2016;1038:12–18. - PubMed
-
- Bagheri M., Farzadfar F., Qi L., Yekaninejad M.S., Chamari M., Zeleznik O.A., Kalantar Z., Ebrahimi Z., Sheidaie A., Koletzko B. Obesity-related metabolomic profiles and discrimination of metabolically unhealthy obesity. J. Proteome Res. 2018;17:1452–1462. - PubMed
-
- Bansal S., Buring J.E., Rifai N., Mora S., Sacks F.M., Ridker P.M. Fasting compared with nonfasting triglycerides and risk of cardiovascular events in women. JAMA. 2007;298:309–316. - PubMed
-
- Bassit R.A., Curi R., Costa Rosa L.F. Creatine supplementation reduces plasma levels of pro-inflammatory cytokines and PGE2 after a half-ironman competition. Amino Acids. 2008;35:425–431. - PubMed
-
- Baumann H., Gauldie J. The acute phase response. Immunol. Today. 1994;15:74–80. - PubMed
LinkOut - more resources
Full Text Sources
