. 2021 Aug 6:10:e65952.
doi: 10.7554/eLife.65952.

Naa12 compensates for Naa10 in mice in the amino-terminal acetylation pathway

Affiliations

Naa12 compensates for Naa10 in mice in the amino-terminal acetylation pathway

Hyae Yon Kweon et al. Elife. .

Abstract

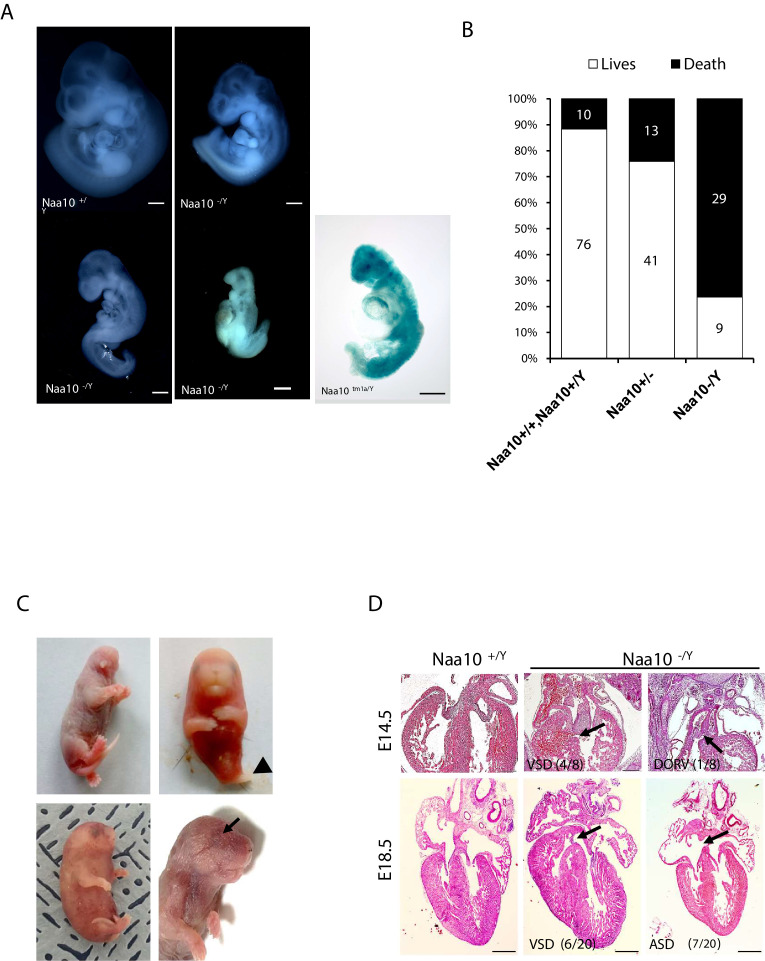
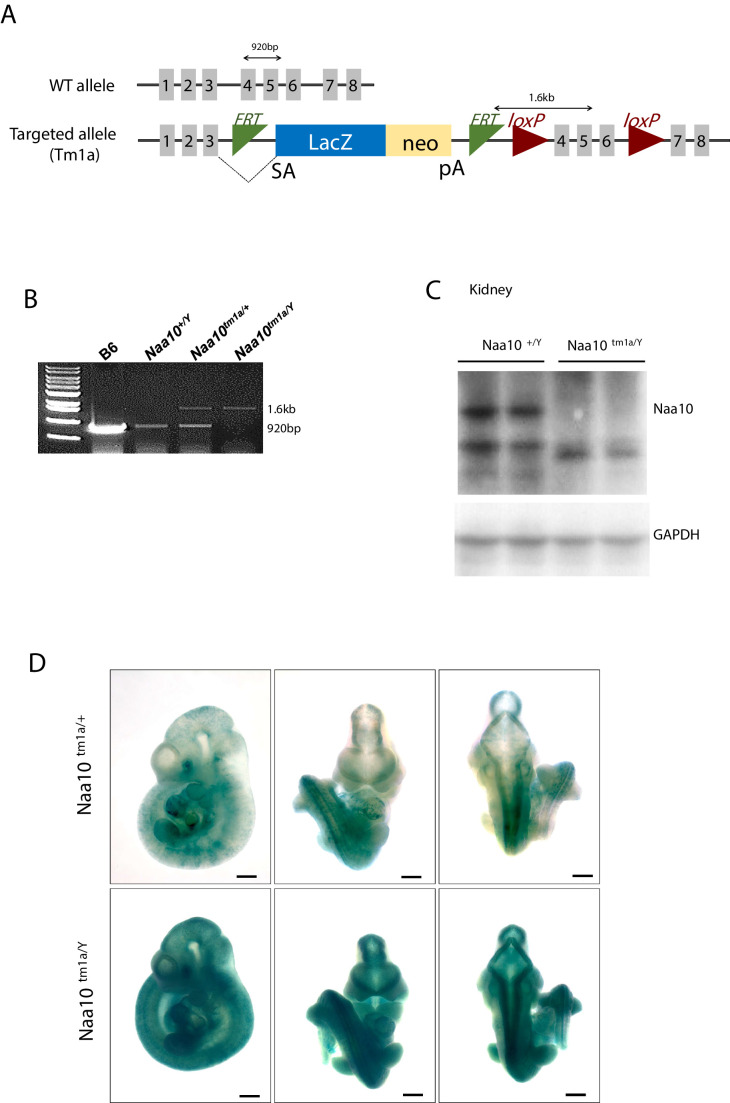
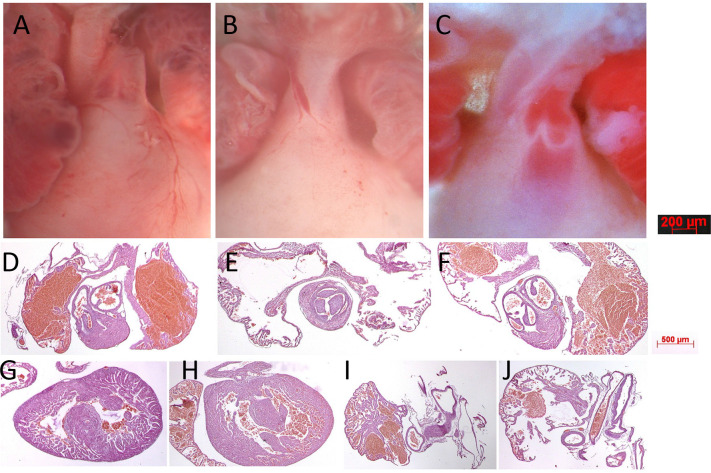
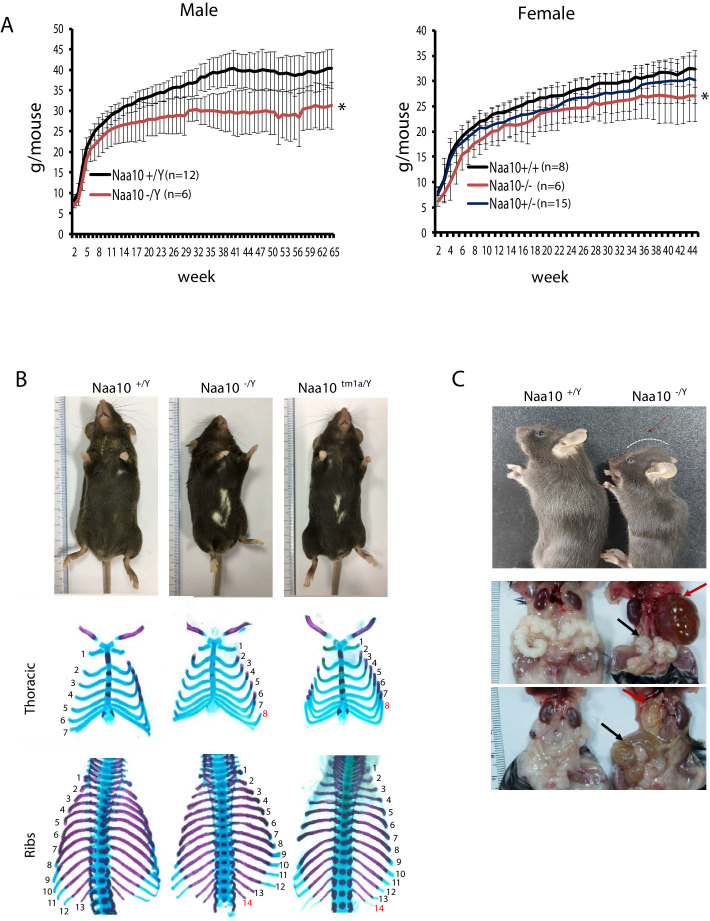
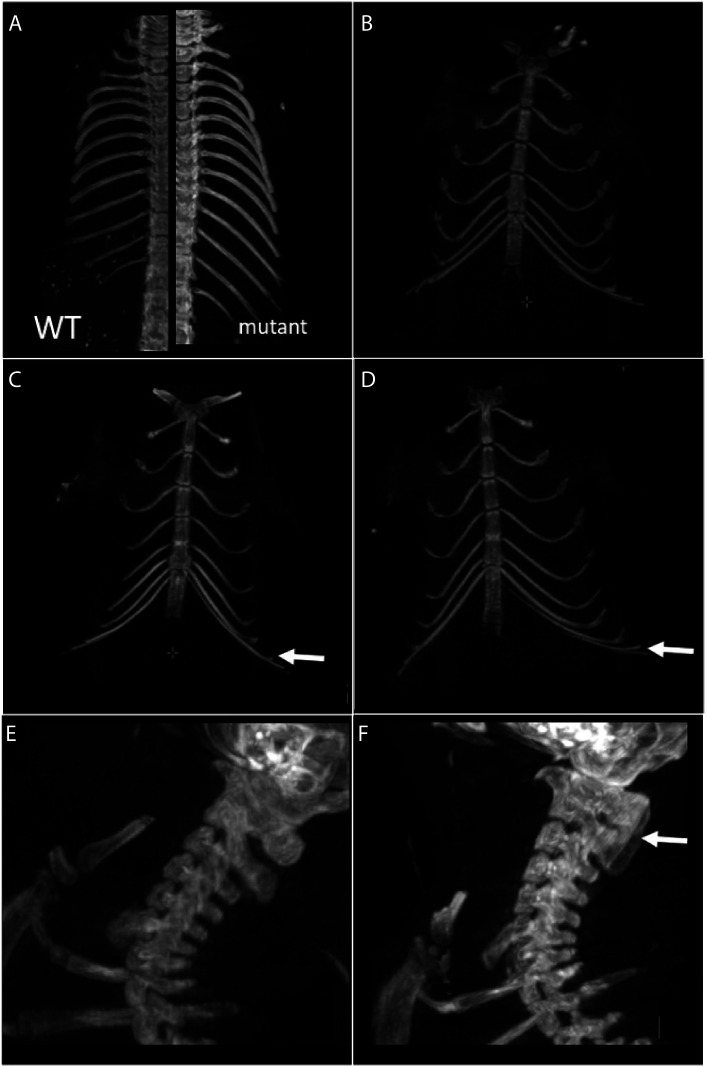
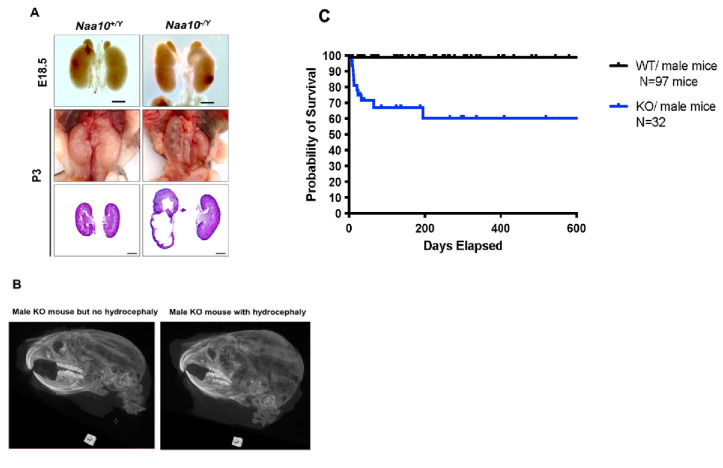
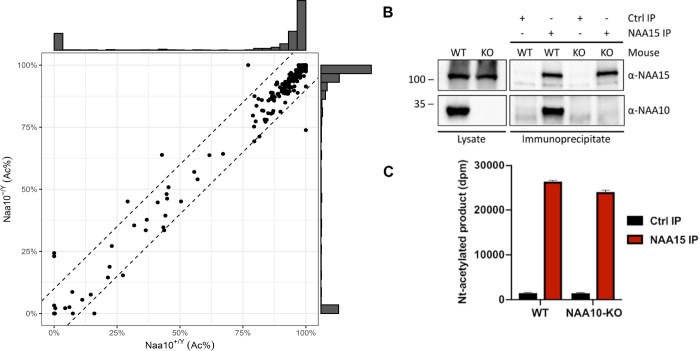
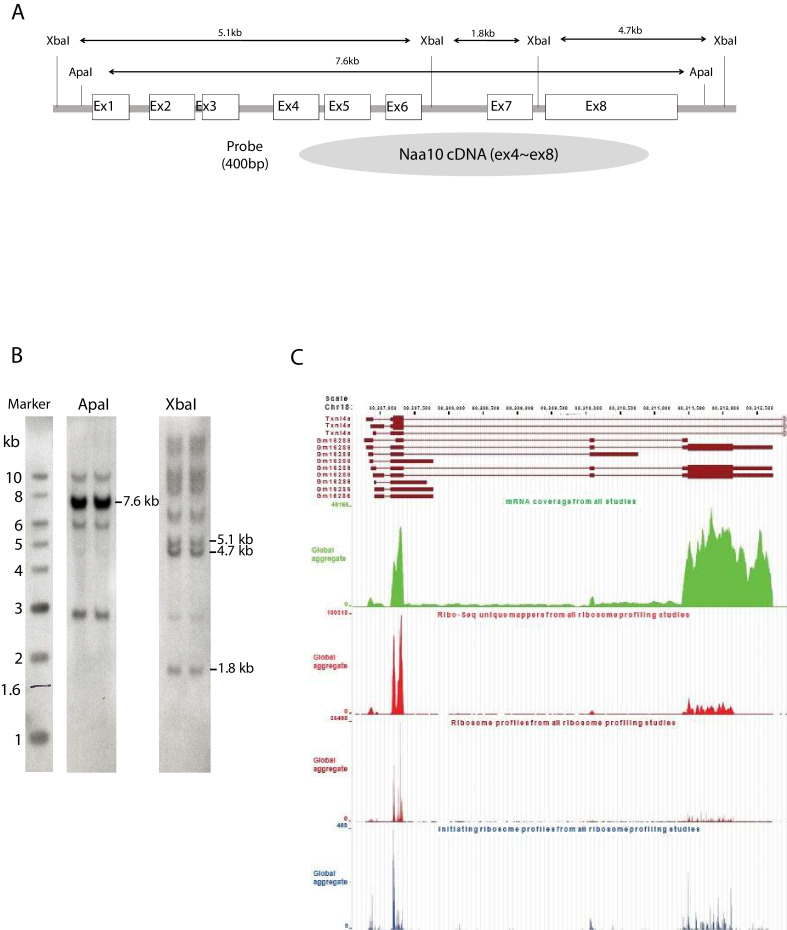
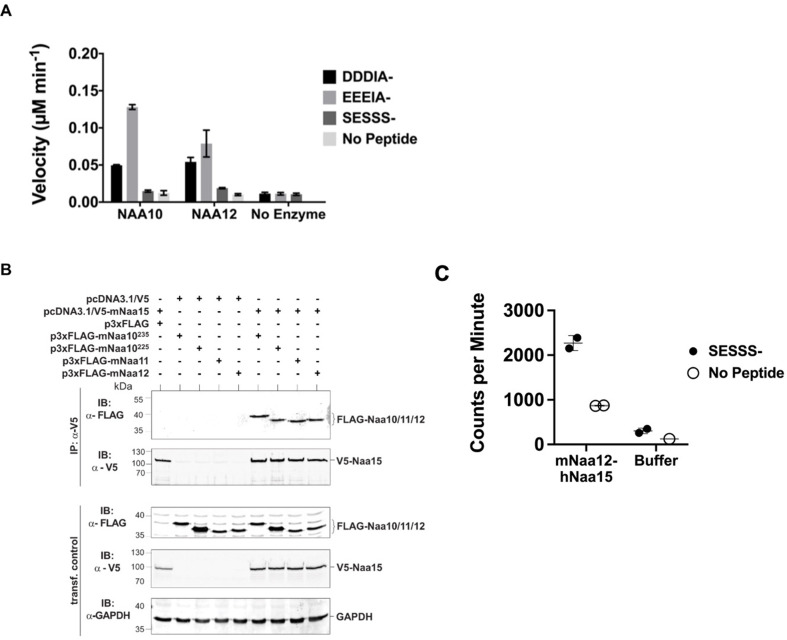
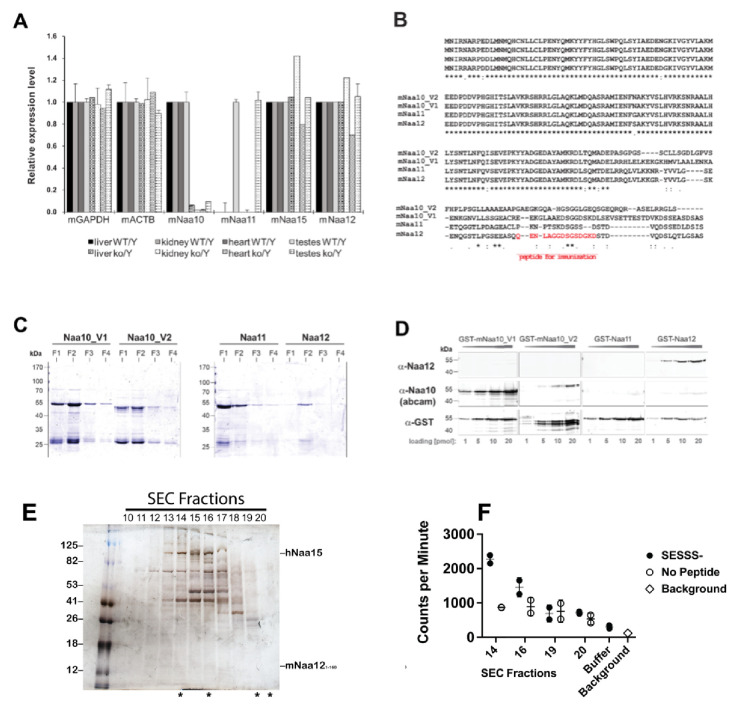
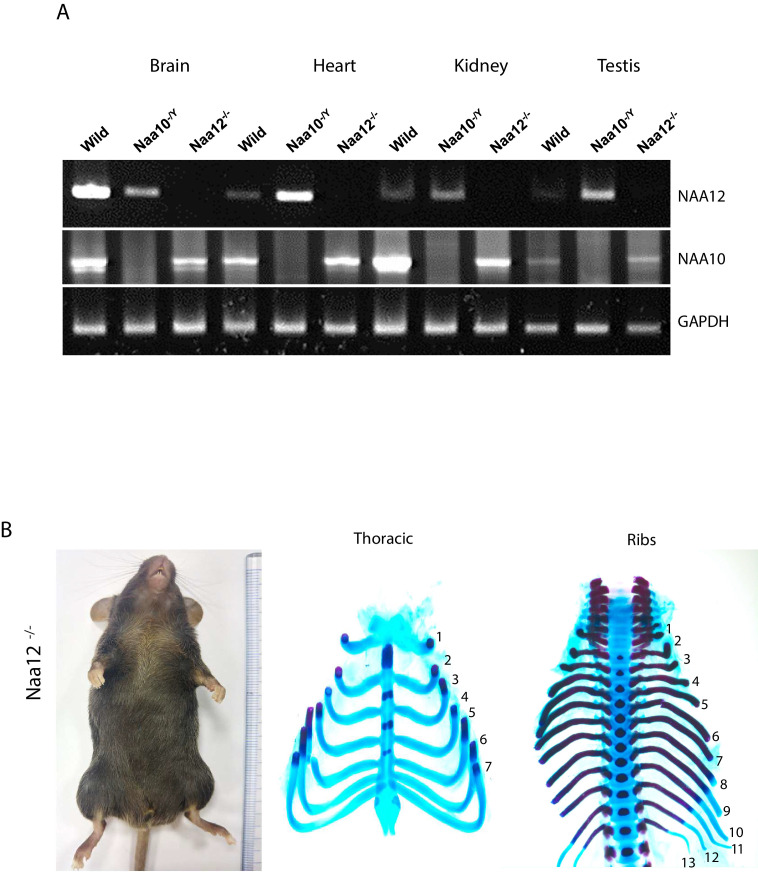
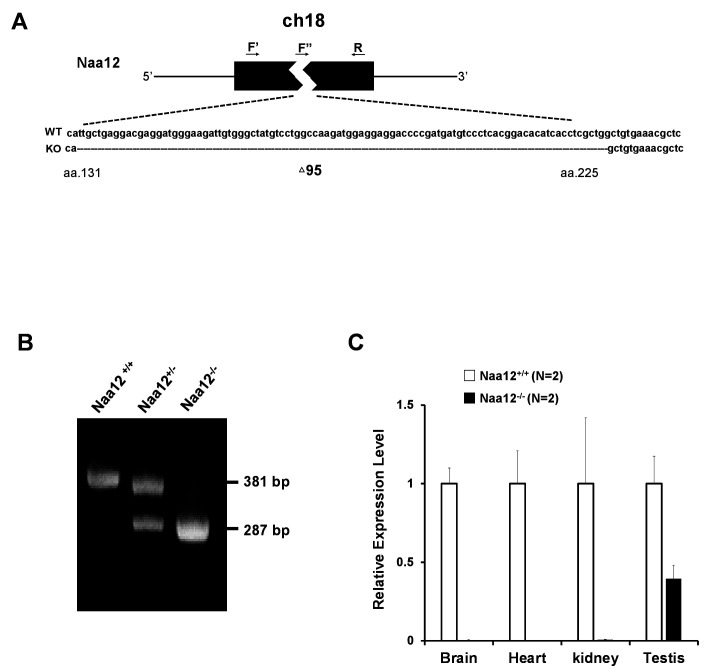
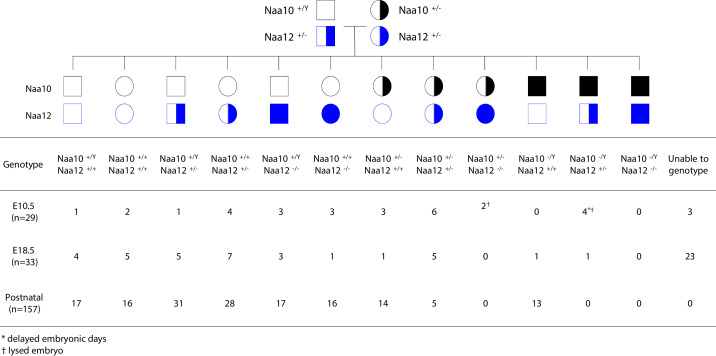
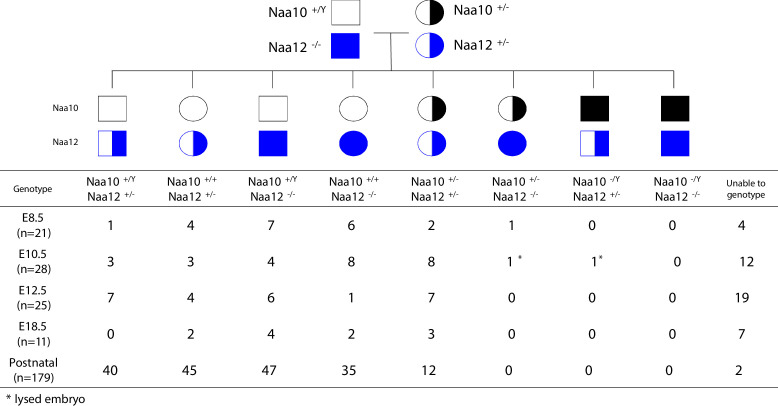
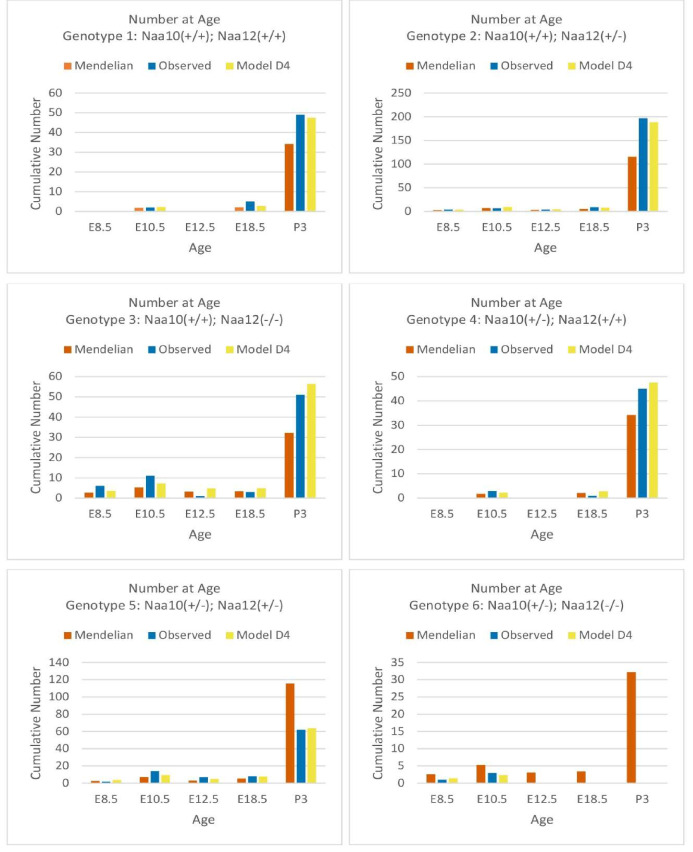
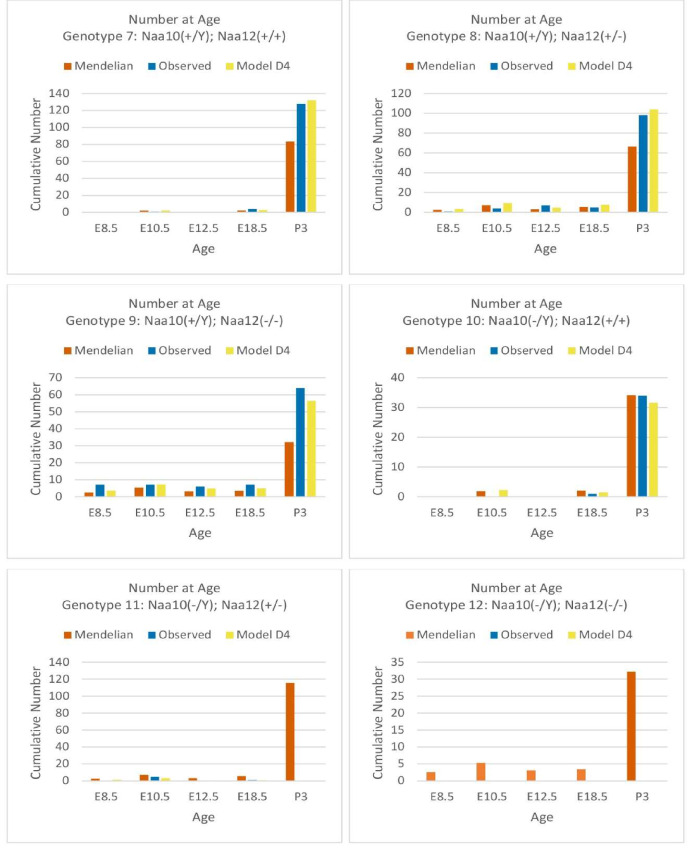
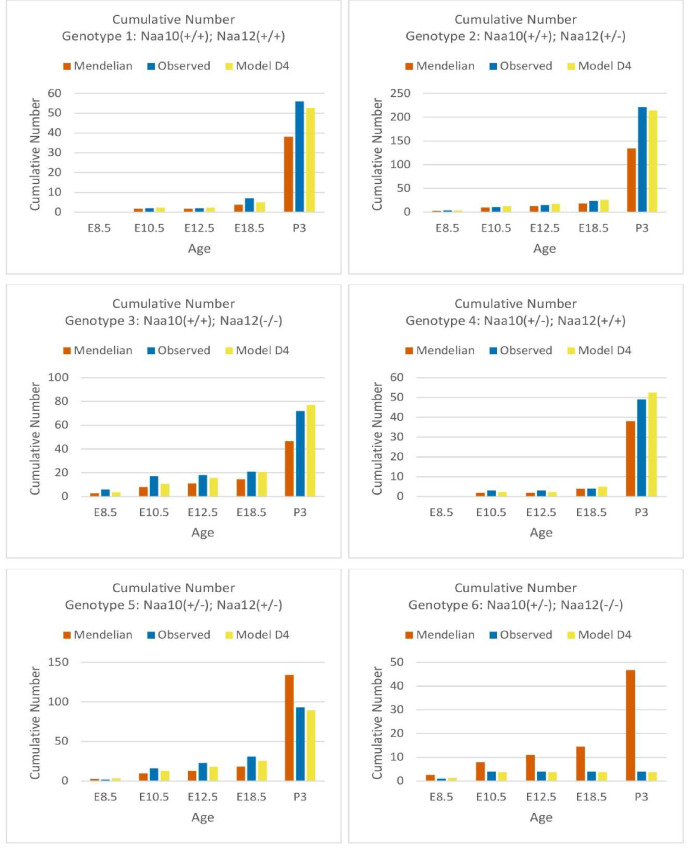
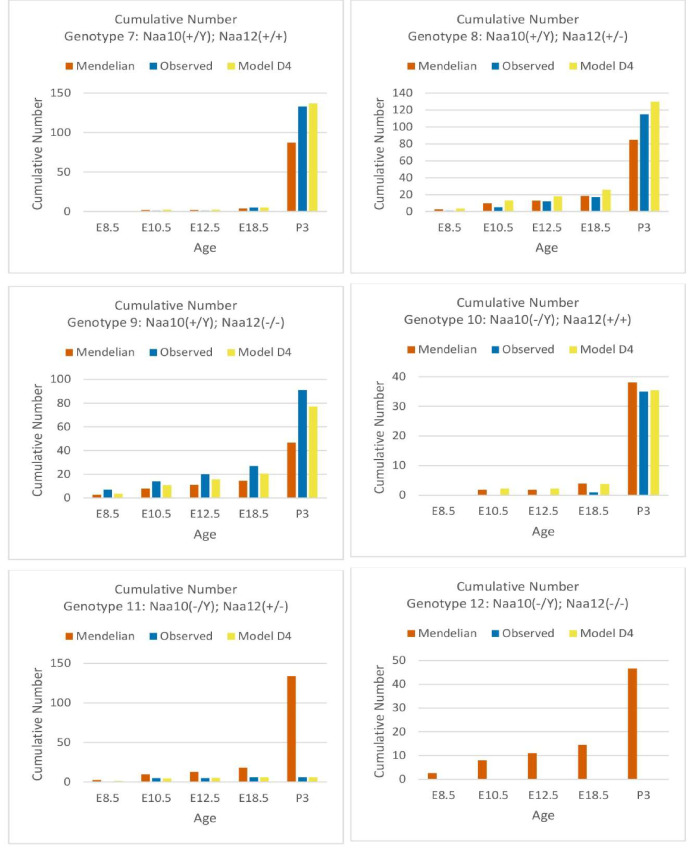
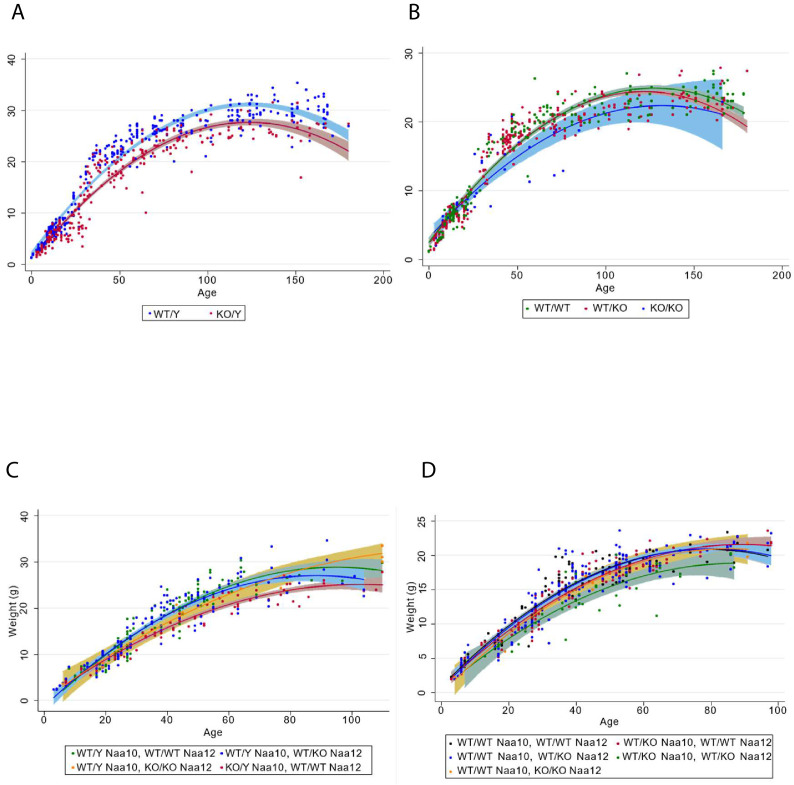
Amino-terminal acetylation is catalyzed by a set of N-terminal acetyltransferases (NATs). The NatA complex (including X-linked Naa10 and Naa15) is the major acetyltransferase, with 40-50% of all mammalian proteins being potential substrates. However, the overall role of amino-terminal acetylation on a whole-organism level is poorly understood, particularly in mammals. Male mice lacking Naa10 show no globally apparent in vivo amino-terminal acetylation impairment and do not exhibit complete embryonic lethality. Rather Naa10 nulls display increased neonatal lethality, and the majority of surviving undersized mutants exhibit a combination of hydrocephaly, cardiac defects, homeotic anterior transformation, piebaldism, and urogenital anomalies. Naa12 is a previously unannotated Naa10-like paralog with NAT activity that genetically compensates for Naa10. Mice deficient for Naa12 have no apparent phenotype, whereas mice deficient for Naa10 and Naa12 display embryonic lethality. The discovery of Naa12 adds to the currently known machinery involved in amino-terminal acetylation in mice.

Keywords: N-terminal acetylation; NAA10; NAA12; developmental biology; embryonic lethality; hydrocephaly; mouse; protein modification.


Conflict of interest statement

HK, ML, MD, SS, LG, TP, NM, RR, DB, AG, MF, JC, AS, SL, AI, EM, SS, SJ, SJ, SJ, SC, TK, HK, CL, TR, TA, RM, GO, GL No competing interests declared

Figures

Figure 1.
Figure 1.. Deficiency of Naa10 leads to abnormal development and postnatal lethality.
(A) Naa10+/Y, Naa10-/Y, and Naa10tm1a/Y embryos at E10.5. Growth retardation (5/33, more than five somites lower or undersized compared to littermate controls), kinky trunk, and developmental arrest are shown in Naa10-/Y (4/33) and Naa10tm1a/Y (1/5). Scale bars: 500 μm. (B) The percentage lethality in newborns, comparing Naa10 wildtype (WT) (Naa10+/Y and Naa10+/+), Naa10-/+ and Naa10-/Y pups until P3, derived from matings between heterozygous females and WT males. Approximately 11.6% (10/86) of WT, 24% (13/54) of Naa10+/-, and 76.3% (29/38) of Naa10-/Y mice were found dead before P3. (C) Representative images of Naa10-/Y pups during early postnatal days compared with Naa10+/Y. Severe developmental defects such as malformations of head and lower body (one leg; black arrowheads), whole-body edema, and anophthalmia (black arrows) are shown (N = 1 each). (D) Hematoxylin and eosin (H&E)-stained heart transverse section at E14.5 and vertical section at E18.5, comparing Naa10+/Y and Naa10-/Y embryos. Naa10-/Y embryo shows a ventricular septal defect (VSD) at E14.5 and E18.5. Also, at E18.5, Naa10-/Y embryo shows atrial septal defect (ASD). Arrow indicates VSD, ASD, and double outlet right ventricle (DORV). Scale bars: 20 μm.
Figure 1—figure supplement 1.
Figure 1—figure supplement 1.. Generation and confirmation of Naa10tm1a mice.
(A) Schematic illustration of the Naa10tm1a mice. (B) PCR confirmation of Naa10 deficiency. (C) Confirmation of Naa10 protein in kidney tissue by western blot. Naa10 protein is not detected in Naa10-/Y mouse. (D) Expression pattern of Naa10 in the embryo. β-Gal staining represents Naa10 localization.
Figure 1—figure supplement 2.
Figure 1—figure supplement 2.. Gross anatomy and histology of neonatal mouse hearts.
(A) Wildtype male heart outflow tract region indicating separate aorta and pulmonary trunks nestled between left and right atria. (B) Naa10-/- female heart from dying P0 pup only has a single outflow tract emerging from the right ventricle, resulting in persistent truncus arteriosus. (C) Naa10-/y male heart from dying P0 pup has separate outflow tracts but both emerge from the right ventricle, resulting in double outlet right ventricle. (D) Normal histology from wildtype male heart of pulmonary artery exiting the right ventricle. (E) Histology from Naa10-/- heart of single outflow tract exiting the right ventricle with tricuspid valve leaflets. (F) Histology from Naa10-/y heart of both pulmonary and aortic arteries emerging from right ventricle within the same plane. (G) Naa10-/- histology showing membranous ventricular septal defect (VSD). (H) Naa10-/y histology showing muscular VSD. (I) Normal heart revealing closed ductus arterious. (J) Naa10-/- histology showing open ductus arterious leading to pulmonary overload and likely lethality.
Figure 2.
Figure 2.. Pleiotropic phenotypes of Naa10 knockout (KO) mice.
(A–C) Representative images of abnormalities in Naa10-/Y compared with Naa10+/Y. (A) Body weight of male (left) and female (right) versus ages was monitored from 2 weeks. The weight of Naa10-/Y and Naa10-/- mice is markedly reduced compared with that of the wildtype (WT) mice. Asterisks indicate a statistical difference calculated by Student’s t-test: *p<0.05. (B) Representative images of completely penetrant phenotypes. Hypopigmentation (Naa10+/Y, n = 243; Naa10-/Y, n = 121; Naa10tm1a/Y, n = 17) and supernumerary ribs (Naa10+/Y, n = 3; Naa10-/Y, n = 6; Naa10tm1a/Y, n = 2; E18.5) were found 100% in Naa10-deficient mice. (C) Naa10-/Y is smaller in size and has round-shaped head (Naa10+/Y 0/59, Naa10-/Y 7/33). Over time, hydrocephaly became apparent (N = 14/29 [~48%] for >P7 male Naa10-Y; N = 7/19 [~36%] for >P7 female Naa10-/-). Hydronephrosis (red arrow, Naa10+/Y 0/23, Naa10-/Y 14/29, Naa10+/+ 0/5, Naa10-/- 7/19) and abnormal genitalia (black arrow) of male (middle, Naa10+/Y 0/23, Naa10-/Y 16/29) and female (bottom, hydrometrocolpos, Naa10+/+ 0/5, Naa10-/- 7/19) are shown.
Figure 2—figure supplement 1.
Figure 2—figure supplement 1.. Skeletal phenotype by CT scanning.
(A) In wildtype (WT) mice, 13 thoracic vertebrae and ribs are numbered, whereas 14 thoracic vertebrae and ribs are counted in mutants (Naa10-/Y) (WT on the left, mutant on the right). n = 11 CT scans for Naa10-/Y compared to n = 18 Naa10+/Y. (B–D) Different number of ribs are linking the sternum between in Naa10-/Y, Naa10-/-, and WT. (B) Seven ribs linking the sternum in WT. (C) Eight ribs linking the sternum (the white arrow shows the eighth rib) in Naa10-/Y. (D) Seven on one side plus seven and one almost linking on the other side. In two mice, an asymmetrical link was observed. White arrow shows the eighth asymmetrical rib. (E, F) Abnormalities in the cervical phenotype. (E) Cervical WT/morphology. (F) Partial fusion of C1 and C2 dorsal arch in one mutant mouse.
Figure 2—figure supplement 2.
Figure 2—figure supplement 2.. Hydronephrosis and hydrocephaly in Naa10 KO mice.
(A) Representative images and histology of renal defects at E18.5 (n = 6 out of 39 examined) and P3 (n = 4 out of 11 examined). (B) Hydrocephaly (n = 3 CT scans for Naa10-/Y mice with hydrocephaly compared to n = 3 Naa10-/Y mice without hydrocephaly). (C) Kaplan–Meier survival curve of the Naa10+/Y and Naa10-/Y male mice starting at 4 days of life, thus not including any mice that died in the first three days of life.
Figure 3.
Figure 3.. Activity measurement of NatA from wildtype (WT) and Naa10 knockout (KO) mice.
(A) Correlation of Naa10 alteration state on amino-terminal acetylation in mouse embryonic fibroblasts (MEFs). Each dot (n = 533) represents the average amino-terminal acetylation percentage of five replicates of Naa10+/Y and Naa10-/Y, respectively. Dashed lines are the borders of ±10% difference. Except for the 10 dots, 522 of the 533 dots are within the borders. The marginal histograms show the distribution of amino-terminal acetylation data points. (B) Immunoprecipitation of Naa15. Liver tissue from WT and Naa10 KO mouse was lysed and incubated with anti-Naa15 antibody to retrieve NatA complexes. Proteins were separated by SDS-PAGE and immunoblots probed with anti-Naa15 antibody and anti-NAA10 antibody. (C) Catalytic activity of immunoprecipitated NatA. The catalytic activity of NatA precipitated from WT and Naa10 KO mouse liver tissue by anti-Naa15 was measured towards the NatA substrate peptide SESS24 in an in vitro [14C]-Ac-CoA–based acetylation assay. Control reactions were performed with no enzyme or no peptide to account for background signal. The immunoprecipitation (IP) and activity measurements were performed in three independent setups, each with three technical replicates per assay. One representative setup is shown.
Figure 3—figure supplement 1.
Figure 3—figure supplement 1.. Identification of a potential Naa10 homolog.
(A) Construction of Naa10 Southern blot probe. (B) Southern blot membrane after hybridization with a Naa10 probe. Expected size band, restricted with Apa I and Xba I, are shown. (C) Ribosome profiling traces for the potential Naa10 paralog (Gm16286, UniProt: Q9CQX6). Picture was modified from GWIPS genome browser, Chr 18, 80206601–80212942.
Figure 4.
Figure 4.. Characterization of Naa12.
(A) In vitro N-terminal acetyltransferase radioactive-based assay. Comparison of mouse Naa10 and Naa12 towards Naa10 peptide substrates, beta-actin (DDDIA-) and gamma-actin (EEEIA-), and the optimal NatA complex peptide substrate, SESSS-. Background control reactions were performed in the absence of either peptide or enzyme. Assays were performed in triplicate; error bars represent SEM. (B) Co-immunoprecipitation assay. HEK293 cells were transfected as indicated and lysed after 48 hr. Cell lysates were incubated with 1 μg anti-V5 antibody to precipitate V5-tagged Naa15. The isolated complexes were separated on SDS-PAGE and probed with the indicated antibodies. (C) Recombinant mouse Naa12/human Naa15 chimera complex activity. Radioactive acetyltransferase activity assay evaluating the activity of mNaa12-hNaa15 towards peptide (closed circles, ‘mNaa12-hNaa15’) and peptide chemical acetylation in the absence of enzyme (closed circles, ‘Buffer’) as well as chemical acetylation of the enzyme in the absence of peptide (open circles) assay and background (open circles). Error bars represent SD of two technical replicates. These are the same results from fraction #14 (both SESSS- and No Peptide) and both Buffer and Background used to illustrate the size-exclusion-purified mNaa12-hNaa15 complex activity in Figure 4—figure supplement 1F.
Figure 4—figure supplement 1.
Figure 4—figure supplement 1.. Characterization of a potential Naa10 homolog.
(A) qPCR analyses of mouse NATs (mNATs) in Naa10 wildtype (WT) and knockout (KO) adult mouse tissue. (B) Sequence alignment of mNaa10 isoforms and paralogs, including the potential Naa10 paralog mNaa12 (Gm16286, UniProt: Q9CQX6) using Clustal Omega (EMBL-EBI). The peptide used for immunization of rabbits to generate a specific antibody is indicated in red. (C) Full-length mNAT cDNA from mouse was amplified and cloned into pGEX-4T1. Proteins were expressed in E. coli BL21 (DE3) and purified via GSH-Sepharose. Shown is a Coomassie stain of fraction 1–4. (D) Cross-reactivity and sensitivity of the used NAT antibodies. 1–20 pmol of GST-mNAT proteins were separated on SDS-PAGE followed by western blot, probed with the indicated antibodies. (E) Recombinant mouse Naa12/human Naa15 chimera complex. Silver-stained denaturing SDS-PAGE (left) containing fractions (#10–20) eluted from an S200 size-exclusion chromatography (SEC) column with fractions evaluated for NatA-type activity indicated (asterisks, below gel) with (F) corresponding radioactive acetyltransferase activity assay comparing the activity of indicated fractions and buffer control (chemical acetylation) towards the SESSS- peptide (filled circles), in the absence of peptide (open circles), and assay background (x). Error bars represent SD of two technical replicates.
Figure 4—figure supplement 2.
Figure 4—figure supplement 2.. Confirmation and characterization of Naa12 knockout (KO) mice.
(A) Expression of Naa10 and Naa12 in wildtype (WT), Naa10 KO and Naa12 KO tissues, adult mice 13 weeks of age, (brain, heart, kidney, and testis) by RT-PCR. Expression of GAPDH was analyzed as an endogenous control. (B) Phenotypes in Naa12 KO mice. Lack of hypopigmentation (upper; N = 29) and lack of supernumerary ribs (middle and bottom; E18.5; N = 7) in Naa12 KO mouse.
Figure 5.
Figure 5.. Generation of Naa12 knockout (KO) mice.
(A) Scheme of Naa12 (Gm16286, UniProt: Q9CQX6) deletion used to generate Naa12 KO mouse. 95 base pairs (131–225) were deleted. F′: genomic DNA forward primer; F′′: cDNA forward primer; R: reverse primer. (B) Genotyping of Naa12 KO mice by PCR. Wildtype (WT) allele size was 381 bp and targeted allele size was 287 bp. (C) mRNA level of Naa12 was analyzed in selected tissues by qPCR. Relative expression level of WT (white bars) and Naa12 KO (black bars) after normalizing to that of GAPDH.
Figure 6.
Figure 6.. Lethality in Naa10 Naa12 double-knockout (DKO) mice.
Naa10 Naa12 DKO exhibit embryonic lethality. Pedigree and genotypes of pups and embryos at E10.5 and E18.5 from Naa10+/- Naa12+/- female mice crossed to the Naa10+/Y Naa12+/- male mice.
Figure 6—figure supplement 1.
Figure 6—figure supplement 1.. Genotypes of offspring from Naa10+/- Naa12+/- female mice crossed to the Naa10+/Y Naa12-/- male mice.
Naa10 Naa12 double-knockout (DKO) exhibit embryonic lethality. Pedigree of mating and genotypes of pups and embryos at E8.5, E10.5, E12.5, and E18.5.
Figure 6—figure supplement 2.
Figure 6—figure supplement 2.. Comparisons of Mendelian predicted, observed, and model D4 predicted offspring numbers for female genotypes (#1–#6) at each age.
Figure 6—figure supplement 3.
Figure 6—figure supplement 3.. Comparisons of Mendelian predicted, observed, and model D4 predicted offspring numbers for male genotypes (#7–#12) at each age.
Figure 6—figure supplement 4.
Figure 6—figure supplement 4.. Comparisons of cumulative Mendelian predicted, observed, and model D4 predicted offspring numbers for female genotypes (#1–#6) at each age.
Figure 6—figure supplement 5.
Figure 6—figure supplement 5.. Comparisons of cumulative Mendelian predicted, observed, and model D4 predicted offspring numbers for male genotypes (#7–#12) at each age.
Figure 7.
Figure 7.. Decreased body weight in compound heterozygous females.
(A) Male body weight for the Naa10 mice on inbred genetic background (eight backcrosses to C57bl6/J). (B) Female body weight for the Naa10 mice on inbred genetic background (eight backcrosses to C57bl6/J). (C) Male body weight for the Naa10 and Naa12 mice on mixed genetic background. (D) Female body weight for the Naa10 and Naa12 mice on mixed genetic background.

Similar articles

Cited by

References

    1. Aksnes H, Ree R, Arnesen T. Co-translational, Post-translational, and Non-catalytic roles of N-Terminal acetyltransferases. Molecular Cell. 2019;73:1097–1114. doi: 10.1016/j.molcel.2019.02.007. - DOI - PMC - PubMed
    1. Arnesen T, Anderson D, Baldersheim C, Lanotte M, Varhaug JE, Lillehaug JR. Identification and characterization of the human ARD1-NATH protein acetyltransferase complex. Biochemical Journal. 2005;386:433–443. doi: 10.1042/BJ20041071. - DOI - PMC - PubMed
    1. Arnesen T, Gromyko D, Pendino F, Ryningen A, Varhaug JE, Lillehaug JR. Induction of apoptosis in human cells by RNAi-mediated knockdown of hARD1 and NATH, components of the protein N-alpha-acetyltransferase complex. Oncogene. 2006a;25:4350–4360. doi: 10.1038/sj.onc.1209469. - DOI - PubMed
    1. Arnesen T, Betts MJ, Pendino F, Liberles DA, Anderson D, Caro J, Kong X, Varhaug JE, Lillehaug JR. Characterization of hARD2, a processed hARD1 gene duplicate, encoding a human protein N-alpha-acetyltransferase. BMC Biochemistry. 2006b;7:13. doi: 10.1186/1471-2091-7-13. - DOI - PMC - PubMed
    1. Arnesen T, Van Damme P, Polevoda B, Helsens K, Evjenth R, Colaert N, Varhaug JE, Vandekerckhove J, Lillehaug JR, Sherman F, Gevaert K. Proteomics analyses reveal the evolutionary conservation and divergence of N-terminal acetyltransferases from yeast and humans. PNAS. 2009;106:8157–8162. doi: 10.1073/pnas.0901931106. - DOI - PMC - PubMed

Publication types

Substances