Non-linear dimensionality reduction on extracellular waveforms reveals cell type diversity in premotor cortex
- PMID: 34355695
- PMCID: PMC8452311
- DOI: 10.7554/eLife.67490
Non-linear dimensionality reduction on extracellular waveforms reveals cell type diversity in premotor cortex
Abstract
Cortical circuits are thought to contain a large number of cell types that coordinate to produce behavior. Current in vivo methods rely on clustering of specified features of extracellular waveforms to identify putative cell types, but these capture only a small amount of variation. Here, we develop a new method (WaveMAP) that combines non-linear dimensionality reduction with graph clustering to identify putative cell types. We apply WaveMAP to extracellular waveforms recorded from dorsal premotor cortex of macaque monkeys performing a decision-making task. Using WaveMAP, we robustly establish eight waveform clusters and show that these clusters recapitulate previously identified narrow- and broad-spiking types while revealing previously unknown diversity within these subtypes. The eight clusters exhibited distinct laminar distributions, characteristic firing rate patterns, and decision-related dynamics. Such insights were weaker when using feature-based approaches. WaveMAP therefore provides a more nuanced understanding of the dynamics of cell types in cortical circuits.
Keywords: cell types; circuits; layers; neuroscience; nonlinear dimensionality reduction; rhesus macaque; waveforms.
© 2021, Lee et al.
Conflict of interest statement
EL, HB, AT, SA, MM, KS, CC No competing interests declared
Figures





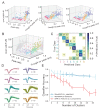
 is the pre-hyperpolarization peak (A1);
  is the depolarization trough; and
  is the post-hyperpolarization peak (A2). (B) A three-dimensional scatter plot with marginal distributions of waveforms and GMM classes on the three specified features in (A). Narrow-spiking (NS) are in red; broad-spiking (BS) in green; narrow-spiking triphasic (NST) in yellow; and broad-spiking triphasic (BST) types are in blue. Trough to peak was calculated as the time between
  and
and  ; peak ratio was determined as the ratio between the heights of
  and
and  (A1/A2); and AP width was determined as the width of the depolarization trough
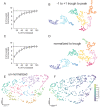
  using the MLIB toolbox (Stuttgen, 2019). (C) The optimal cluster number in the three-dimensional feature space in (B) was determined to be four clusters using the Bayesian information criterion (BIC) (Trainito et al., 2019). The number of clusters was chosen to be at the ‘elbow’ of the BIC curve (green chevron). (D) A confusion matrix for a gradient boosted decision tree classifier with 5-fold cross-validation with hyperparameter optimization. The main diagonal contains the classification accuracy percentages across the four GMM clusters and the off-diagonal contains the misclassification rates. The average accuracy across classes was 78%. (E) The same scatter plot of normalized EAP waveforms in UMAP space as in Figure 3A but now colored by GMM category. Figure 4—figure supplement 1: We show that WaveMAP clusterings are more consistent across random data subsets than either DBSCAN on t-SNE or a GMM on PCA. Figure 4—figure supplement 2: GMMs fail to full capture the latent structure in the waveforms.


 is the pre-hyperpolarization peak (A1);
  is the depolarization trough; and
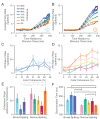
  is the post-hyperpolarization peak (A2). AP width is the distance in time between the falling and rising phase of the depolarization trough at its full-width half minimum. The trough to peak duration is the distance between the minimum of the depolarization trough and the peak of the post-hyperpolarization peak. The peak ratio is the height (above zero) of the pre-hyperpolarization peak over the height (again, above zero) of the post-hyperpolarization peak. The same diagram as in Figure 4A but repeated here. (B, C, D) The waveform data points in the projected UMAP space and color coded according to their AP width, trough to peak duration, and peak ratio, respectively.



References
-
- Aggarwal CC, Hinneburg A, Keim DA. In: Database Theory — ICDT 2001. Bussche J, Anden V, Vianu V. ictor, editors. Heidelberg, Berlin: Springer; 2001. On the surprising behavior of distance metrics in high dimensional space; pp. 420–434. - DOI
-
- Ali M, Jones MW, Xie X, Williams M. TimeCluster: dimension reduction applied to temporal data for visual analytics. The Visual Computer. 2019;35:1013–1026. doi: 10.1007/s00371-019-01673-y. - DOI
-
- Amatrudo JM, Weaver CM, Crimins JL, Hof PR, Rosene DL, Luebke JI. Influence of highly distinctive structural properties on the excitability of pyramidal neurons in monkey visual and prefrontal cortices. Journal of Neuroscience. 2012;32:13644–13660. doi: 10.1523/JNEUROSCI.2581-12.2012. - DOI - PMC - PubMed
Publication types
MeSH terms
Associated data
Grants and funding
- K99 NS092972/NS/NINDS NIH HHS/United States
- HHMI/Howard Hughes Medical Institute/United States
- R01 MH116008/MH/NIMH NIH HHS/United States
- R01 NS122969/NS/NINDS NIH HHS/United States
- R01 DC014034/DC/NIDCD NIH HHS/United States
- R00 NS092972/NS/NINDS NIH HHS/United States
- UH2 NS095548/NS/NINDS NIH HHS/United States
- R00 MH101234/MH/NIMH NIH HHS/United States
- U01 NS098968/NS/NINDS NIH HHS/United States
- U01 DC017844/DC/NIDCD NIH HHS/United States
- DP1 HD075623/HD/NICHD NIH HHS/United States
- R01 AG078460/AG/NIA NIH HHS/United States
LinkOut - more resources
Full Text Sources

