. 2022 Jan;12(1):71-82.
doi: 10.1002/alr.22874. Epub 2021 Aug 6.

Nasal endoscopy, room filtration, and aerosol concentrations during live outpatient encounters: a prospective, case-control study

Affiliations

Nasal endoscopy, room filtration, and aerosol concentrations during live outpatient encounters: a prospective, case-control study

Amarbir S Gill et al. Int Forum Allergy Rhinol. 2022 Jan.

Abstract

Background: The coronavirus disease 2019 (COVID-19) pandemic has highlighted safety concerns surrounding possible aerosol-generating procedures, but comparative data on the smallest particles capable of transmitting this virus remain limited. We evaluated the effect of nasal endoscopy on aerosol concentration and the role of a high-efficiency particulate air (HEPA) filter in reducing aerosol concentration.

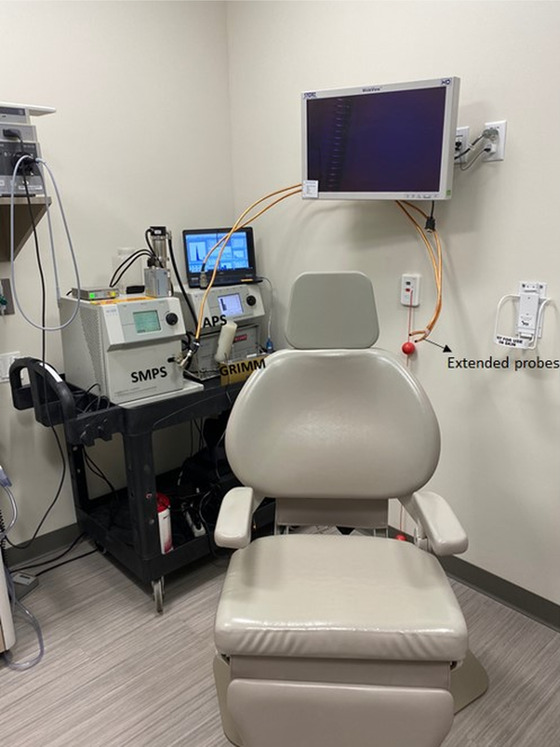
Methods: Otolaryngology patients were prospectively enrolled in an outpatient, cross-sectional study. Demographic information and clinic room characteristics were recorded. A scanning mobility particle sizer and GRIMM aerosol monitor measured aerosols 14.3 nm to 34 μm in diameter (i.e., particles smaller than those currently examined in the literature) during (1) nasal endoscopy (± debridement) and (2) no nasal endoscopy encounters. One-way analysis of variance (ANOVA) and Student's t test were performed to compare aerosol concentrations and impact of HEPA filtration.

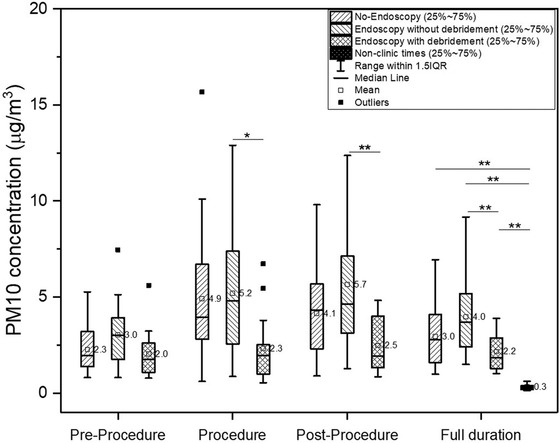
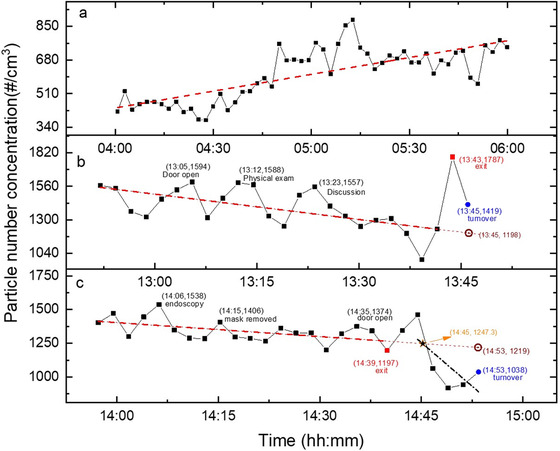
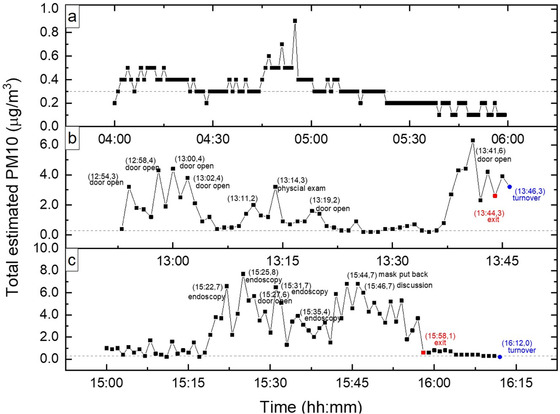
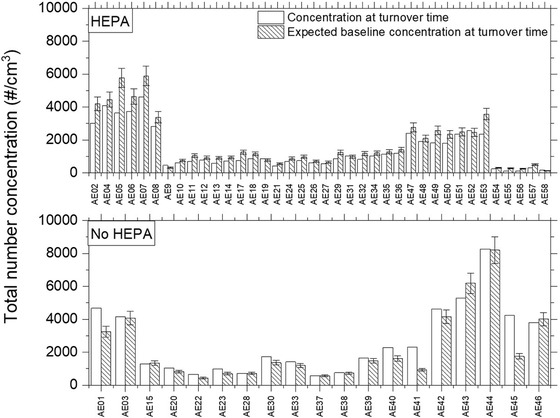
Results: Sixty-two patients met inclusion criteria (25 nasal endoscopy without debridement; 18 nasal endoscopy with debridement; 19 no nasal endoscopy). There was no significant difference in age or gender across cohorts. Aerosol concentration in the nasal endoscopy cohort (± debridement) was not greater than the no nasal endoscopy cohort (p = 0.36; confidence interval [95% CI], -1.76 to 0.17 μg/m3 ; and p = 0.12; 95% CI, -0.11 to 2.14 μg/m3 , respectively). Aerosol concentrations returned to baseline after 8.76 min without a HEPA filter versus 4.75 min with a HEPA filter (p = 0.001; 95% CI, 1.73-6.3 min).

Conclusion: Using advanced instrumentation and a comparative study design, aerosol concentration was shown to be no greater during nasal endoscopy versus no endoscopy encounters. HEPA filter utilization reduced aerosol concentrations significantly faster than no HEPA filter.

Keywords: COVID-19; aerosol; filter; nasal endoscopy; otolaryngology.


Conflict of interest statement

Jeremiah A. Alt: OptiNose, GlycoMira, Medtronic, and GSK. Kerry Kelly: Tetrad.

Figures

FIGURE 1
FIGURE 1
Setup of the aerosol measurement equipment in the clinic. Copper tubing was used to transfer the aerosols from near the patient to the SMPS and APS. Abbreviations: APS, aerodynamic particle sizer; SMPS, scanning mobility particle sizer
FIGURE 2
FIGURE 2
Total particle number concentrations, as measured by the SMPS, for (A) example non‐clinic times (4:00 a.m. to 6 a.m.; March 23, 2021), (B) no endoscopy during the visit and no HEPA use at the end of the visit, (C) endoscopy during the visit and HEPA use at end of the visit. The dotted line represents the baseline fit, the dash‐dot line represents the drop fit, the red square represents exit time, and the blue circle represent turnover time. The intersection point (denoted with a star) was used to estimate time to reach baseline concentrations. The aerosol peaks were labeled (time, # concentration) with corresponding events, from the datasheet. The estimated baseline concentration (circle with dot) at turnover time was also identified. Of note, a few encounters (outlined in Figure S1A–C) were excluded from this analysis for one of the following reasons: (1) room was turned over immediately after everyone exited and the next patient entered within next 5 to 7 min; (2) the extrapolated baseline did not intersect with the drop fit; (3) the intersection point occurred after the “room turned over.” Abbreviations: HEPA, high‐efficiency particulate air; SMPS, scanning mobility particle sizer
FIGURE 3
FIGURE 3
Estimated total PM10 mass concentration during preprocedure, during procedure, postprocedure, the full duration of patient visits, and during non‐clinic times (n = 15). The cohorts included no‐endoscopy clinic visits (n = 15), and endoscopy with (n = 18) and without debridement (n = 24). Note: the cohort size used in this analysis is less than the total study cohort size, due to loss of GRIMM measurements on March 4 (n = 2) and April 4 (n = 3). Statistically significant differences between pairs were denoted with *p < 0.05, and **p < 0.01. Abbreviations: IQR, interquartile range; PM10, particulate matter <10 μm in diameter [Correction added on 6 September 2021, after first online publication: Figure 3 has been corrected.]
FIGURE 4
FIGURE 4
Total estimated PM10 mass concentration, as measured by GRIMM, for (A) example non‐clinical times (4:00 a.m. to 6 a.m., March 22, 2021), (B) no endoscopy during the visit and no HEPA use at the end of visit, (C) endoscopy during the visit and HEPA use at the end of visit. The dotted line represents baseline fit. The red square represents exit time, and the blue circle represents turnover time. The aerosol peaks were labeled with corresponding events from the datasheet. Abbreviations: HEPA, high‐efficiency particulate air; PM10, particulate matter <10 μm in diameter
FIGURE 5
FIGURE 5
Particle concentration as measured by SMPS versus expected baseline concentration at turnover time for HEPA and no HEPA cases. The error bar represents a 10% standard error in expected aerosol baseline concentration. Abbreviations: HEPA, high‐efficiency particulate air; SMPS, scanning mobility particle sizer

Similar articles

Cited by

  • COVID-19 and rhinological surgery.
    Patel R, Fang CH, Grube JG, Eloy JA, Hsueh WD. Patel R, et al. Oper Tech Otolayngol Head Neck Surg. 2022 Jun;33(2):103-111. doi: 10.1016/j.otot.2022.04.005. Epub 2022 Apr 28. Oper Tech Otolayngol Head Neck Surg. 2022. PMID: 35502266 Free PMC article.

References

    1. Zou L, Ruan F, Huang M, et al. SARS‐CoV‐2 viral load in upper respiratory specimens of infected patients. N Engl J Med. 2020;382:1177‐1179. - PMC - PubMed
    1. Kohanski MA, Lo LJ, Waring MS. Review of indoor aerosol generation, transport, and control in the context of COVID‐19. Int Forum Allergy Rhinol. 2020;10(10):1173‐1179. - PMC - PubMed
    1. Centers for Disease Control and Prevention (CDC) . Clinical questions about COVID‐19: questions and answers. Atlanta, GA: CDC; March 2021. https://www.cdc.gov/coronavirus/2019‐ncov/hcp/faq.html. Accessed July 22, 2021.
    1. World Health Organization (WHO) . Infection prevention and control of epidemic‐ and pandemic‐prone acute respiratory infections in health care. Geneva: WHO; 2014. https://www.who.int/publications/i/item/infection‐prevention‐and‐control.... Accessed July 22, 2021. - PubMed
    1. Centers for Disease Control and Prevention (CDC), National Center for Emerging and Zoonotic Infectious Diseases (NCEZID), Division of Healthcare Quality Promotion (DHQP) . Appendix B. Air. Guidelines for Environmental Infection Control in Health‐Care Facilities (2003). Atlanta, GA: CDC; Page last reviewed July 22, 2019. https://www.cdc.gov/infectioncontrol/guidelines/environmental/appendix/a.... Accessed July 22, 2021.