

Metabolic Profiling of Neocortical Tissue Discriminates Alzheimer's Disease from Mild Cognitive Impairment, High Pathology Controls, and Normal Controls
- PMID: 34355917
- PMCID: PMC11060066
- DOI: 10.1021/acs.jproteome.1c00290
Metabolic Profiling of Neocortical Tissue Discriminates Alzheimer's Disease from Mild Cognitive Impairment, High Pathology Controls, and Normal Controls
Abstract
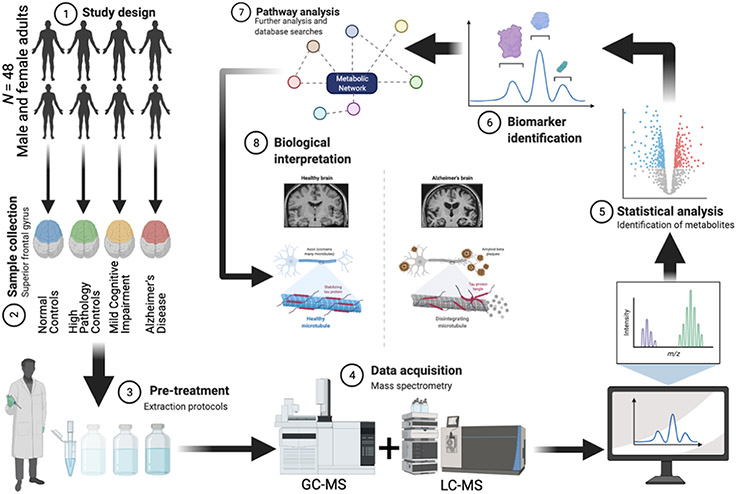
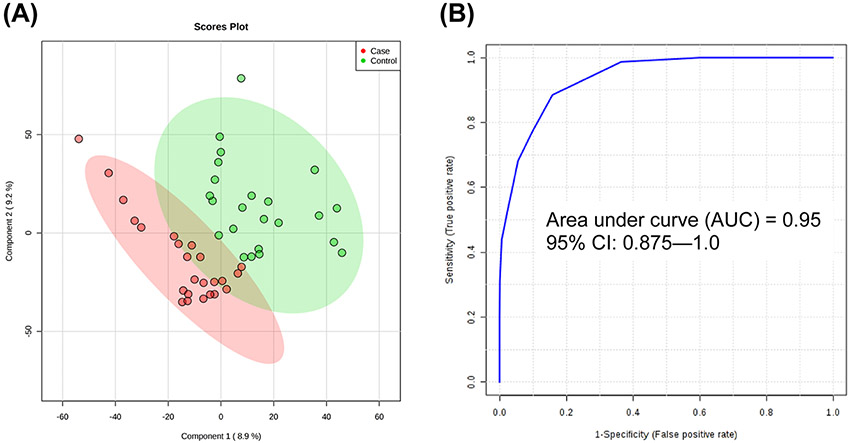
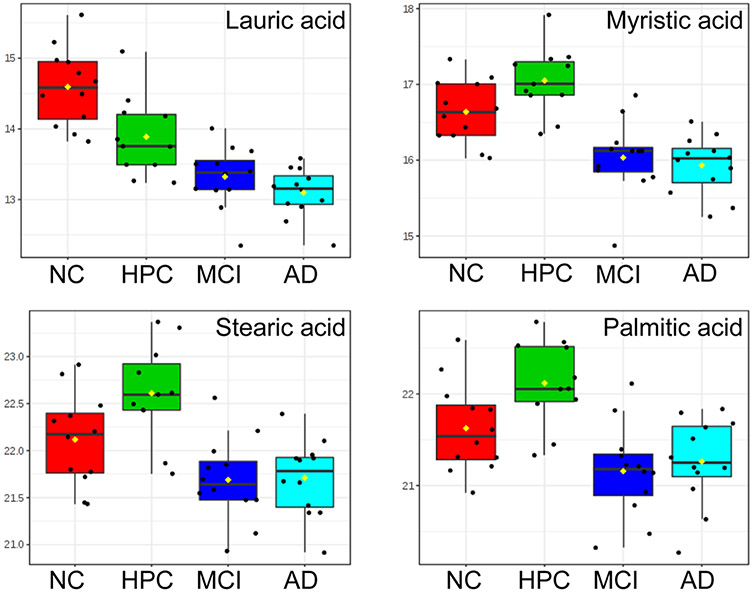
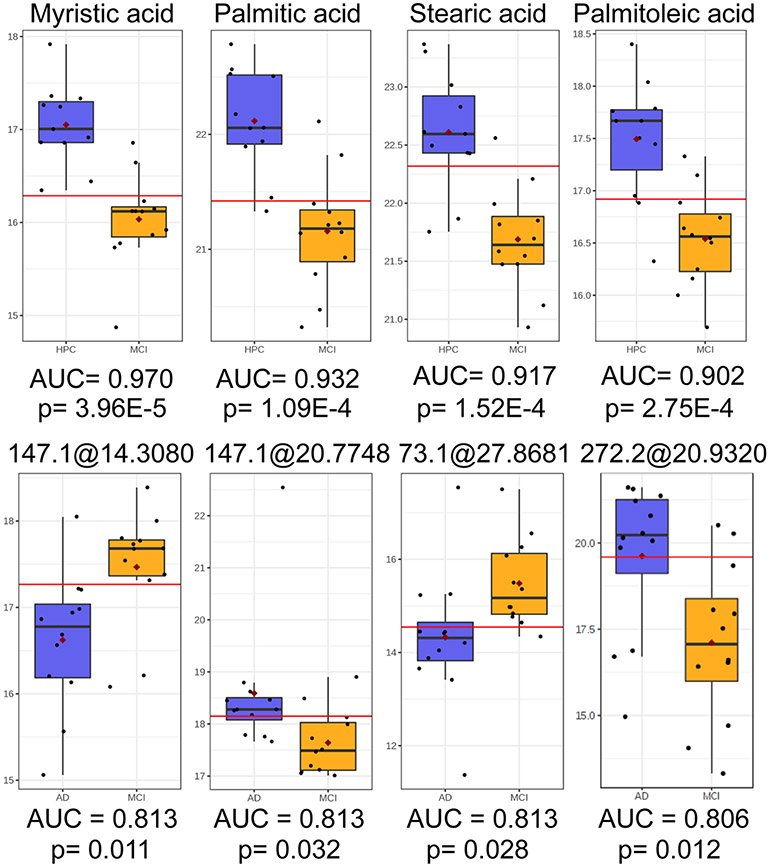
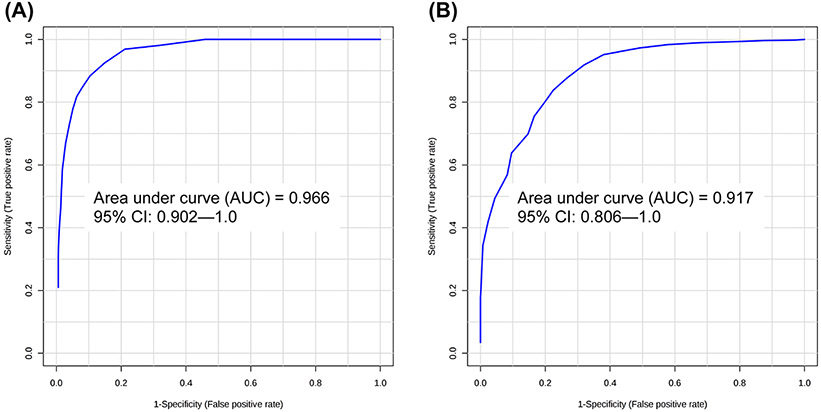
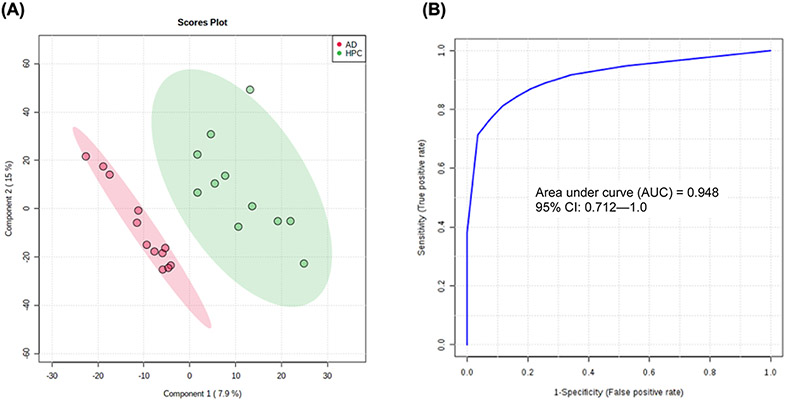
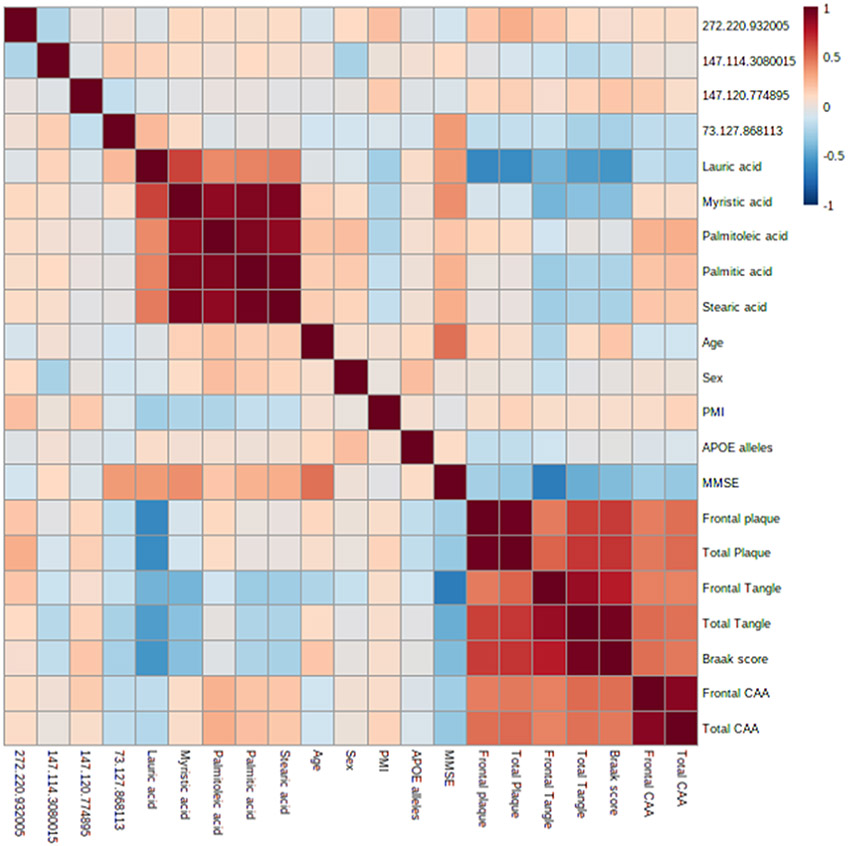
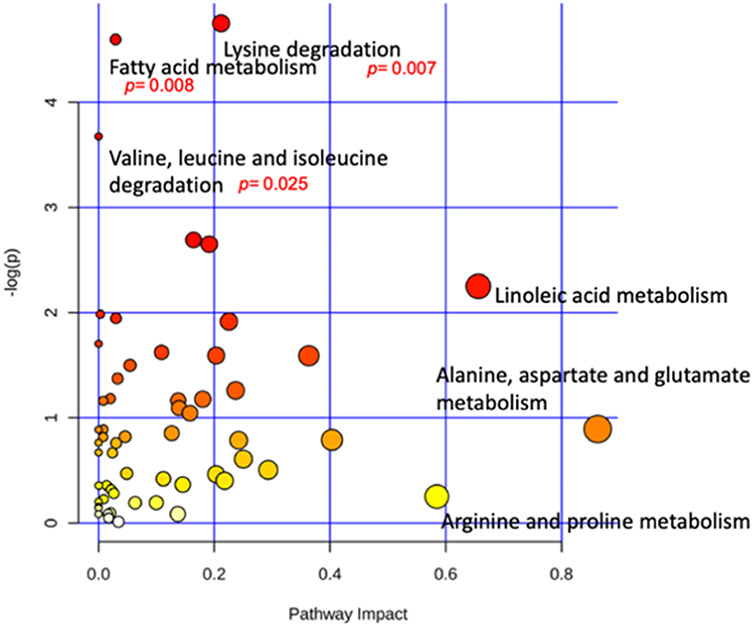
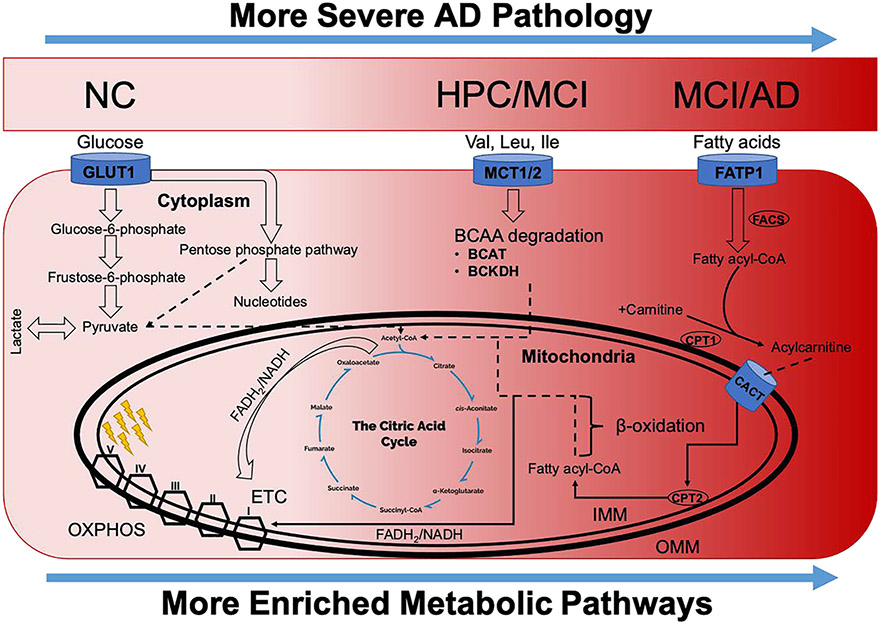
Alzheimer's disease (AD) is the most common cause of dementia, accounting for an estimated 60-80% of cases, and is the sixth-leading cause of death in the United States. While considerable advancements have been made in the clinical care of AD, it remains a complicated disorder that can be difficult to identify definitively in its earliest stages. Recently, mass spectrometry (MS)-based metabolomics has shown significant potential for elucidation of disease mechanisms and identification of therapeutic targets as well diagnostic and prognostic markers that may be useful in resolving some of the difficulties affecting clinical AD studies, such as effective stratification. In this study, complementary gas chromatography- and liquid chromatography-MS platforms were used to detect and monitor 2080 metabolites and features in 48 postmortem tissue samples harvested from the superior frontal gyrus of male and female subjects. Samples were taken from four groups: 12 normal control (NC) patients, 12 cognitively normal subjects characterized as high pathology controls (HPC), 12 subjects with nonspecific mild cognitive impairment (MCI), and 12 subjects with AD. Multivariate statistics informed the construction and cross-validation (p < 0.01) of partial least squares-discriminant analysis (PLS-DA) models defined by a nine-metabolite panel of disease markers (lauric acid, stearic acid, myristic acid, palmitic acid, palmitoleic acid, and four unidentified mass spectral features). Receiver operating characteristic analysis showed high predictive accuracy of the resulting PLS-DA models for discrimination of NC (97%), HPC (92%), MCI (∼96%), and AD (∼96%) groups. Pathway analysis revealed significant disturbances in lysine degradation, fatty acid metabolism, and the degradation of branched-chain amino acids. Network analysis showed significant enrichment of 11 enzymes, predominantly within the mitochondria. The results expand basic knowledge of the metabolome related to AD and reveal pathways that can be targeted therapeutically. This study also provides a promising basis for the development of larger multisite projects to validate these candidate markers in readily available biospecimens such as blood to enable the effective screening, rapid diagnosis, accurate surveillance, and therapeutic monitoring of AD. All raw mass spectrometry data have been deposited to MassIVE (data set identifier MSV000087165).
Keywords: Alzheimer’s disease; biomarkers; mass spectrometry; metabolomics; pathogenesis.
Figures
Similar articles
-
A Community-Based Study Identifying Metabolic Biomarkers of Mild Cognitive Impairment and Alzheimer's Disease Using Artificial Intelligence and Machine Learning.J Alzheimers Dis. 2020;78(4):1381-1392. doi: 10.3233/JAD-200305. J Alzheimers Dis. 2020. PMID: 33164929
-
Coccidioidomycosis Detection Using Targeted Plasma and Urine Metabolic Profiling.J Proteome Res. 2019 Jul 5;18(7):2791-2802. doi: 10.1021/acs.jproteome.9b00100. Epub 2019 Jun 17. J Proteome Res. 2019. PMID: 31244214
-
ApoE4 effects on automated diagnostic classifiers for mild cognitive impairment and Alzheimer's disease.Neuroimage Clin. 2014 Jan 4;4:461-72. doi: 10.1016/j.nicl.2013.12.012. eCollection 2014. Neuroimage Clin. 2014. PMID: 24634832 Free PMC article.
-
[The new 2011 recommendations of the National Institute on Aging and the Alzheimer's Association on diagnostic guidelines for Alzheimer's disease: Preclinal stages, mild cognitive impairment, and dementia].Rev Neurol (Paris). 2012 Jun;168(6-7):471-82. doi: 10.1016/j.neurol.2011.11.007. Epub 2012 May 12. Rev Neurol (Paris). 2012. PMID: 22579080 Review. French.
-
Alzheimer's disease.Subcell Biochem. 2012;65:329-52. doi: 10.1007/978-94-007-5416-4_14. Subcell Biochem. 2012. PMID: 23225010 Review.
Cited by
-
Central Nervous System Metabolism in Autism, Epilepsy and Developmental Delays: A Cerebrospinal Fluid Analysis.Metabolites. 2022 Apr 20;12(5):371. doi: 10.3390/metabo12050371. Metabolites. 2022. PMID: 35629876 Free PMC article.
-
Increased cardiac PFK-2 protects against high-fat diet-induced cardiomyopathy and mediates beneficial systemic metabolic effects.iScience. 2023 Jun 15;26(7):107131. doi: 10.1016/j.isci.2023.107131. eCollection 2023 Jul 21. iScience. 2023. PMID: 37534142 Free PMC article.
-
Maternal PBDE exposure disrupts gut microbiome and promotes hepatic proinflammatory signaling in humanized PXR-transgenic mouse offspring over time.Toxicol Sci. 2023 Jul 28;194(2):209-225. doi: 10.1093/toxsci/kfad056. Toxicol Sci. 2023. PMID: 37267213 Free PMC article.
-
Anti-Obesity and Metabolic Effects of Forskolin in Obese C57BL/6J Mice.Int J Mol Sci. 2025 Jul 10;26(14):6607. doi: 10.3390/ijms26146607. Int J Mol Sci. 2025. PMID: 40724856 Free PMC article.
-
Metabolic Regulations of Smilax china L. against β-Amyloid Toxicity in Caenorhabditis elegans.Metabolites. 2024 Jan 13;14(1):49. doi: 10.3390/metabo14010049. Metabolites. 2024. PMID: 38248852 Free PMC article.
References
-
- Qiu C; De Ronchi D; Fratiglioni L The Epidemiology of the Dementias: An Update. Curr. Opin. Psychiatry 2007, 20, 380–385. - PubMed
-
- Costa AC; Joaquim HPG; Forlenza OV; Gattaz WF; Talib LL Three Plasma Metabolites in Elderly Patients Differentiate Mild Cognitive Impairment and Alzheimer’s Disease: A Pilot Study. Eur. Arch. Psychiatry Clin. Neurosci 2020, 270, 483–488. - PubMed
-
- Hölscher C. Development of Beta-Amyloid-Induced Neurodegeneration in Alzheimer’s Disease and Novel Neuroprotective Strategies. Rev. Neurosci 2005, 16, 181–212. - PubMed
-
- Yi L; Liu W; Wang Z; Ren D; Peng W Characterizing Alzheimer’s Disease through Metabolomics and Investigating Anti-Alzheimer’s Disease Effects of Natural Products. Ann. N. Y. Acad. Sci 2017, 1398, 130–141. - PubMed
Publication types
MeSH terms
Substances
Grants and funding
LinkOut - more resources
Full Text Sources
Medical
