. 2021 Jul 14;10(7):665.
doi: 10.3390/biology10070665.

FLAME: A Web Tool for Functional and Literature Enrichment Analysis of Multiple Gene Lists

Affiliations

FLAME: A Web Tool for Functional and Literature Enrichment Analysis of Multiple Gene Lists

Foteini Thanati et al. Biology (Basel). .

Abstract

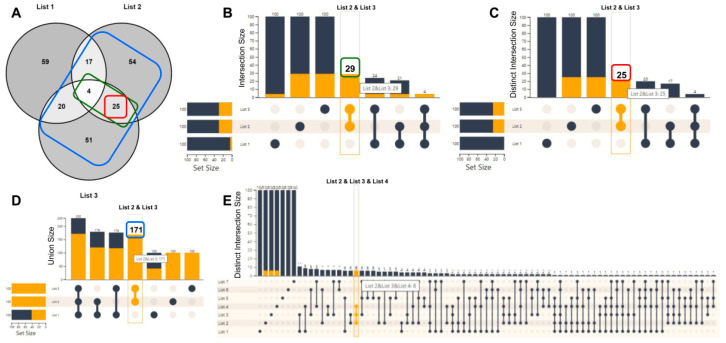
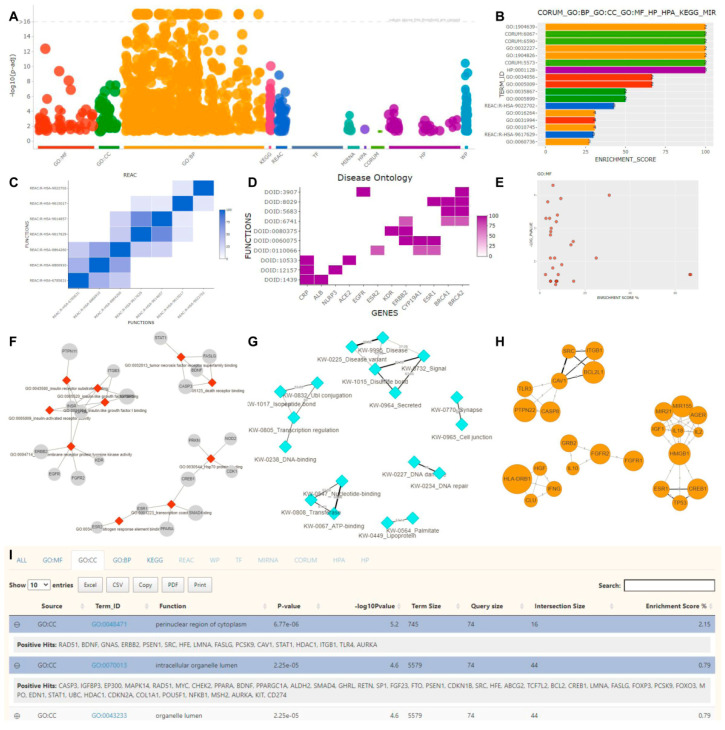
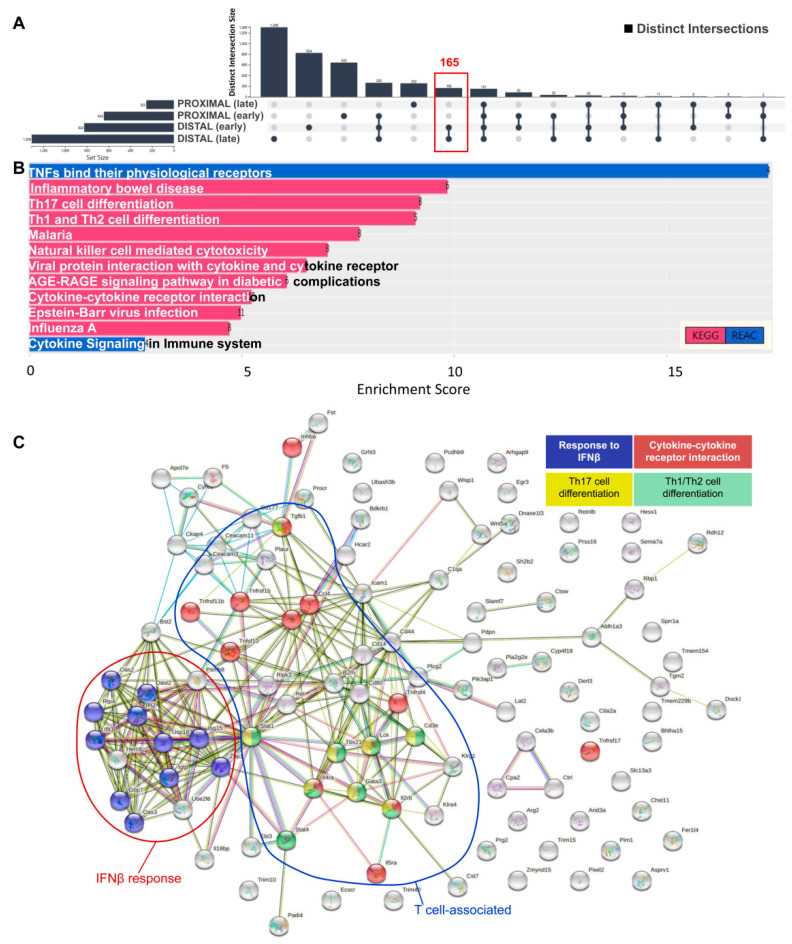
Functional enrichment is a widely used method for interpreting experimental results by identifying classes of proteins/genes associated with certain biological functions, pathways, diseases, or phenotypes. Despite the variety of existing tools, most of them can process a single list per time, thus making a more combinatorial analysis more complicated and prone to errors. In this article, we present FLAME, a web tool for combining multiple lists prior to enrichment analysis. Users can upload several lists and use interactive UpSet plots, as an alternative to Venn diagrams, to handle unions or intersections among the given input files. Functional and literature enrichment, along with gene conversions, are offered by g:Profiler and aGOtool applications for 197 organisms. FLAME can analyze genes/proteins for related articles, Gene Ontologies, pathways, annotations, regulatory motifs, domains, diseases, and phenotypes, and can also generate protein-protein interactions derived from STRING. We have validated FLAME by interrogating gene expression data associated with the sensitivity of the distal part of the large intestine to experimental colitis-propelled colon cancer. FLAME comes with an interactive user-friendly interface for easy list manipulation and exploration, while results can be visualized as interactive and parameterizable heatmaps, barcharts, Manhattan plots, networks, and tables.

Keywords: functional enrichment; multiple gene lists; network analysis.


Conflict of interest statement

The authors declare no conflict of interest.

Figures

Figure 1
Figure 1
UpSet plot vs. Venn diagrams. (A) Intersection of the three gene lists (100 genes each) shown in a Venn diagram. (B) The UpSet plot Intersection option visualizes the total number of common elements among the selected sets, even though they may also participate in other sets. For example, lists 2 and 3 contain 29 common genes (green rectangle), with 25 being shared only between them, and 4 also shared with List 1, as it can be seen in (A). (C) The distinct intersections option visualizes the common number of genes, among the chosen sets, which do not exist in any other set. This option is the closest to a Venn diagram. For example, lists 2 and 3 share 25 distinct genes (red rectangle). (D) The union option appends the unique elements among the chosen sets and creates all possible combinations. For example, the combination of lists 2 and 3 results in 171 total unique genes (blue rectangle). (E) A ‘distinct intersections’ UpSet plot example with 7 lists, which cannot be visualized as a Venn diagram.
Figure 2
Figure 2
FLAME’s interactive visualization options. (A) g:Profiler’s result overview in a Manhattan plot. (B) A barchart, incorporating the top 17 results after combining different sources such as GO Biological Process, GO Cellular Component, GO Molecular Function, phenotypes, protein complexes, pathways, and miRNAs. (C) A hierarchically clustered heatmap with pairwise similarities between reactome terms. The color intensity reflects the common genes between each pair. (D) A heatmap showing genes (x-axis) associated with Disease Ontology terms (y-axis). (E) A scatter plot of enriched GO Molecular Function terms. The x-axis represents the enrichment score, while the y-axis the statistical significance. (F) An unweighted network consisting of GO Molecular Function functional terms and their related genes. (G) A weighted network of pairwise UniProt keywords returned by aGOtool. Edge weights are proportional to the number of common genes between each pair. (H) A gene–gene network based on common GOs, where an edge width is proportional to the number of common biological processes (BP) between two genes. (I) An interactive table with enrichment analysis results reported in different tabs (source of the active tab shown: Gene Ontology Cellular Component).
Figure 3
Figure 3
(A) UpSet plot of distinct intersections of transcripts up-regulated at the ‘early’ (i.e., 2 DSS cycles) and ‘late’ (i.e., 4 DSS cycles) stages of AOM/DSS-induced carcinogenesis in the disease-resistant proximal and disease-sensitive distal part of the colon. The ‘susceptibility-associated gene signature’ (SAS), comprising 165 transcripts, was used for gene ontology and pathway enrichment. (B) KEGG and Reactome pathway enrichment of SAS transcripts. (C) Analysis of putative protein–protein interactions through the STRING option of FLAME. A cluster of interacting components of interferon beta (IFNβ) response and of T cell-associated immunity, including Th1/Th2 differentiation, Th17 differentiation, and cytokine–cytokine receptor interaction, each represented by a different color, is shown.

References

    1. Maleki F., Ovens K., Hogan D.J., Kusalik A.J. Gene Set Analysis: Challenges, Opportunities, and Future Research. Front. Genet. 2020;11:654. doi: 10.3389/fgene.2020.00654. - DOI - PMC - PubMed
    1. Shi-Jing L., Fathiah-Muzaffar-Shah F., Saberi-Mohamad M., Moorthy K., Deris S., Zakaria Z., Napis S. A Review on Bioinformatics Enrichment Analysis Tools Towards Functional Analysis of High Throughput Gene Set Data. Curr. Proteom. 2015;12:14–27. doi: 10.2174/157016461201150506200927. - DOI
    1. Raudvere U., Kolberg L., Kuzmin I., Arak T., Adler P., Peterson H., Vilo J. G:Profiler: A Web Server for Functional Enrichment Analysis and Conversions of Gene Lists (2019 Update) Nucleic Acids Res. 2019;47:W191–W198. doi: 10.1093/nar/gkz369. - DOI - PMC - PubMed
    1. Mi H., Muruganujan A., Casagrande J.T., Thomas P.D. Large-Scale Gene Function Analysis with the PANTHER Classification System. Nat. Protoc. 2013;8:1551–1566. doi: 10.1038/nprot.2013.092. - DOI - PMC - PubMed
    1. Huang D.W., Sherman B.T., Lempicki R.A. Systematic and Integrative Analysis of Large Gene Lists Using DAVID Bioinformatics Resources. Nat. Protoc. 2009;4:44–57. doi: 10.1038/nprot.2008.211. - DOI - PubMed