Review
. 2021 Jul 10;11(7):1013.
doi: 10.3390/biom11071013.

Introduction to Single-Cell DNA Methylation Profiling Methods

Affiliations
Review

Introduction to Single-Cell DNA Methylation Profiling Methods

Jongseong Ahn et al. Biomolecules. .

Abstract

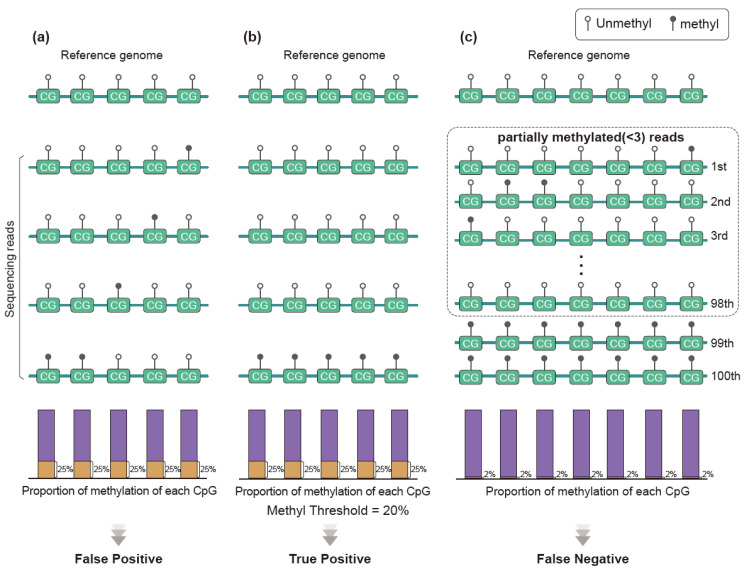
DNA methylation is an epigenetic mechanism that is related to mammalian cellular differentiation, gene expression regulation, and disease. In several studies, DNA methylation has been identified as an effective marker to identify differences between cells. In this review, we introduce single-cell DNA-methylation profiling methods, including experimental strategies and approaches to computational data analysis. Furthermore, the blind spots of the basic analysis and recent alternatives are briefly described. In addition, we introduce well-known applications and discuss future development.

Keywords: DNA methylation; bioinformatics; single cell.


Conflict of interest statement

The authors declare no conflict of interest.

Figures

Figure 1
Figure 1
Key strategies to minimize DNA loss in single-cell DNA methylation profiling methods. Because a single cell contains a small amount of DNA, several methods are used to minimize loss. (a) Overview of the post-bisulfite adaptor tagging (PBAT) method to prevent loss due to degradation during the bisulfite conversion process. Unlike the conventional method (left panel), loss of shortened DNA fragments is prevented in PBAT (right panel). Each single-cell methylation profiling method using the PBAT strategy differs in the number of amplifications of the bisulfite conversion product (α) and the number of random sequences in the primer (β). (b) Overview of single-tube reaction. Common to several methods, reagents are continuously added, without purification, to the tube or well containing cell lysate or nuclei. In this way, DNA loss during the purification process can be prevented. (c) Use of microfluidics demonstrated in the microfluidic diffusion (MID)-based reduced representation bisulfite sequencing (RRBS) process. DNA loss can be minimized during purification using microfluidics. This figure is based on the figure of a previous article (Ma, S., de la Fuente Revenga, M., Sun, Z. et al. 2018) [41] and adapted with permission from 2018 Springer Nature.
Figure 2
Figure 2
The pattern of the resulting data that can be obtained for each basic method. The resulting pattern of each single-cell profiling method reflects the pattern of the basic method associated with it. The figure format was based on the figure in the paper (Ja-Rang Lee, et al. 2018) [45]. (a) An example of the final data pattern represented by the single-cell method based on RRBS. According to the basic principle of RRBS, reads are observed mainly at high-CG positions. (b) An example of the final data pattern represented by the single-cell method based on WGBS. According to the basic principle of WGBS, a relatively even distribution of reads is observed. (c) Example of the pattern of results in single-cell (sc)CGI-seq where methylation-sensitive restriction enzymes (MSREs) are used. Similar to RRBS, the read is observed at the high-CG position in the genome, but the methylated site can be observed based on the difference between the control and the sample.
Figure 3
Figure 3
The bisulfite treatment-based sequencing data analysis should take into consideration the converted normal cytosine. (a) With the exception of the CpG loci (red), all cytosine residues of produced sequence reads are converted to thymine after PCR (left panel). These sequence reads are aligned on the reference genome using the wild-card method (upper right panel) or three-letter method (lower right panel). Although the wild-card alignment aligned more reads and coverage is increased, the methylation level is biased. In the three-letter system, some reads failed to align but the calculated methylation level is unbiased compared to the wild-card method when there is alignment (transparent reads are an alignment failure) (adapted with permission from [82], 2012 Springer Nature). (b) Sequence reads after bisulfite treatment. Due to the PCR step, four types of sequence reads are produced. Two are from the original target molecule (OT, OB), and the other two are from the complementary strand generated by PCR (CTOT, CTOB). OT: original top, OB: original bottom, CTOT: complementary to original top, CTOB: complementary to original bottom (adapted with permission from [83], 2012 Springer Nature).
Figure 4
Figure 4
Analysis methods of DNA methylation. (a) Overview of methylation analysis pipeline. The analysis starts with the quality check of raw sequence reads followed by adaptor trimming and alignment. After alignment, two tracks of analysis are performed. The first is assessment of the experimental quality, such as bisulfite conversion rate, M-bias plot, and removal of known single-nucleotide polymorphisms (SNPs). The second is removal of duplication followed by methylation calling. After methylation calling, several steps, such as visualization (b), cluster analysis (c), and identification of differentially methylated sites or genes between bulk or single-cell groups (d) or regions (e), are carried out. Each analysis method is used on both the bulk scale and single-cell scale, and individual single cells are treated similarly to individual samples in bulk. The image in (b) was adapted from the t-SNE figure of the open access iscCOOL-seq paper (Gu, C., Liu, S., Wu, Q. et al. 2019) [58]. t-SNE: t-stochastic neighbor embedding.
Figure 5
Figure 5
Benefits of read-pattern analysis. Single CpG loci values can confound the methylation call. Consider a scenario of detection of cancer using methylation. (a) Sequence reads in a given region are nearly identical to the reference pattern but are dissimilar due to an error of the methyltransferase. The overall methylation percentage is calculated as 25%. The methylation level of this region is different from that of the reference and, hence, a false positive methylation call can occur. (b) Although the CpG methylation level is the same in the former scenario, there is a molecule that is perfectly methylated. In this case, we consider that this region has a methylated molecule because the multiple CpG site error of methyltransferase in a single DNA molecule occurs with very low probability. Therefore, we call this true positive methylation. (c) In early cancer, there is a small cancer DNA burden in the blood that is nearly undetectable using single CpG methylation (here 2% of methylation). Unless utilizing the methylation pattern of molecules, a false negative result occurs.
Figure 6
Figure 6
Applications of methylation pattern analysis in cancer clinical settings. Each DNA methylation pattern in a single sequence read is evaluated using a trained machine learning classifier. The classifier considers the methylation pattern as a mixture of a healthy (normal) methylation pattern and tumor methylation pattern. In the training step, both the normal methylation pattern and the methylation pattern information data for each cancer type are fed into the classifier. According to trained hyperparameters, the classifier scores each read and classifies whether the read (i.e., DNA molecule) originates from tumor or normal DNA. The model collects information for each read in an ensemble manner for each genomic region of interest. The collected signal is utilized to (1) decide whether the sample is cancerous and (2) deconvolute the tumor of origin. (TOO: tumor of origin, f: fraction of tumor).
Figure 7
Figure 7
Application of single-cell methylation sequencing (sc-methyl-seq). Sc-methyl-seq can be applied to cell differentiation analysis (left panel) and rare-cell population analysis, such as a resistance clone in cancer (right panel).

References

    1. Suzuki M.M., Bird A. DNA Methylation Landscapes: Provocative Insights from Epigenomics. Nat. Rev. Genet. 2008;9:465–476. doi: 10.1038/nrg2341. - DOI - PubMed
    1. Moore L.D., Le T., Fan G. DNA Methylation and Its Basic Function. Neuropsychopharmacology. 2013;38:23–38. doi: 10.1038/npp.2012.112. - DOI - PMC - PubMed
    1. Lister R., Pelizzola M., Dowen R.H., Hawkins R.D., Hon G., Tonti-Filippini J., Nery J.R., Lee L., Ye Z., Ngo Q.-M., et al. Human DNA Methylomes at Base Resolution Show Widespread Epigenomic Differences. Nature. 2009;462:315–322. doi: 10.1038/nature08514. - DOI - PMC - PubMed
    1. Lister R., Mukamel E.A., Nery J.R., Urich M., Puddifoot C.A., Johnson N.D., Lucero J., Huang Y., Dwork A.J., Schultz M.D., et al. Global Epigenomic Reconfiguration During Mammalian Brain Development. Science. 2013;341 doi: 10.1126/science.1237905. - DOI - PMC - PubMed
    1. Hernando-Herraez I., Garcia-Perez R., Sharp A.J., Marques-Bonet T. DNA Methylation: Insights into Human Evolution. PLoS Genet. 2015;11:e1005661. doi: 10.1371/journal.pgen.1005661. - DOI - PMC - PubMed

Publication types

LinkOut - more resources