. 2021 Jul 1;11(7):217.
doi: 10.3390/bios11070217.

Plasmonic Interferometers as TREM2 Sensors for Alzheimer's Disease

Affiliations

Plasmonic Interferometers as TREM2 Sensors for Alzheimer's Disease

Dingdong Li et al. Biosensors (Basel). .

Abstract

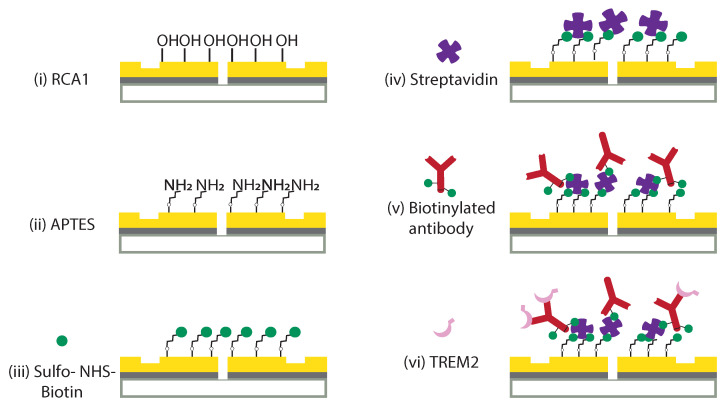
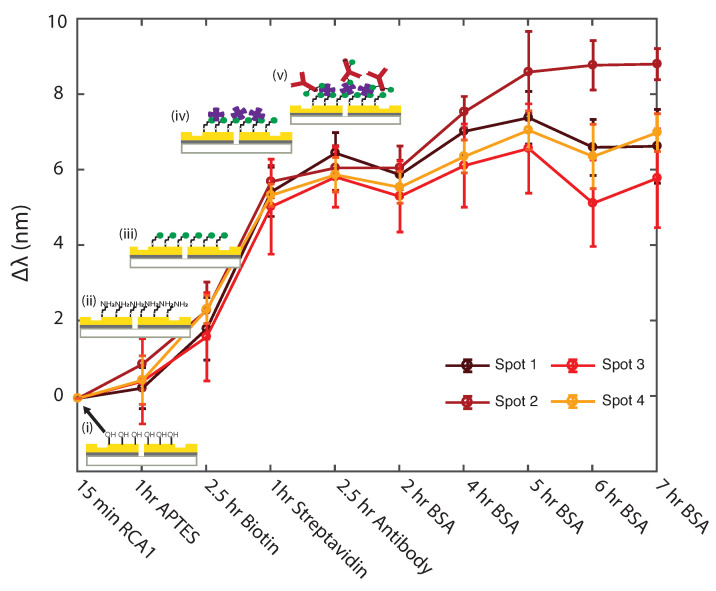
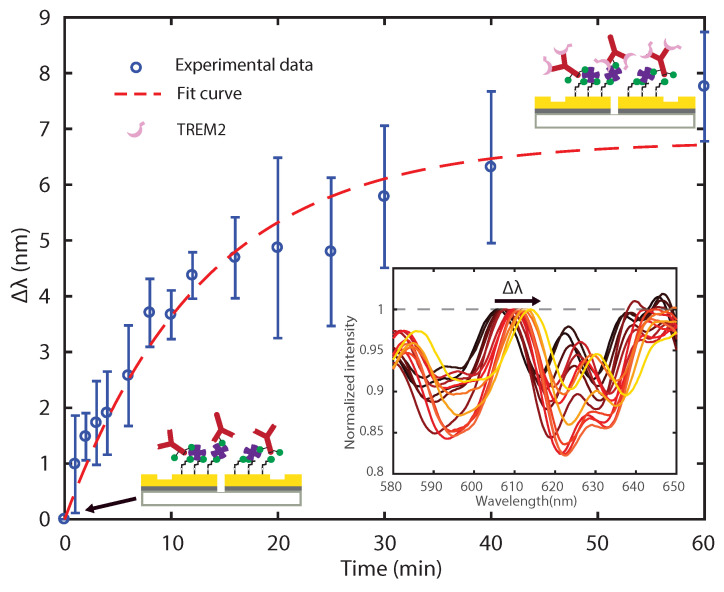
We report an effective surface immobilization protocol for capture of Triggering Receptor Expressed on Myeloid Cells 2 (TREM2), a receptor whose elevated concentration in cerebrospinal fluid has recently been associated with Alzheimer's disease (AD). We employ the proposed surface functionalization scheme to design, fabricate, and assess a biochemical sensing platform based on plasmonic interferometry that is able to detect physiological concentrations of TREM2 in solution. These findings open up opportunities for label-free biosensing of TREM2 in its soluble form in various bodily fluids as an early indicator of the onset of clinical dementia in AD. We also show that plasmonic interferometry can be a powerful tool to monitor and optimize surface immobilization schemes, which could be applied to develop other relevant antibody tests.

Keywords: Alzheimer’s disease; TREM2 sensors; optical biosensor; plasmonic interferometry; surface functionalization.


Conflict of interest statement

The authors declare that there are no conflicts of interest related to this article.

Figures

Figure 1
Figure 1
Design for TREM2 sensor chip based on plasmonic interferometry. (a) Cross-section schematic of the groove-slit-groove (GSG) architecture, which shows a slit flanked by two grooves, from which SPPs are excited by light diffraction and propagate towards the slit aperture, where they interfere and are then transmitted back into free space for far-field detection; diagram includes an example of an antigen complex, further described in Figure 2. The bottom slab represents quartz, the middle titanium, and the top layer gold. (b) Scanning electron micrograph (SEM) of a GSG interferometer with p1=7.65μm, p2=8.15μm. (c) Schematic of plasmonic interferometer sensor chip layout. The chip contains four nominally identical sensing spots enabling multiplex sensing applications. The yellow area indicates quartz covered by gold and the blank area is an uncoated quartz window used for optical alignment. (d) Schematic of a representative active sensing area. Each sensing area contains two columns of single slits and two columns of nominally identical asymmetric GSG interferometers with separation distance of 300 μm. The slit/grooves in each interferometer are ∼20 μm long and, within each column, the distance between two adjacent interferometers is ∼40 μm.
Figure 2
Figure 2
Surface immobilization protocol for capture of TREM2 in solution. Chip surface was treated with (i) an RCA1 cleaning procedure followed by (ii) (3-Aminopropyl)triethoxysilane (APTES) to form an amino-terminated surface. Sulfo-NHS-biotin (sulfo-N-Hydroxysulfosuccinimide biotin) covalently attaches to the amino groups of the surface (iii) and subsequently captures streptavidins (iv). Finally, the streptavidin functionalized chip is bound by the biotinylated TREM2 antibody (v) for sensing of the TREM2 molecule (vi). The green dot in (v) represents the sulfo-NHS ester of biotin that acts as the biotinylation reagent and allows to form a stable bond between the antibody and the streptavidin already bound to the sensor surface, as reported in (iv).
Figure 3
Figure 3
Tracking functionalization steps through plasmonic interference spectra. Measured results of transmitted intensity spectra after (i) RCA1, (ii) APTES, (iii) sulfo-NHS-biotin, (iv) streptavidin, and (v) biotinylated TREM2 antibody treatment. Solid lines represent the mean value of normalized intensity spectra averaged over seven nominally identical GSG interferometers after each functionalization step, as illustrated by the lower left insets. Light gray areas represent standard deviation. The vertical dashed line indicates the position of a representative transmission peak (588.1 nm) that results from constructive SPP interference after RCA1 cleaning. The black arrows mark the wavelength shift (Δλ) in this reference peak as the result of new constructive interference conditions after each functionalization step.
Figure 4
Figure 4
Uniformity study of surface functionalization steps across four sensing spots. Circles represent the mean value of wavelength shift (Δλ) measured from 7 GSG plasmonic interferometers after each functionalization step, labelled in the horizontal axis. Error bars represent the standard deviation. Lines and symbols with different colors indicate data measured from different sensing spots.
Figure 5
Figure 5
Sensing temporal evolution of TREM2 surface binding kinetics with plasmonic interferometry. Blue circles represent the mean peak shift (Δλ) averaged over seven nominally identical GSG plasmonic interferometers as the result of temporal evolution of antigen-antibody binding reaction for a 2.7 ng/ml TREM2 0.5% BSA PBS. Error bars represent the standard deviation. Bottom right inset illustrates the normalized transmitted spectra (averaged over seven identical GSG interferometers) measured at each time step. Color changing from dark red to yellow represents increasing reaction time from 0 to 60 min.
Figure 6
Figure 6
Binding times for different TREM2 concentrations. Temporal evolution of peak wavelength shifts measured from normalized transmission spectra for different TREM2 concentrations. Error bars represent standard deviation from 7 GSG interferometers. Dashed lines represent exponential fit using the kinetic model provided in the text.

Similar articles

Cited by

References

    1. Vos T., Allen C., Arora M., Barber R.M., Bhutta Z.A., Brown A., Carter A., Casey D.C., Charlson F.J., Chen A.Z., et al. Global, regional, and national incidence, prevalence, and years lived with disability for 310 diseases and injuries, 1990–2015: A systematic analysis for the Global Burden of Disease Study 2015. Lancet. 2016;388:1545–1602. doi: 10.1016/S0140-6736(16)31678-6. - DOI - PMC - PubMed
    1. World Health Organization . Towards a Dementia Plan: A WHO Guide. World Health Organization; Geneva, Switzerland: 2018.
    1. Alzheimer’s Association 2017 Alzheimer’s disease facts and figures. Alzheimer’s Dement. 2017;13:325–373. doi: 10.1016/j.jalz.2017.02.001. - DOI - PubMed
    1. Calcoen D., Elias L., Yu X. What does it take to produce a breakthrough drug? Nat. Rev. Drug Discov. 2015;14:161–162. doi: 10.1038/nrd4570. - DOI - PubMed
    1. Morris J.C., McKeel D.W., Jr., Fulling K., Torack R.M., Berg L. Validation of clinical diagnostic criteria for Alzheimer’s disease. Ann. Neurol. Off. J. Am. Neurol. Assoc. Child Neurol. Soc. 1988;24:17–22. doi: 10.1002/ana.410240105. - DOI - PubMed

LinkOut - more resources