. 2021 Jul 13;9(7):813.
doi: 10.3390/biomedicines9070813.

Longitudinal Circulating Levels of miR-23b-3p, miR-126-3p and lncRNA GAS5 in HCC Patients Treated with Sorafenib

Affiliations

Longitudinal Circulating Levels of miR-23b-3p, miR-126-3p and lncRNA GAS5 in HCC Patients Treated with Sorafenib

Michele Manganelli et al. Biomedicines. .

Abstract

Human hepatocellular carcinoma (HCC) is the most frequent primary tumor of the liver and the third cause of cancer-related deaths. The multikinase inhibitor sorafenib is a systemic drug for unresectable HCC. The identification of molecular biomarkers for the early diagnosis of HCC and responsiveness to treatment are needed. In this work, we performed an exploratory study to investigate the longitudinal levels of cell-free long ncRNA GAS5 and microRNAs miR-126-3p and -23b-3p in a cohort of 7 patients during the period of treatment with sorafenib. We used qPCR to measure the amounts of GAS5 and miR-126-3p and droplet digital PCR (ddPCR) to measure the levels of miR-23b-3p. Patients treated with sorafenib displayed variable levels of GAS5, miR-126-3p and miR-23b-3p at different time-points of follow-up. miR-23b-3p was further measured by ddPCR in 37 healthy individuals and 25 untreated HCC patients. The amount of miR-23b-3p in the plasma of untreated HCC patients was significantly downregulated if compared to healthy individuals. The ROC curve analysis underlined its diagnostic relevance. In conclusion, our results highlight a potential clinical significance of circulating miR-23b-3p and an exploratory observation on the longitudinal plasmatic levels of GAS5, miR-126-3p and miR-23b-3p during sorafenib treatment.

Keywords: GAS5; HCC; ddPCR; miR-126-3p; miR-23b-3p; sorafenib.


Conflict of interest statement

The authors declare no conflict of interest.

Figures

Figure 1
Figure 1
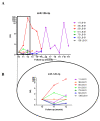
GAS5 levels in the plasma of HCC patients treated with sorafenib. (A) The graph shows the amount of GAS5 detected in the plasma of each HCC patient during sorafenib treatment. Each line represents one patient, and the dots indicate the levels of GAS5 at each blood withdrawal time point (one per month, Tn) normalized on the GAS5 level before the start of treatment (T0). (B) Focus on GAS5 early levels after sorafenib administration. Tn indicates the sequential blood withdrawal time point carried out once per month. One-way ANOVA, followed by Tukey’s test, was used to compare GAS5 levels among three time points (T0, T1 and T2).
Figure 2
Figure 2
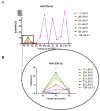
miR-126-3p levels in the plasma of HCC patients treated with sorafenib. (A) The graph shows the amount of miR-126-3p detected in the plasma of each HCC patient during sorafenib treatment. Each line represents one patient, and the dots indicate the levels of miR-126-3p at each blood withdrawal time point (one per month, Tn) normalized on the miR-126-3p level before the start of treatment (T0). (B) Focus on miR-126-3p early levels after sorafenib administration. Tn indicates the sequential blood withdrawal time point carried out once per month. One-way ANOVA, followed by Tukey’s test, was used to compare miR-126-3p levels among three time points (T0, T1 and T2).
Figure 3
Figure 3
ddPCR determination of plasma levels of miR-23b-3p in HCC patients. (A) The graph shows the amount of miR-23b-3p detected in the plasma of healthy individuals (C) and HCC patients. The Mann–Whitney U-test was used to compare the two groups; * indicates a p-value < 0.05. (B) ROC curve analysis of miR-23b-3p in HCC patients and healthy individuals. AUC = Area Under the Curve; CI = Confidence Interval.
Figure 4
Figure 4
miR-23b-3p levels in the plasma of HCC patients treated with sorafenib. (A) The graph shows the amount of miR-23b-3p detected in the plasma of each HCC patient during sorafenib treatment. Each line represents one patient, and the dots indicate the levels of miR-23b-3p at each blood withdrawal time point (one per month, Tn) normalized on the miR-23b-3p level before the start of treatment (T0). (B) Focus on miR-23b-3p early levels after sorafenib administration. Tn indicates the sequential blood withdrawal point carried out once per month. One-way ANOVA, followed by Tukey’s test, was used to compare miR-23b-3p levels among three time points (T0, T1, and T2), * indicates a p-value < 0.05 versus T0.

References

    1. Hombach S., Kretz M. Non-coding RNAs: Classification, biology and functioning. Adv. Exp. Med. Biol. 2016;937:3–17. doi: 10.1007/978-3-319-42059-2_1. - DOI - PubMed
    1. Tordonato C., Di Fiore P.P., Nicassio F. The role of non-coding RNAs in the regulation of stem cells and progenitors in the normal mammary gland and in breast tumors. Front. Genet. 2015;5 doi: 10.3389/fgene.2015.00072. - DOI - PMC - PubMed
    1. Grossi I., Radeghieri A., PaoliniDI L., Porrini V., Pilotto A., Padovani A., Marengoni A., Barbon A., Bellucci A., Pizzi M., et al. MicroRNA-34a-5p expression in the plasma and in its extracellular vesicle fractions in subjects with Parkinson’s disease: An exploratory study. Int. J. Mol. Med. 2021;47:533–546. doi: 10.3892/ijmm.2020.4806. - DOI - PMC - PubMed
    1. Salvi A., Vezzoli M., Busatto S., Paolini L., Faranda T., Abeni E., Caracausi M., Antonaros F., Piovesan A., Locatelli C., et al. Analysis of a nanoparticle-enriched fraction of plasma reveals miRNA candidates for Down syndrome pathogenesis. Int. J. Mol. Med. 2019;43:2303–2318. doi: 10.3892/ijmm.2019.4158. - DOI - PMC - PubMed
    1. Moshiri F., Salvi A., Gramantieri L., Sangiovanni A., Guerriero P., De Petro G., Bassi C., Lupini L., Sattari A., Cheung D., et al. Circulating miR-106b-3p, miR-101-3p and miR-1246 as diagnostic biomarkers of hepatocellular carcinoma. Oncotarget. 2018;9:15350–15364. doi: 10.18632/oncotarget.24601. - DOI - PMC - PubMed

LinkOut - more resources