. 2021 Oct 4;218(10):e20211211.
doi: 10.1084/jem.20211211. Epub 2021 Aug 6.

Early nasal type I IFN immunity against SARS-CoV-2 is compromised in patients with autoantibodies against type I IFNs

Affiliations

Early nasal type I IFN immunity against SARS-CoV-2 is compromised in patients with autoantibodies against type I IFNs

Jonathan Lopez et al. J Exp Med. .

Erratum in

Abstract

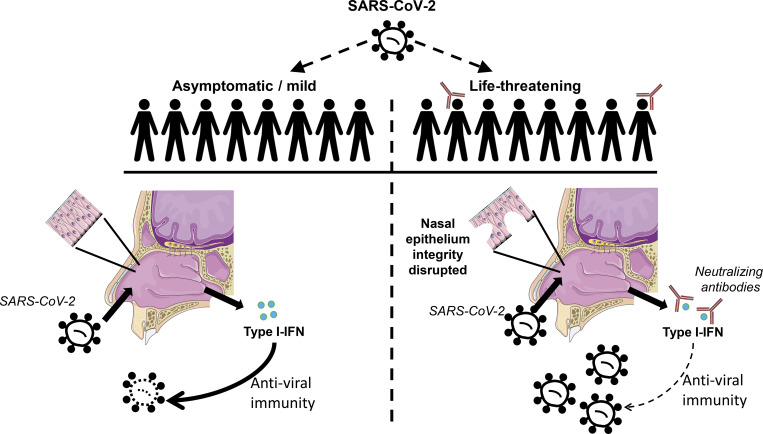
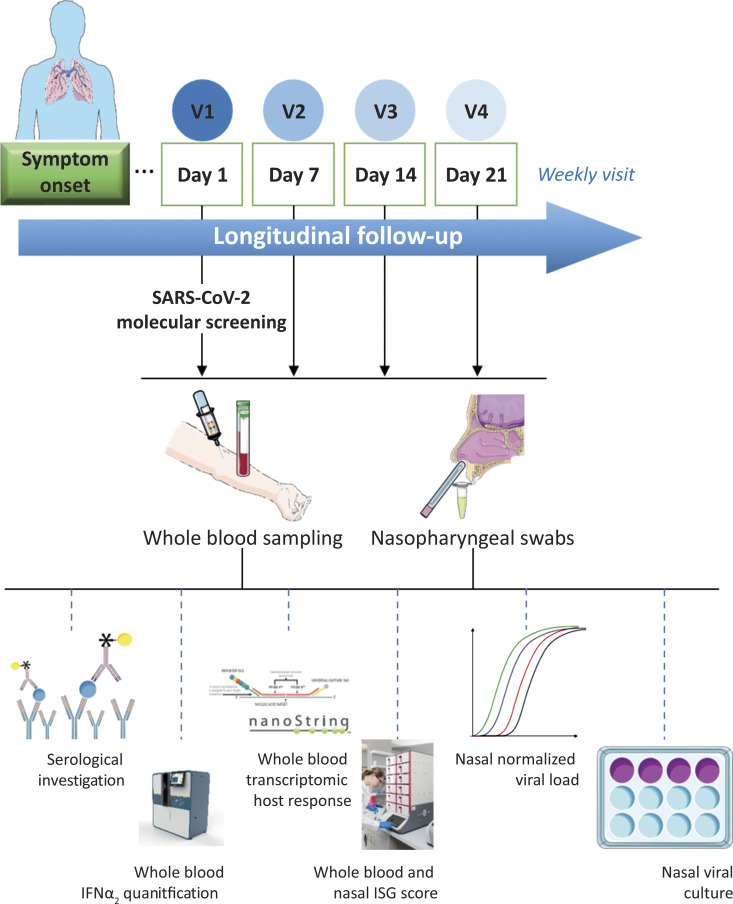
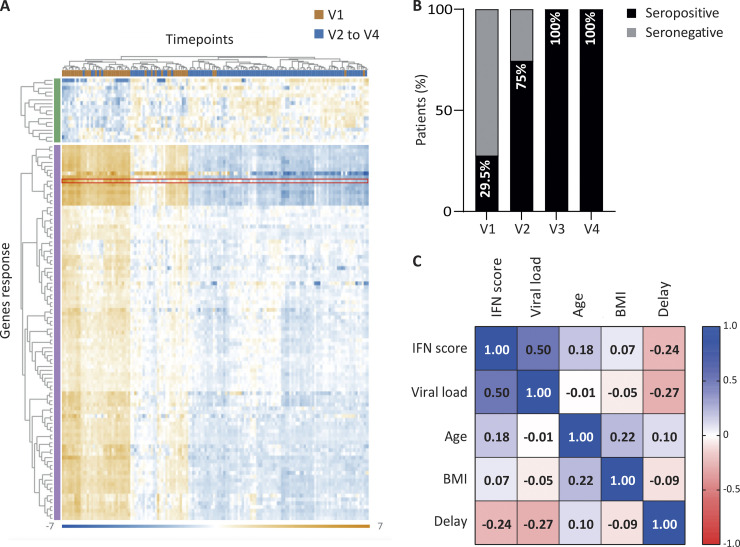
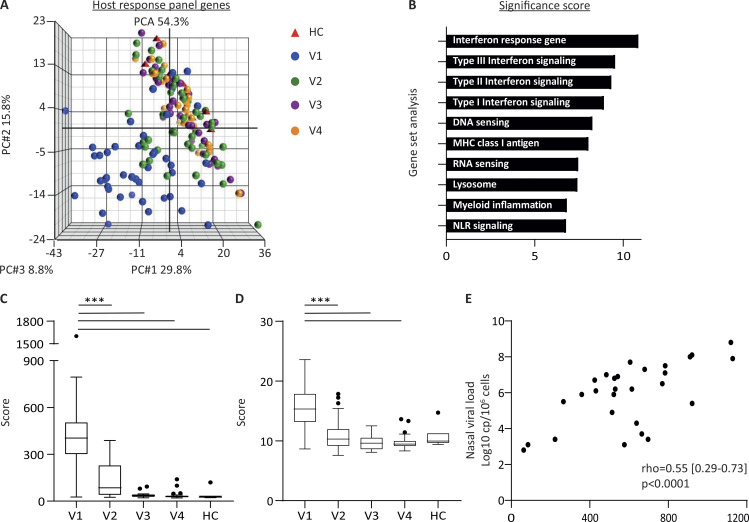
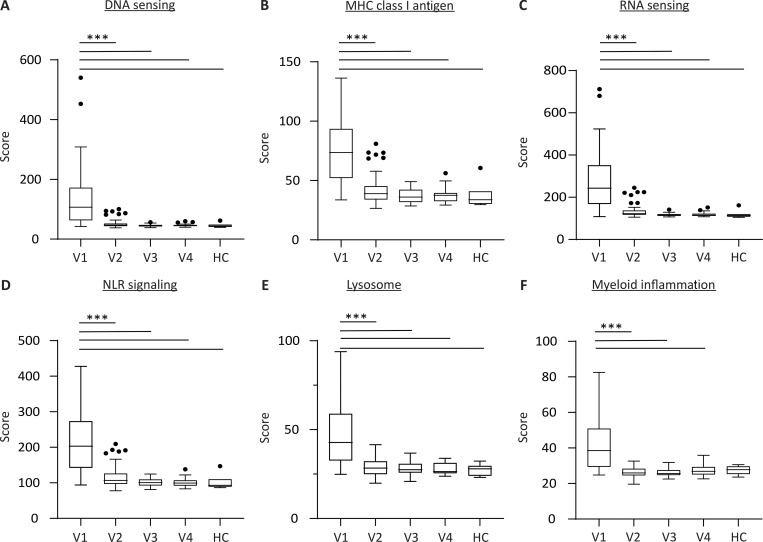
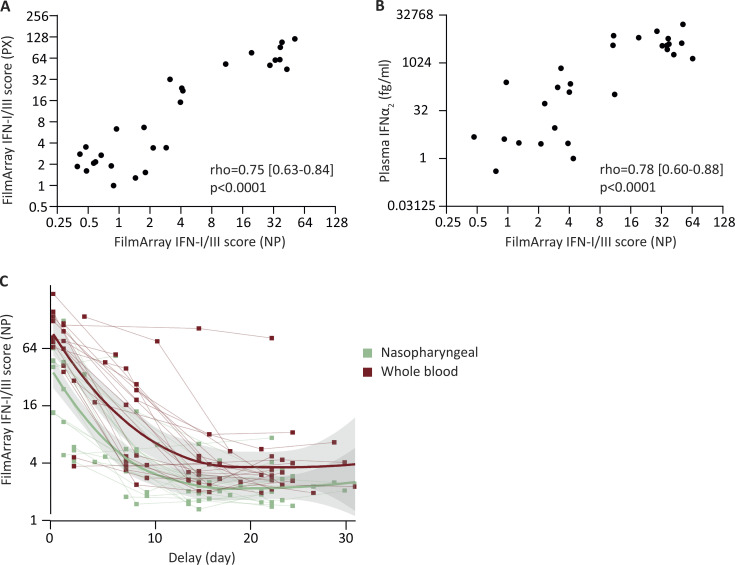
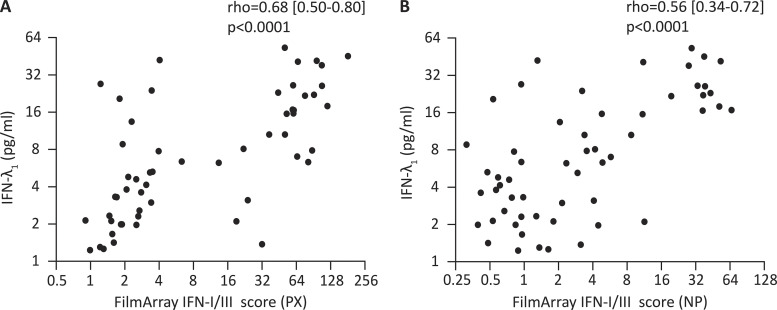
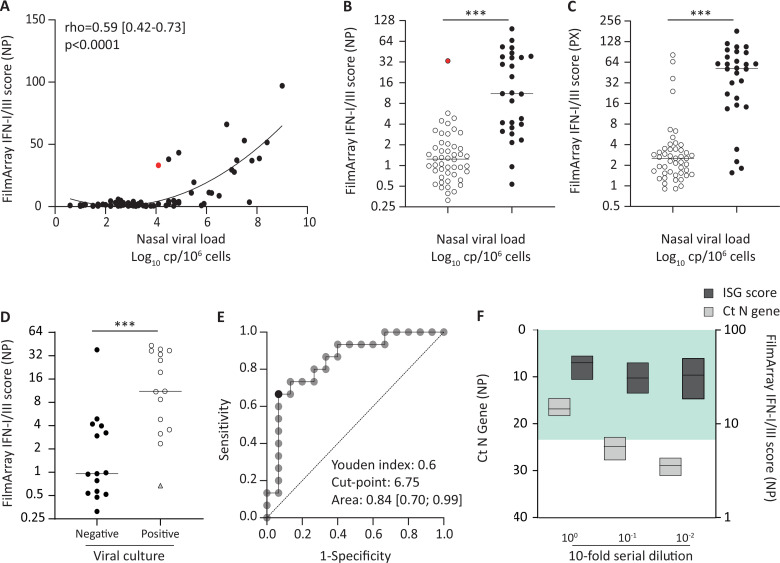
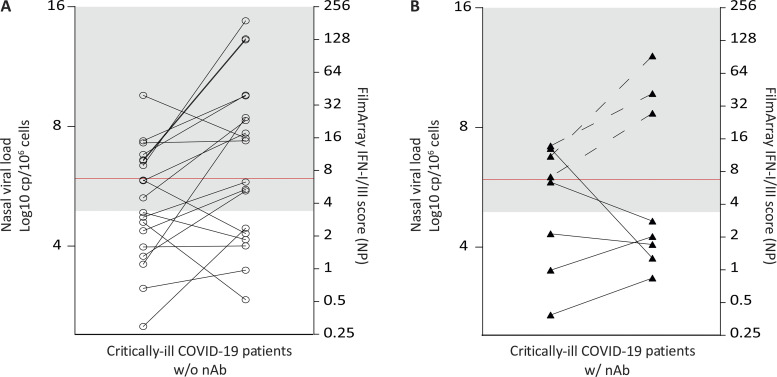
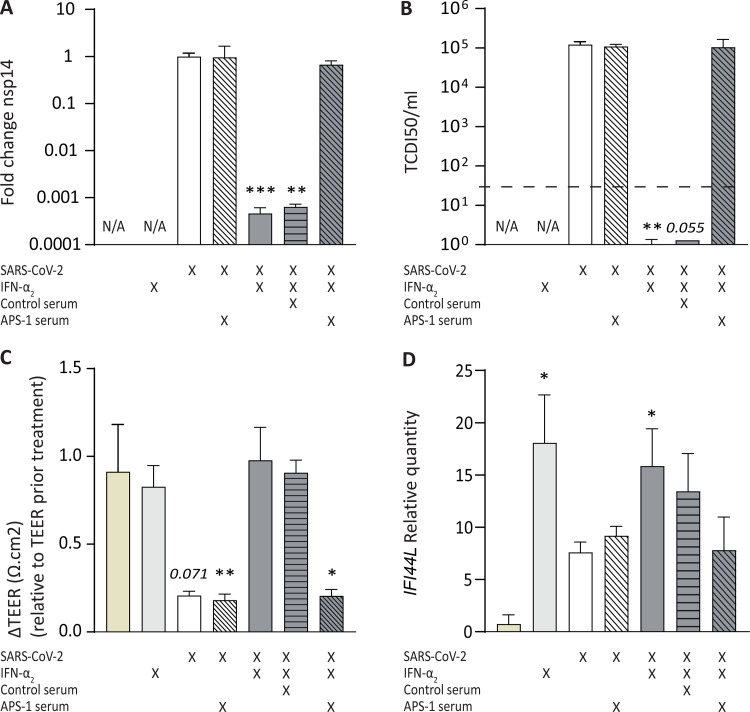
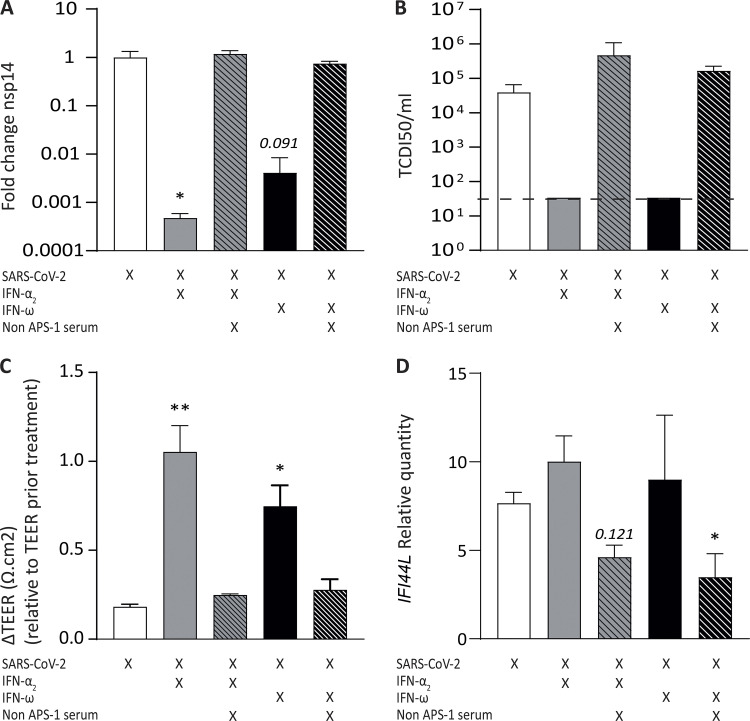
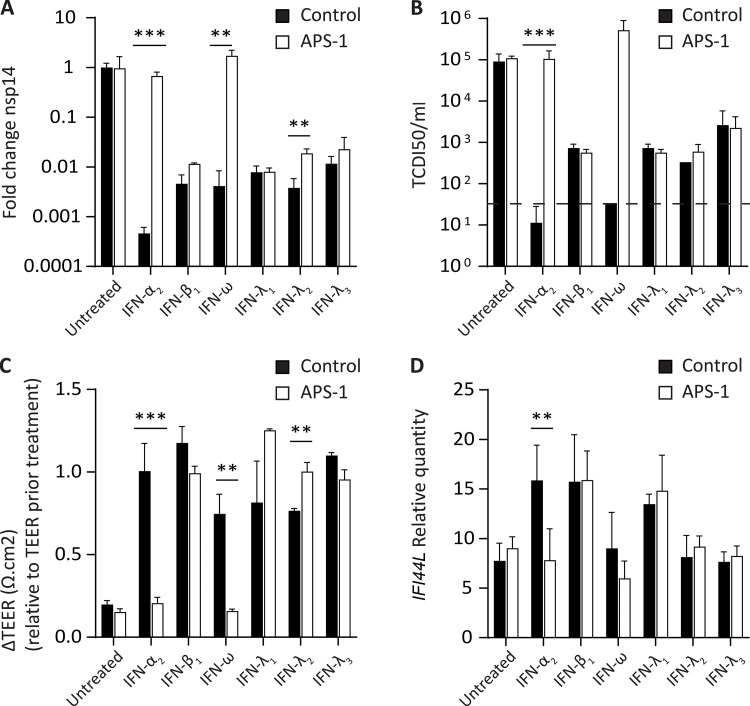
IFN-I and IFN-III immunity in the nasal mucosa is poorly characterized during SARS-CoV-2 infection. We analyze the nasal IFN-I/III signature, namely the expression of ISGF-3-dependent IFN-stimulated genes, in mildly symptomatic COVID-19 patients and show its correlation with serum IFN-α2 levels, which peak at symptom onset and return to baseline from day 10 onward. Moreover, the nasal IFN-I/III signature correlates with the nasopharyngeal viral load and is associated with the presence of infectious viruses. By contrast, we observe low nasal IFN-I/III scores despite high nasal viral loads in a subset of critically ill COVID-19 patients, which correlates with the presence of autoantibodies (auto-Abs) against IFN-I in both blood and nasopharyngeal mucosa. In addition, functional assays in a reconstituted human airway epithelium model of SARS-CoV-2 infection confirm the role of such auto-Abs in abrogating the antiviral effects of IFN-I, but not those of IFN-III. Thus, IFN-I auto-Abs may compromise not only systemic but also local antiviral IFN-I immunity at the early stages of SARS-CoV-2 infection.


Conflict of interest statement

Disclosures: M. Mommert, W. Mouton, K. Brengel-Pesce, A. Bal, and V. Cheynet reported personal fees from bioMérieux during the conduct of the study and personal fees from bioMérieux outside the submitted work. M. Mommert, K. Brengel-Pesce, and S. Trouillet-Assant have a patent to FR2107421 pending. A. Pizzorno, B. Padey, and M. Rosa-Calatrava reported a patent to FR 20/02351 (Therapeutic treatments against SARS-CoV-2) pending. S. Trouillet-Assant and J.-B. Fassier reported non-financial support from bioMérieux during the conduct of the study and non-financial support from bioMérieux outside the submitted work. No other disclosures were reported.

Figures

None
Graphical abstract
Figure S1.
Figure S1.
Graphical outline of the study. Parts of the figure were drawn by using pictures from Servier Medical Art (http://smart.servier.com/), licensed under a Creative Commons Attribution 3.0 Unported License (https://creativecommons.org/licenses/by/3.0/). Simoa HD-1 illustration used with permission from Quanterix and Nanostring.
Figure S2.
Figure S2.
Whole-blood transcriptomic analysis at different time points post-diagnosis. (A) Unsupervised clustering of V1 (orange columns) and V2–V4 samples (blue columns) and DEGs, measured using the NanoString host response panel. The green vertical bar highlights the 17 genes down-regulated at V1 compared with V2/V3/V4, and the purple bar highlights the 106 genes up-regulated at V1 compared with V2/V3/V4. (B) Histogram bars showing the percentage of seroconverted (Wantai total SARS-CoV-2 Ig) patients within the cohort of mildly symptomatic COVID-19 health care workers at the different time points of the longitudinal follow-up. (C) Pearson correlation table between NanoString IFN score, nasal viral load, age, body mass index (BMI), and delay after symptoms.
Figure 1.
Figure 1.
SARS-CoV-2 infection leads to a transient and acute type I/III IFN signature in the blood. (A) Principal-component analysis (PCA) of NanoString host response gene expression data from blood of 5 HC (red triangles) and 44 COVID-19 patients (spheres) followed longitudinally from diagnosis (V1, blue) for 4 wk (V2, green; V3, purple; and V4, orange). The percentage of variance captured by each principal-component (PC) axis is indicated, as well as the total variance. The vector position for each sample was plotted and the visualization was performed using Genomics Suite 7 (Partek). (B) Pathway analysis for the 123 DEGs between V1 and V2/V3/V4 determined using nSolver NanoString analysis software. The significance scores for the top 10 pathways are indicated. NLR, nucleotide oligomerization domain–like receptor. (C and D) Box and whisker plots (using the Tukey method) showing the expression score of the indicated pathways from V1 to V4 for patients and for HCs. A Kruskal–Wallis with uncorrected Dunn’s test was used for statistical analysis of data presented in this figure (multiple comparisons; ***, P < 0.001). (E) Correlation between the nasal SARS-CoV-2 normalized viral load and the NanoString IFN score (49 genes differentially expressed between V1 and V2/V3/V4). The Spearman's correlation coefficient is shown.
Figure S3.
Figure S3.
Dynamics of induction in the blood of different immune pathways during SARS-CoV-2 infection. (A–F) Boxplots showing the blood expression score for different pathways significantly modulated from V1 to V4. A Kruskal–Wallis with uncorrected Dunn’s test was used for statistical analysis of data presented in this figure (multiple comparisons; ***, P < 0.001).
Figure 2.
Figure 2.
Nasal and blood IFN-I/III scores are correlated during SARS-CoV-2 infection. The NP IFN-I/III (IFN) score, defined by a four-ISGs transcriptional signature measured using FilmArray technology, was evaluated. (A) Correlation between the NP IFN-I/III score and the blood IFN-I/III score obtained from the PAXgene whole-blood sample (PX, n = 75 longitudinal samples from 23 patients). The Spearman's correlation coefficient is shown. (B) Correlation between the IFN-I/III score and IFN-α2 levels (fg/ml) in plasma (n = 39 samples with a detectable value from 23 patients), measured by single-molecule array using a commercial kit. The Spearman's correlation coefficient is shown. (C) Kinetic measurements of the NP (green) and blood IFN-I/III scores (red) post COVID-19 diagnosis. n = 75 longitudinal samples from 23 patients. Fit Loess curves represent local polynomial regressions as determined by the Loess method. Confidence interval at 95% is indicated (gray area).
Figure S4.
Figure S4.
Correlation between IFN-I/III scores and serum I IFN-λ1 levels. (A and B) Correlation between the blood (A; PX) or NP (B) IFN-I/III scores and plasmatic IFN-λ1 levels (n = 56 samples with a detectable value from 22 patients), determined by ELISA. The Spearman's correlation coefficient is shown.
Figure 3.
Figure 3.
The nasal IFN-I/III score is a surrogate marker of SARS-CoV-2 infectivity. (A) Correlation between the NP IFN-I/III (IFN) score and the nasal SARS-CoV-2 normalized viral load (n = 75 longitudinal samples from 23 patients) measured using the SARS-CoV-2 R-gene kit. The Spearman's correlation coefficient is shown. Red dot corresponds to a patient with a strong nasal IFN-I/III score at V1 despite a low viral load <4.4 Log10 cp/106 cells. (B and C) Scatterplots showing nasal (B) and blood (PX, PAXgene; C) IFN-I/III scores in patients with normalized viral load superior or inferior to 4.40 log10 cp/106 cells (n = 75 longitudinal samples from 23 patients). Red dot corresponds to a patient with a strong nasal IFN-I/III score at V1 despite a low viral load <4.4 log10 cp/106 cells. Statistical comparison was performed using a nonparametric Mann–Whitney test (***, P < 0.001). (D) Scatterplot of the NP IFN-I/III score in patients with positive or negative nasal SARS-CoV-2 viral culture (n = 30 longitudinal samples from 12 patients). Filled circles represent negative virus culture samples, empty circles represent positive virus culture sample, and triangle corresponds to a sample positive on cell culture without cytopathic effect. Statistical comparison was performed using a nonparametric Mann–Whitney test (***, P < 0.001). (E) Receiver-operating characteristic curve discriminating between positive and negative SARS-CoV-2 viral culture result. Area under the curve and Youden index are calculated and represent the ability of the NP IFN-I/III score to separate positive and negative viral cultures. (F) 10-fold serial dilutions (10° to 10−2) of NP swab samples were performed and followed by measurements of IFN-I/III scores (dark gray, FilmArray) and SARS-CoV-2 load (Ct detection, light gray, SARS-CoV-2 R-gene kit). Data are expressed as floating bars (n = 3; mean [min-max]). The green area depicts the cutoff point IFN-I/III score associated with positive viral culture (6.75).
Figure 4.
Figure 4.
Critically ill COVID-19 patients with auto-Abs have a weak nasal IFN-I/III score despite high virus load. (A and B) Comparison of normalized nasal viral load and NP IFN-I/III (IFN) scores in critically ill COVID-19 patients without anti-IFN auto-Abs (A; empty spheres) or with neutralizing auto-Abs (nAb) against IFN-α (B; black triangles). The gray area represents the viral load obtained for 15 out of 17 mildly symptomatic COVID-19 patients (88%) with an IFN-I/III score >6.75 (cutoff value associated with positive viral culture, in red). Dashed lines represent patient with auto-Abs against IFN-α2 only.
Figure 5.
Figure 5.
Sera containing antiIFN-I antibodies neutralize IFN-α2 antiviral activity in a reconstituted HAE model of SARS-CoV-2 infection. The effect of APS-1 serum was evaluated in an HAE model of SARS-CoV-2 infection. (A) Nasal HAEs were treated (24 h before and 1 h after SARS-CoV-2 infection) with recombinant IFN-α2 in the presence or absence of APS-1 patient or control serum, as indicated. Apical washes were performed 54 hpi, and viral titers were determined by RT-PCR. Results are representative of three biological replicates and expressed as relative to the mock-treated control. (B) Apical infectious viral titers 54 hpi determined by TCID50 (median tissue culture infectious dose). The dotted line depicts the limit of detection. (C) Relative TEER (Δ TEER) between t = 0 and t = 54 hpi. (D) Relative expression of IFI44L assessed using FilmArray technology from total cellular RNA extracted after infection. In the figure, bars and error bars represent mean and SD, respectively. A Kruskal–Wallis with uncorrected Dunn’s test was used for statistical analysis of data presented in this figure (multiple comparisons; *, P < 0.05; **, P <0.01; ***, P < 0.001). In A, B, and D, the reference condition was SARS-CoV-2 alone (white bars), and in C, the reference was the mock condition (beige bars).
Figure S5.
Figure S5.
Sera containing antiIFN-I antibodies neutralize IFN-α2 antiviral activity in a reconstituted HAE model of SARS-CoV-2 infection. The effect of a serum from a non–APS-1 patient containing IFN-I auto-Abs was evaluated in a reconstituted HAE model of SARS-CoV-2 infection. (A) Nasal HAEs were treated (24 h before and 1 h after SARS-CoV-2 infection) with recombinant IFN-α2 in the presence or absence of the indicated sera. Apical washes were performed 54 hpi, and viral titers were determined by RT-PCR. Results are representative of three biological replicates and expressed as relative to the mock-treated control. (B) Apical infectious viral titers 54 hpi determined by TCID50. The dotted line depicts the limit of detection. (C) Δ TEER between t = 0 and t = 54 hpi. (D) Relative expression of IFI44L assessed using FilmArray technology from total cellular RNA extracted after infection. In the figure, bars and error bars represent mean and SD, respectively. A Kruskal–Wallis with uncorrected Dunn’s test was used for statistical analysis of data presented in this figure (multiple comparisons; *, P < 0.05; **, P < 0.01). In all conditions, the reference condition was SARS-CoV-2 alone (white bars).
Figure 6.
Figure 6.
Sera from APS-1 patients do not influence IFN-β1, IFN-λ1, IFN-λ2, and IFN-λ3 antiviral activity but block IFN-α and IFN-ω antiviral activity. The effect of APS-1 serum (white bars) was evaluated in a reconstituted HAE model of SARS-CoV-2 infection in comparison with a control condition (black bars). (A) Nasal HAEs were treated (24 h before and 1 h after SARS-CoV-2 infection) with recombinant IFN-α2, IFN-β1, IFN-λ1, IFN-λ2, IFN-λ3, or IFN-ω in the presence or absence of APS-1 serum. Apical washes were performed at 54 hpi, and viral titers were determined by RT-PCR. Results are representative of three biological replicates and expressed as relative to the mock-treated control. (B) Apical infectious viral titers at 54 hpi determined by TCID50. The dotted line depicts the limit of detection. (C) Δ TEER between t = 0 and t = 54 hpi. (D) Relative expression of IFI44L assessed using FilmArray technology from total cellular RNA extracted after infection. In the figure, bars and error bars represent mean and SD, respectively. Multiple t tests with Bonferroni–Dunn method were used for the statistical analysis of data presented in this figure (comparison between control and APS-1 serum conditions in each readout; **, P < 0.01; ***, P < 0.001).

Comment in

References

    1. Bal, A., Trabaud M.-A., Fassier J.-B., Rabilloud M., Saker K., Langlois-Jacques C., Guibert N., Paul A., Alfaiate D., Massardier-Pilonchery A., et al. . COVID SER Study Group . 2021. Six-month antibody response to SARS-CoV-2 in healthcare workers assessed by virus neutralization and commercial assays. Clin. Microbiol. Infect. 27:933–935. 10.1016/j.cmi.2021.01.003 - DOI - PMC - PubMed
    1. Bastard, P., Rosen L.B., Zhang Q., Michailidis E., Hoffmann H.-H., Zhang Y., Dorgham K., Philippot Q., Rosain J., Béziat V., et al. . COVID Human Genetic Effort . 2020. Autoantibodies against type I IFNs in patients with life-threatening COVID-19. Science. 370:eabd4585. 10.1126/science.abd4585 - DOI - PMC - PubMed
    1. Bastard, P., Lévy R., Henriquez S., Bodemer C., Szwebel T.-A., and Casanova J.-L.. 2021a. Interferon-β Therapy in a Patient with Incontinentia Pigmenti and Autoantibodies against Type I IFNs Infected with SARS-CoV-2. J. Clin. Immunol. 41:931–933. 10.1007/s10875-021-01023-5 - DOI - PMC - PubMed
    1. Bastard, P., Manry J., Chen J., Rosain J., Seeleuthner Y., AbuZaitun O., Lorenzo L., Khan T., Hasek M., Hernandez N., et al. . 2021b. Herpes simplex encephalitis in a patient with a distinctive form of inherited IFNAR1 deficiency. J. Clin. Invest. 131:e139980. 10.1172/JCI139980 - DOI - PMC - PubMed
    1. Bastard, P., Michailidis E., Hoffmann H.-H., Chbihi M., Le Voyer T., Rosain J., Philippot Q., Seeleuthner Y., Gervais A., Materna M., et al. . 2021c. Auto-antibodies to type I IFNs can underlie adverse reactions to yellow fever live attenuated vaccine. J. Exp. Med. 218:e20202486. 10.1084/jem.20202486 - DOI - PMC - PubMed

Publication types

MeSH terms