. 2021 Sep 7;49(15):8535-8555.
doi: 10.1093/nar/gkab680.

Investigation of RNA metabolism through large-scale genetic interaction profiling in yeast

Affiliations

Investigation of RNA metabolism through large-scale genetic interaction profiling in yeast

Laurence Decourty et al. Nucleic Acids Res. .

Abstract

Gene deletion and gene expression alteration can lead to growth defects that are amplified or reduced when a second mutation is present in the same cells. We performed 154 genetic interaction mapping (GIM) screens with query mutants related with RNA metabolism and estimated the growth rates of about 700 000 double mutant Saccharomyces cerevisiae strains. The tested targets included the gene deletion collection and 900 strains in which essential genes were affected by mRNA destabilization (DAmP). To analyze the results, we developed RECAP, a strategy that validates genetic interaction profiles by comparison with gene co-citation frequency, and identified links between 1471 genes and 117 biological processes. In addition to these large-scale results, we validated both enhancement and suppression of slow growth measured for specific RNA-related pathways. Thus, negative genetic interactions identified a role for the OCA inositol polyphosphate hydrolase complex in mRNA translation initiation. By analysis of suppressors, we found that Puf4, a Pumilio family RNA binding protein, inhibits ribosomal protein Rpl9 function, by acting on a conserved UGUAcauUA motif located downstream the stop codon of the RPL9B mRNA. Altogether, the results and their analysis should represent a useful resource for discovery of gene function in yeast.


Figures

Figure 1.
Figure 1.
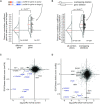
Overview of the cellular functions of query genes tested in GIM screens. (A) Classification of the tested mutants in broad groups associated with major cellular processes, including mRNA translation, protein degradation and ribosome function and biogenesis. The number of genes for which we performed GIM screens from each class is indicated, with RNA-related processes highlighted in blue. (B) Three types of mutants were used in screens, mostly gene deletion, but also DAmP and regulated expression strains (left). The pool of barcoded deletion strains used in each screen was supplemented with our collection of DAmP strains for essential genes (right). (C) The workflow for analysing the microarray results involved normalization, correction of the signal peaks that indicate the low frequency of meiotic recombination that occurs for loci situated close on the same chromosome and averaging of values from independent screens. The initial signal and corrected version for each of the screens are presented in Supplementary Data Set 1.
Figure 2.
Figure 2.
Correcting for pleiotropy improves ranks of genes functionally related with the tested mutant. (A) For each measured effect of a mutant in the 154 screens, we evaluated the cumulative distribution of the log2(Q/R) values. Results for genes having an unusual behavior are displayed, including KEX2 (blue cross), VPS63 (orange square), VPS3 (downside gray triangle) compared with the average for all screens (black circle) or for a mutant showing highly specific interactions, MPP6 (upside dark blue triangle). Examples of applying a correction based on pleiotropy to the ranks of the 10 best hits for the screens performed with maf1Δ (B), pus1Δ (C) and tetO2-rrp6 (D). Initial scores are indicated with orange dots and adjusted values are illustrated as blue dots. Genes marked with a triangle correspond to mutants that are known to affect the same pathway (tRNA synthesis for MAF1 and PUS1 and RNA degradation in the nucleus for RRP6).
Figure 3.
Figure 3.
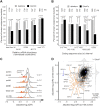
Large-scale validation of GIM data based on GI profile similarity analysis. (A) Comparison between the GI profiles of the same gene mutant were performed on 127 query genes (out of 154 screens) that were also measured as ‘target’ mutants. The distribution of the measured Pearson correlation coefficients are shown either for this situation, at the right of the plot, labeled ‘same gene’, and for all the possible other 16 002 distinct pairs of the 127 mutants, as background, labeled ‘different gene’, at the left. The similarity of the two distributions was evaluated using the non-parametric Wilcoxon rank sum test (P < 2 × 10–16 for the null hypothesis, no difference). Dots at the right of the distribution representation correspond to individual Pearson correlation values. (B) We identified 267 situations where the deleted region for a gene or pseudogene had an overlap with the deleted region of another gene and extracted the Pearson correlation values for the corresponding GI profiles. The distribution of Pearson correlation coefficient values for all possible pairs involving genes for which overlapping deletions were tested (‘all combinations’, left) and for overlapping deletion pairs (‘overlapping deletions’, right) is shown. The two populations of values were different, as estimated with the non-parametric Wilcoxon rank sum test (P < 2 × 10–16). (C) Example of similarity for GIM and SGA results. Scatter plot showing the top 10 genes most affected in either SGA or GIM screens performed with maf1Δ (GIM) compared with the same mutant in the SGA data (13). In both C and D plots, triangles and blue color indicate genes that are known to be functionally linked with the screen query gene. (D) Example of results obtained using transcription repression for the query gene RRP6. Scatter plot to compare the results of the GIM tetO2-rrp6 screen and SGA rrp6Δ screen. YNR025C partially overlaps the exosome-associated factor gene MPP6.
Figure 4.
Figure 4.
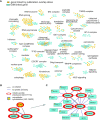
DAmP perturbation has effects correlated with mRNA abundance and coding sequence length and is valuable for the study of major cellular functions. (A) We arbitrarily assigned the various mutants from this study in two classes: screen-responsive, if the corresponding mutant showed a growth defect score of at least 2 (log2(Q/R)< -1) in at least one of the 154 screens, and screen-neutral if the mutant was not affected in any of the screens. The percent of screen-responsive deletion (light gray) and DAmP (black) strains was plotted as a function of relative mRNA abundance (104), with transcripts grouped in five bins having identical numbers of DAmP mutants. The differences between the numbers of DAmP and deletion mutants in each bin were evaluated with a chi-squared test (the P value for the null hypothesis of identical percentages is indicated). The number of genes in each bin is indicated in the upper part of the panel. (B) Equal sized bins of DAmP mutants were created based on the coding sequence length and the percentage of screen-responsive strains was compared with the results for deletion mutants for genes having similar sizes of coding sequences. The number of mutants in each bin is indicated. (C) We used the median of the relative rank for 22 DAmP mutants affecting proteasome and proteasome-related genes to identify the five screens in which these mutants were most affected (in increasing rank order from bottom to top). The distribution of all adjusted log2(Q/R) values in the five selected screens is indicated. Red dots indicate the position of the adjusted log2(Q/R) scores for proteasome DAmP mutants. (D) Specific DAmP effects are illustrated by a scatter plot showing the correlation between the adjusted log2(Q/R) scores obtained when the screen was done with the deletion of the RPN10 proteasome component gene (horizontal axis) compared with the deletion of the RPN4 proteasome regulator (vertical axis). DAmP proteasome related mutants are indicated in orange and two non-essential proteasome gene deletions are indicated in blue.
Figure 5.
Figure 5.
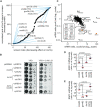
Integration of literature data and GIM profile similarity allows extension of known functional networks. (A) Links between genes were inferred from literature data obtained from the Saccharomyces Genome Database and were used to define functionally related gene groups. If two genes in a group were, in addition to a literature link, also connected by correlated GI profiles from our data set, the two genes were highlighted in cyan, otherwise, the colour used was orange. Only a selection of 35 gene groups in which at least 4 genes showed correlated GI profiles is shown. Each gene group was annotated manually, either in terms of a protein complex or based on known cellular or molecular function. (B) Example of a literature-based gene group, not shown in A, bringing together several genes involved in mitotic spindle checkpoint. The GI profile similarity between deletions of MAD1 and MAD3 and MAD1 and MAD2 are shown as solid lines, while co-citation links are shown as dotted lines. Extending this network using only the similarity of GIM profiles led to the network shown in C. (C) Starting from MAD1, MAD2 and MAD3, the GI similarity-based functional network adds supplementary genes involved in mitotic spindle checkpoint, such as KAR9, BFA1 and CTF19 (marked with a red outline) and genes involved in the dynamics of the microtubule cytoskeleton (marked with a yellow square). All the shown links, depicted as blue lines, represent GI profile similarity above an arbitrary threshold. Dashed lines represent co-citation.
Figure 6.
Figure 6.
Deletion of LOS1 is functionally related to a defective OCA complex. (A) Rank analysis of los1Δ results for GIM screens highlighting synthetic slow growth (lower left) and potential epistasis (upper right). (B) The double deletion strains combining los1Δ and oca2Δ were strongly affected by the presence of 0.1M LiCl in the medium. Complementation of growth defect by empty vector (pRS316) or by centromeric plasmids expressing OCA2 and LOS1 was estimated by serial dilutions and observation of colonies after 48 hours of growth at 30°C. Deletion of YEL068C served as the equivalent of a wild type control. (C) The inverse correlation between the transcriptome changes in oca5Δ and gcn4Δ shows transcripts that were up-regulated in the absence of OCA5, while being targets of GCN4 activation, including many mRNAs that code for amino acid biosynthesis proteins. The position of the signal for mRNA of ARG1 and SNO1, chosen for validation of the transcriptome results, are indicated by orange dots. (D) and (E) Validation by RT-qPCR of mRNA level changes in an oca2Δ strain, in comparison with gcn4Δ, los1Δ, and the combination oca2Δ, los1Δ for ARG1 and SNO1 mRNA, using RIM1 mRNA levels as reference. Individual measurements for three to four independent experiments are shown, with the red bar indicating the mean and the blue bars indicating limits of the 99% confidence interval (non-parametric bootstrap). The indicated P-values correspond to results of single sided t-tests.
Figure 7.
Figure 7.
Initiator tRNA limits cell growth when the OCA complex is defective. (A) Double mutant strains show translation initiation defects, as measured using a GCN4 uORF-lacZ reporter, schematically represented in the upper part of the panel (p180 plasmid, 84). Wild type strain was used as reference and the variation in the amounts of produced beta-galactosidase were measured in at least five independent experiments. The P-values of single-sided t-tests for differences between the different conditions are indicated. (B) Over-expression of the tRNAiMet (p1775 plasmid, 105) allows better growth of oca2/los1 and oca5/los1 double deletion strains under stress conditions (0.1 M LiCl). Serial dilutions of fresh cells were grown on plates for 48 hours. The presence of an empty vector (empty circle) or of the plasmid over-expressing the tRNAiMet (black square) are indicated. Deletion of YEL068C was used as the equivalent of a wild type control.
Figure 8.
Figure 8.
Puf4 represses RPL9B function through a conserved UGUAcauUA motif. (A) Results of screens performed with query strains having deletions of ribosomal protein genes were ranked in decreasing order of the size of GI with the deletion of PUF4, from positive, upper part of the panel, to negative values. The position of the value measured for PUF4 is indicated by a yellow dot in comparison with the overall distribution of all measured values for each screen (continuous line). (B) Adding a deletion of PUF4 to a slow-growing rpl9aΔ strain improved growth on plates. Growth of the rpl9aΔ strain was tested in the presence of centromeric plasmid with RPL9A and RPL9B. Expression of PUF4 from a centromeric plasmid was slightly detrimental for growth of the rpl9aΔ/puf4Δ strain. YEL068C deletion allowed the presence of equivalent antibiotic resistance markers in the different strains. YPD plates with serial dilutions of cells were grown for 28 hours at 30°C. (C) Puf4 consensus binding motifs, in red, are present and conserved in the 3′ UTR of RPL9B in S. cerevisiae and related yeast species: Kluyveromyces lactis, Lachancea thermotolerans and Lachancea kluyverii. (D) The presence of the conserved Puf4 binding motif in the 3′ UTR of RPL9B limits the expression of a reporter protein, as measured by immunoblots. Regions of 1 to 103 nucleotides (S) and 1 to 308 nucleotides (L) of the RPL9B 3′ UTR region were added downstream a coding sequence that consists of a fusion between the HA epitope and a fragment of the ALA1 coding sequence (nucleotides 4 to 492, the fusion protein is unstable and its levels mirror mRNA translation and stability). The potential Puf4 binding motif, indicated as a red rectangle, was changed from UGUAcauUA (native) to GAUUcauUA (mut) and the corresponding plasmids were introduced in control (wt), puf4Δ and nmd2Δ strains. Anti-HA immunoblot results were calibrated using succesive binary dilutions of one of the extracts (see Supplementary Figure S10A for a representative immunoblot example). The results represent average and standard deviation corresponding to three independent experiments. Comparisons between conditions were performed using the Welch two sample t-test, and the indicated P-values correspond to one-sided difference results. (E) The inhibitory action of Puf4 on RPL9B mRNA (binding motif depicted as red rectangle) is revealed in the absence of RPL9A mRNA, when the only source of Rpl9 protein is RPL9B. Coding sequences are depicted as white rectangles, with 5′ UTR and 3′ UTR regions drawn as lines to the same relative scale.

References

    1. Dujon B.Yeast evolutionary genomics. Nat. Rev. Genet. 2010; 11:512–524. - PubMed
    1. Marsit S., Leducq J.-B., Durand E., Marchant A., Filteau M., Landry C.R.. Evolutionary biology through the lens of budding yeast comparative genomics. Nat. Rev. Genet. 2017; 18:581–598. - PubMed
    1. Gu Z., Steinmetz L.M., Gu X., Scharfe C., Davis R.W., Li W.-H.. Role of duplicate genes in genetic robustness against null mutations. Nature. 2003; 421:63–66. - PubMed
    1. Keane O.M., Toft C., Carretero-Paulet L., Jones G.W., Fares M.A.. Preservation of genetic and regulatory robustness in ancient gene duplicates of Saccharomyces cerevisiae. Genome Res. 2014; 24:1830–1841. - PMC - PubMed
    1. Qian W., Zhang J.. Genomic evidence for adaptation by gene duplication. Genome Res. 2014; 24:1356–1362. - PMC - PubMed

Publication types

MeSH terms