. 2021 Nov;51(11):2633-2640.
doi: 10.1002/eji.202149319. Epub 2021 Aug 19.

Single-reaction multi-antigen serological test for comprehensive evaluation of SARS-CoV-2 patients by flow cytometry

Affiliations

Single-reaction multi-antigen serological test for comprehensive evaluation of SARS-CoV-2 patients by flow cytometry

Yaiza Cáceres-Martell et al. Eur J Immunol. 2021 Nov.

Abstract

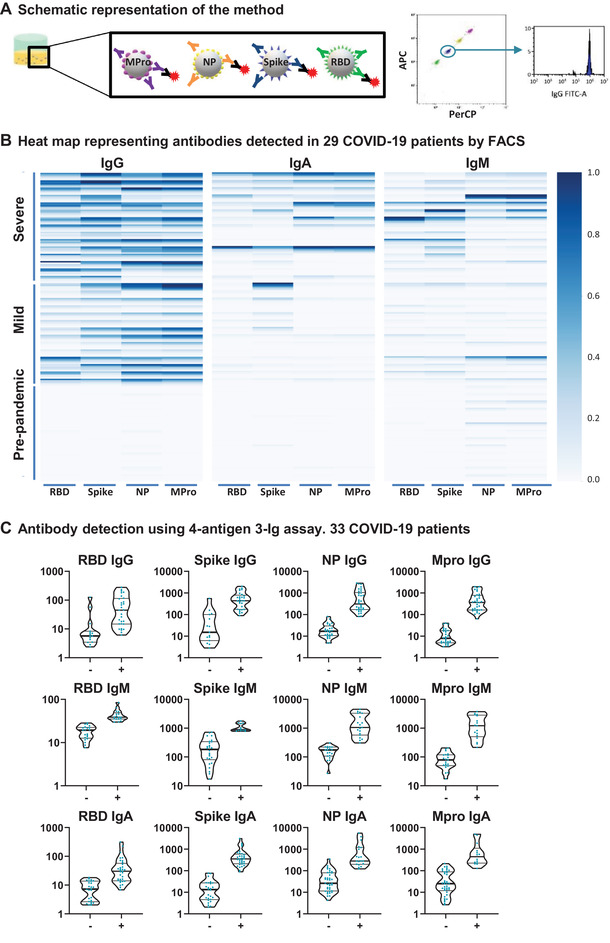
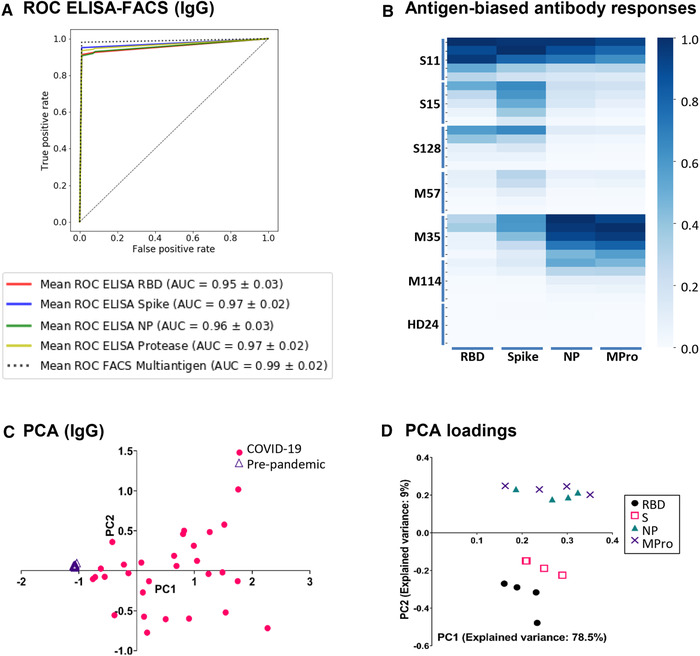
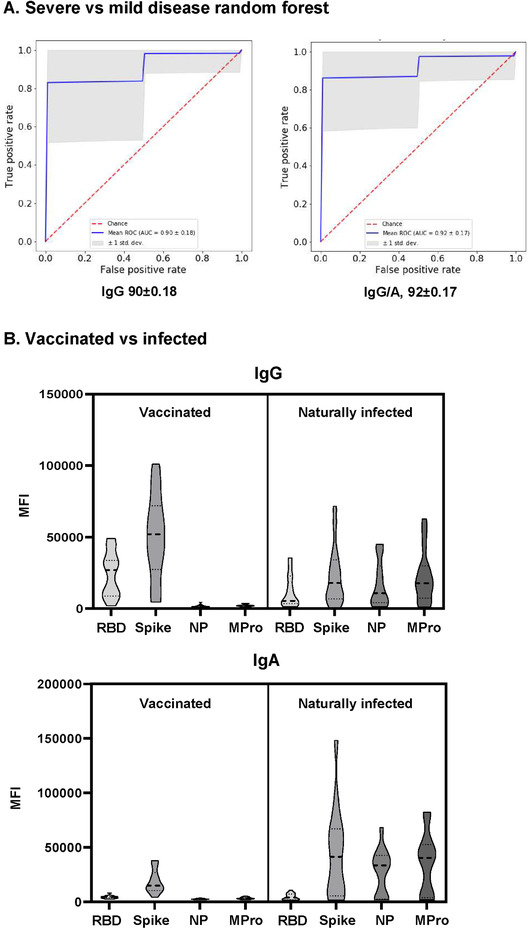
Here, we describe a new, simple, highly multiplexed serological test that generates a more complete picture of seroconversion than single antigen-based assays. Flow cytometry is used to detect multiple Ig isotypes binding to four SARS-CoV-2 antigens: the Spike glycoprotein, its RBD fragment (the main target for neutralizing antibodies), the nucleocapsid protein, and the main cysteine-like protease in a single reaction. Until now, most diagnostic serological tests measured antibodies to only one antigen and in some laboratory-confirmed patients no SARS-CoV-2-specific antibodies could be detected. Our data reveal that while most patients respond against all the viral antigens tested, others show a marked bias to make antibodies against either proteins exposed on the viral particle or those released after cellular infection. With this assay, it was possible to discriminate between patients and healthy controls with 100% confidence. Analysing the response of multiple Ig isotypes to the four antigens in combination may also help to establish a correlation with the severity degree of disease. A more detailed description of the immune responses of different patients to SARS-CoV-2 virus might provide insight into the wide array of clinical presentations of COVID-19.

Keywords: COVID-19; FACS; coronavirus; diagnostics; microbeads; serology.


Conflict of interest statement

J.M.R.F., J.M.C., H.T.R., and M.V.G. are inventors on the European patent “Assay for the detection of the Cys‐like protease (Mpro) of SARS‐CoV‐2” [EP20382495.8]. RJA is CEO of Immunostep, S.L. D.N.H. and A.B.M. are employed by Immunostep, S.L. The rest of the authors declare no potential conflict of interest.

Figures

Figure 1
Figure 1
A multi‐antigen assay to detect SARS‐CoV‐2 specific antibodies. (A) Schematic representation of the method. Four different SARS‐CoV‐2 antigens (Mpro, NP, S, and RBD) were covalently coupled to magnetic beads with different fluorescence intensity in the APC and PerCP channels. Equal amounts of the different beads mixed in the same tube were incubated with plasma. SARS‐CoV‐2‐specific antibodies were visualized with fluorophore‐conjugated secondary antibodies followed by flow cytometry. (B) Heat map representing antibody titers from multi‐antigen COVID‐19 assays. Plasma from 15 healthy controls and 29 COVID‐19 patients were incubated with S‐, RBD‐, NP‐, and Mpro‐ coated beads. Specific IgG‐PE, IgA‐FITC+ IgM‐PE responses were analyzed by flow cytometry. The data are summarized in a heat map. Each column corresponds to one antigen while rows show four different plasma dilutions (1/100, 1/200, 1/600, 1/1800) for each individual. The intensity of the blue color depicts the amount of antibody. (C) Multi‐antigen assay for SARS‐CoV‐2 antibody detection in a single reaction. The assay was done, as in B, but only 1/100 dilution was tested and antibodies were developed with three combined anti‐human Ig antibodies (IgG‐FITC, IgM‐PE, and IgA‐PE‐Cyanine7). Statistic comparison was carried out using a Mann‐Whitney test.
Figure 2
Figure 2
(A) ROC curves comparing single‐antigen ELISA and multi‐antigen FACS assays. A random forest classifier, trained with IgG values from one healthy and two COVID samples was used to predict the rest of the samples. The mean ROC curve after 15‐fold cross‐validation is shown for each condition. (B) Antigen‐biased antibody responses. Heat map of patients with biased IgG response against either S/RBD or NP/Mpro viral antigens. Data from 6 patients and 1 healthy donor are shown. (B) PCA of IgG. Triangles and circles represent pre‐pandemic controls and COVID‐19 patients, respectively. (C) PCA loadings. Visual representation of the loadings of the two first principal components. Each dilution of IgG titer against RBD, Spike, NP, and MPro is represented as a separate variable.
Figure 3
Figure 3
(A) Algorithm for classification of COVID‐19 patient severity. A random forest was trained to discriminate between COVID‐19 patients with severe or mild disease, using either IgG data alone or including data from other isotypes, and then used to predict unseen patients. The mean ROC curve after 300 random repetitions is shown for each condition. (B) Comparison of vaccinated individuals and COVID‐19 convalescent patient antibody responses. Plasma IgG and IgA from 15 vaccinated donors (Pfizer/BioNTech), were compared to the antibodies produced by 15 naturally infected individuals.

References

    1. Zhu, N. , Zhang, D. , Wang, W. , Li, X. , Yang, B. , Song, J. , Zhao, X. et al., China Novel Coronavirus, I. and Research, T., A Novel Coronavirus from Patients with Pneumonia in China, 2019. N. Engl. J. Med. 2020. 382: 727–733. - PMC - PubMed
    1. Coronaviridae Study Group of the International Committee on Taxonomy of Viruses . The species Severe acute respiratory syndrome‐related coronavirus: classifying 2019‐nCoV and naming it SARS‐CoV‐2. Nature Microbiology. 2020. 5: 536–544. - PMC - PubMed
    1. Dudley, J. P. and Lee, N. T. , Disparities in Age‐specific Morbidity and Mortality From SARS‐CoV‐2 in China and the Republic of Korea. Clin. Infect. Dis. 2020. 71: 863–865. - PMC - PubMed
    1. Gadi, N. , Wu, S. C. , Spihlman, A. P. and Moulton, V. R. , What's Sex Got to Do With COVID‐19? Gender‐Based Differences in the Host Immune Response to Coronaviruses. Front. Immunol. 2020. 11: 2147. - PMC - PubMed
    1. Tay, M. Z. , Poh, C. M. , Renia, L. , MacAry, P. A. and Ng, L. F. P. , The trinity of COVID‐19: immunity, inflammation and intervention. Nat. Rev. Immunol. 2020. 20: 363–374. - PMC - PubMed

Publication types