. 2021 Sep 8;29(9):1378-1392.e6.
doi: 10.1016/j.chom.2021.07.004. Epub 2021 Aug 5.

Alterations in the gut microbiota contribute to cognitive impairment induced by the ketogenic diet and hypoxia

Affiliations

Alterations in the gut microbiota contribute to cognitive impairment induced by the ketogenic diet and hypoxia

Christine A Olson et al. Cell Host Microbe. .

Abstract

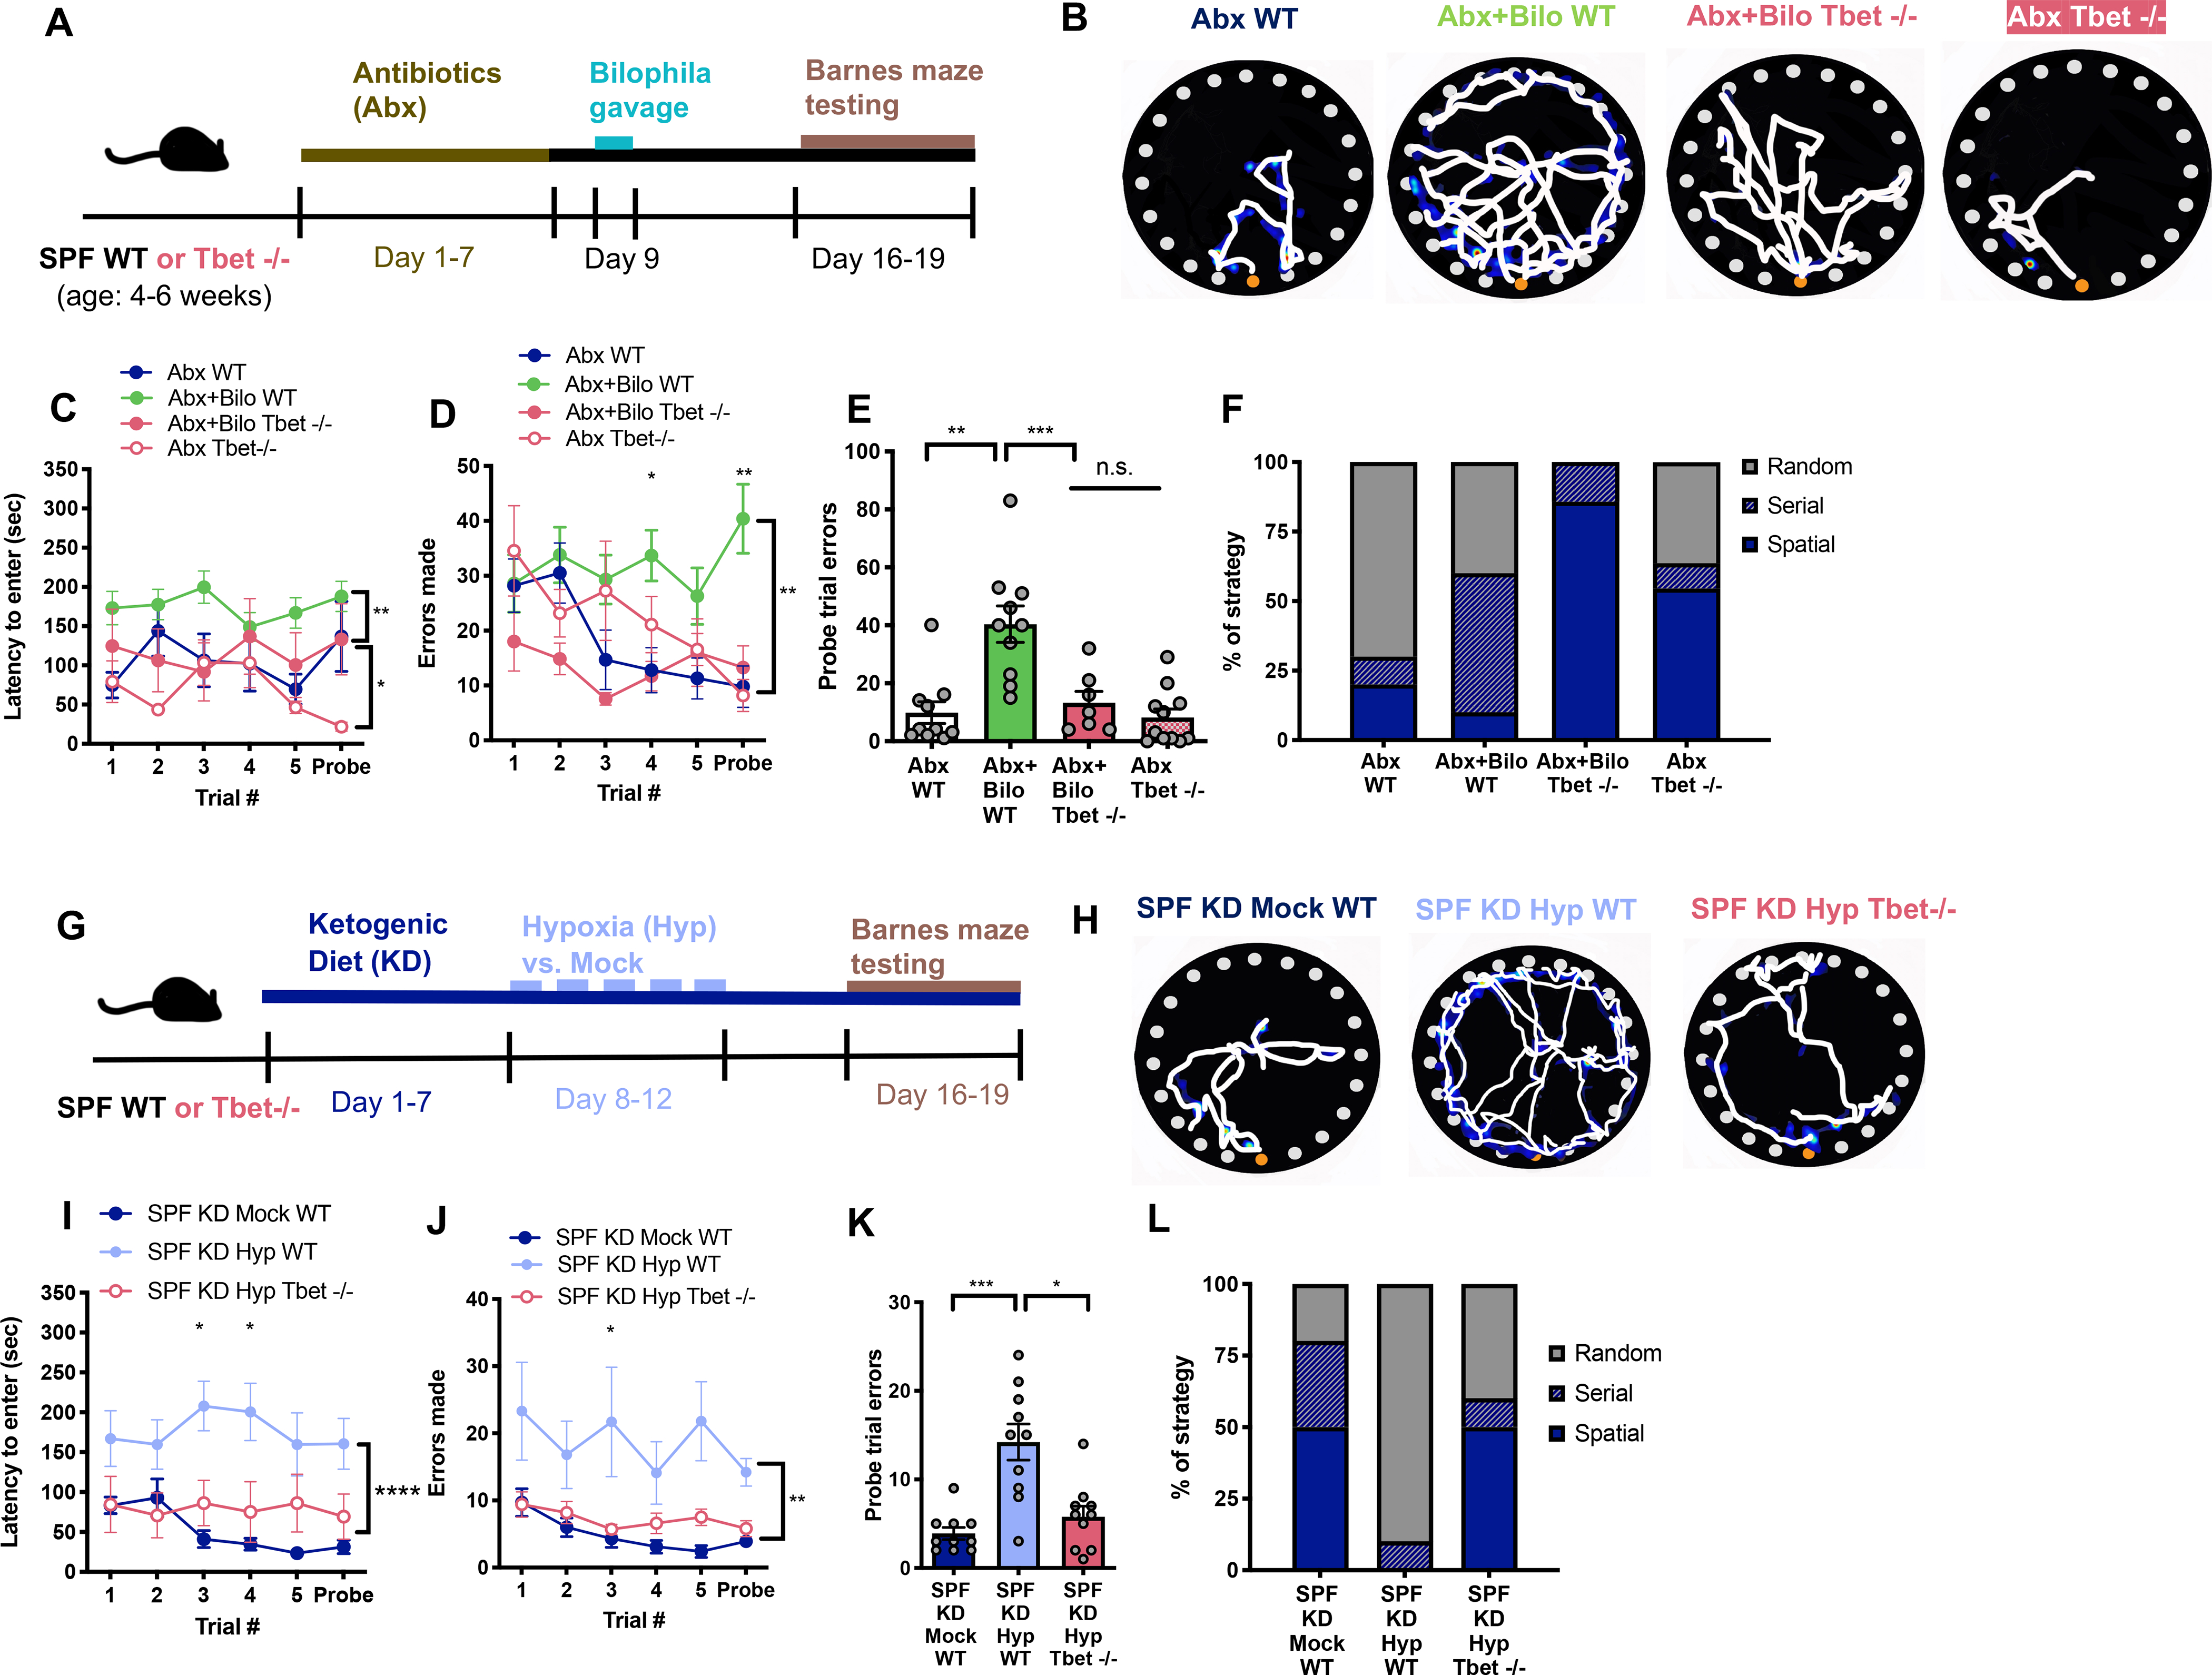
Many genetic and environmental factors increase susceptibility to cognitive impairment (CI), and the gut microbiome is increasingly implicated. However, the identity of gut microbes associated with CI risk, their effects on CI, and their mechanisms remain unclear. Here, we show that a carbohydrate-restricted (ketogenic) diet potentiates CI induced by intermittent hypoxia in mice and alters the gut microbiota. Depleting the microbiome reduces CI, whereas transplantation of the risk-associated microbiome or monocolonization with Bilophila wadsworthia confers CI in mice fed a standard diet. B. wadsworthia and the risk-associated microbiome disrupt hippocampal synaptic plasticity, neurogenesis, and gene expression. The CI is associated with microbiome-dependent increases in intestinal interferon-gamma (IFNg)-producing Th1 cells. Inhibiting Th1 cell development abrogates the adverse effects of both B. wadsworthia and environmental risk factors on CI. Together, these findings identify select gut bacteria that contribute to environmental risk for CI in mice by promoting inflammation and hippocampal dysfunction.

Keywords: Bilophila; brain; cognition; hippocampus; microbiota; neuroimmune.


Conflict of interest statement

Declaration of interests The authors declare no competing interests.

Figures

Figure 1:
Figure 1:. The Ketogenic Diet Potentiates Hypoxia-Induced Impairments in Cognitive Behavior.
A) Experimental timeline B) Representative Barnes maze traces for SPF mice fed the CD and exposed to Mock or Hyp. White lines indicate movement trajectories, whereas blue hues denote increasing durations of time spent at a specific location. Orange circles indicate the escape hole. C) Latency to enter the escape hole of the Barnes maze across six 300-second trials. (Two-way ANOVA with Sidak, n=13–17). D) Errors made as measured by number of incorrect nose pokes. (Two-way ANOVA with Sidak, n=13–17). E) Errors made during the final trial (probe). (Unpaired two-tailed Students t-test, n=13–17). F) Search strategy used during the probe trial. (n=13–17). G) Experimental timeline. (n=11–13). H) Representative Barnes maze traces for SPF mice fed the KD and exposed to Mock or Hyp. I) Latency to enter the escape hole across six 300-second trials. (Two-way ANOVA with Sidak, n=11–13). J) Errors made. (Two-way ANOVA with Sidak, n=11–13). K) Errors made during the probe trial. (Unpaired two-tailed Students t-test, n=11–13). L) Search strategy used during the probe trial. (n=11–13). Data are presented as mean ± S.E.M. * p < 0.05, **p < 0.01, ***p < 0.001, ****p < 0.0001. n.s.=not statistically significant. SPF=specific pathogen-free (conventionally-colonized), CD=control diet, KD=ketogenic diet, Mock=intermittent normoxia exposure, Hyp=intermittent hypoxia exposure.
Figure 2:
Figure 2:. Alterations in the Gut Microbiota Contribute to Ketogenic Diet and Hypoxia-Induced Impairments in Cognitive Behavior.
A) Experimental timeline. B) Representative Barnes maze traces for SPF or Abx mice fed the KD and exposed to Hyp. White lines indicate movement trajectories, whereas blue hues denote increasing durations of time spent at a particular location. Orange circles indicate the escape hole. C) Latency to enter the escape hole of the Barnes maze across six 300-second trials. (Two-way ANOVA with Sidak, n=8 for Abx groups; SPF data are as in Fig. 1). D) Errors made as measured by number of incorrect nose pokes. (Two-way ANOVA with Sidak, n=8 for Abx groups; SPF data are as in Fig. 1). E) Errors made during the probe trial. (One-way ANOVA with Dunnett, n=8 for Abx groups; SPF data are as in Fig. 1). F) Search strategy used during probe trial. (n=8). G) Experimental timeline. H) Representative Barnes maze traces for GF transplanted with fecal microbiota from SPF KD Mock or SPF KD Hyp donors. Transplanted recipient mice receiving SPF KD Mock microbiota are denoted GF+Mock. Transplanted recipient mice receiving SPF KD Hyp microbiota are denoted GF+Hyp. I) Latency to enter the escape hole. (Two-way ANOVA with Sidak, n=23). J) Errors made. (Two-way ANOVA with Sidak, n=23). K) Errors made during the probe trial. (Unpaired two-tailed Students t-test, n=23). L) Search strategy used during probe trial. (n=14–15). Data are presented as mean ± S.E.M. * p < 0.05, **p < 0.01, ***p < 0.001, ****P < 0.0001. n.s.=not statistically significant. SPF=specific pathogen-free (conventionally-colonized), Abx= treated with antibiotics (ampicillin, vancomycin, metronidazole, neomycin), KD=ketogenic diet, Mock=intermittent normoxia exposure, Hyp=intermittent hypoxia exposure, GF=germ-free, GF+Mock = GF mice transplanted with microbiota from SPF mice fed KD and exposed to Mock, GF+Hyp = GF mice transplanted with microbiota from SPF mice fed KD and exposed to Hyp.
Figure 3:
Figure 3:. Bilophila is Enriched by the Ketogenic Diet and Hypoxia, and Sufficiently Impairs Cognitive Behavior.
A) Principal coordinates analysis of weighted UniFrac distance based on 16S rRNA gene profiling of feces from SPF mice fed KD and exposed to Hyp or Mock. (n=4 cages). B) Average taxonomic distributions of low abundance bacteria. (n=13 cages). C) Relative abundances of Clostridium cocleatum (left) and Bilophila spp. (right) in fecal microbiota. (Kruskal-Wallis with Bonferroni, n=13 cages). D) Principal coordinates analysis of weighted UniFrac distance based on 16S rRNA gene profiling of feces from GF mice transplanted with fecal microbiota from SPF KD Mock or SPF KD Hyp mice (in panels A-C). (n=4–5 cages) E) Average taxonomic distributions of low abundance bacteria (n=9 cages). F) Relative abundances of C. cocleatum (left) and Bilophila spp. (right) in fecal microbiota. (Kruskal-Wallis with Bonferroni, n=9 cages). G) Experimental timeline. H) Representative Barnes maze traces for GF mice monocolonized with Clos or Bilo. White lines indicate movement trajectories, whereas blue hues denote increasing durations of time spent at a particular location. Orange circles denote the escape hole. I) Latency to enter the escape hole across six 300-second trials for ex-GF mice and GF mice monocolonized with Clos or Bilo. (Two-way ANOVA with Sidak, n=15, 24, 6). J) Errors made. (Two-way ANOVA with Sidak, n=15, 24, 6). K) Errors made during the probe trial. (Unpaired two-tailed Students t-test, n=15, 24, 6). L) Search strategy used during probe trial. (n=15, 24, 6). M) Effect size of hypoxia on latency to enter the escape hole during the probe trial, as measured by the difference between Hyp groups and respective Mock controls for SPF, Abx, ex-GF, microbiota-transplanted (GF+Hyp-Mock), or monocolonized (GF+Bilo-Clos) mice fed CD or KD. (Two-way ANOVA with Dunnett, n=8–24). Data are presented as mean ± S.E.M. * p < 0.05, **p < 0.01, ***p < 0.001. n.s.=not statistically significant. SPF=specific pathogen-free (conventionally-colonized), KD=ketogenic diet, Mock=intermittent normoxia exposure, Hyp=intermittent hypoxia exposure, GF=germ-free, GF+Mock = GF mice transplanted with SPF KD Mock microbiota, GF+Hyp = GF mice transplanted with SPF KD Hyp microbiota, GF+Clos = GF mice monocolonized with C. cocleatum. GF+Bilo = GF mice monocolonized with B. wadsworthia, Abx= treated with antibiotics (ampicillin, vancomycin, metronidazole, neomycin), CD= control diet, ex-GF = behaviorally tested GF mice.
Figure 4:
Figure 4:. Bilophila Colonization Phenocopies Ketogenic Diet and Hypoxia-Induced Impairments in Hippocampal Activity.
A) Hippocampal long-term potentiation (LTP) as indicated by fEPSP slope in response to 100 Hz tetanus, expressed as a percentage of 20-minute baseline signal, from slice electrophysiology of brains from SPF mice fed KD and exposed to Hyp or Mock. (n=7–8). B) Average fEPSP slope during the last 5 minutes of hippocampal LTP recording. (Unpaired two-tailed Students t-test, n=7–8). C) Hippocampal population spike amplitude versus fEPSP slope. (Two-way ANOVA with Sidak, n=7–8). D) Hippocampal paired pulse facilitation. (Two-way ANOVA with Sidak, n=7–8). E) Hippocampal LTP from GF mice monocolonized with Clos or Bilo. (n=12). F) Average fEPSP slope during the last 5 minutes of hippocampal LTP recording. (Unpaired two-tailed Students t-test, n=12). G) Hippocampal population spike amplitude versus fEPSP slope. (Two-way ANOVA with Sidak, n=12). H) Hippocampal paired pulse facilitation. (Two-way ANOVA with Sidak, n=12). I) Principal components analysis of all differentially regulated genes from RNA sequencing of CA3 subfields of the hippocampus from GF mice monocolonized with Clostridium cocleatum (Clos) or Bilophila wadsworthia (Bilo). (n=6). J) Volcano plot labeling genes with high fold change of differential expression (Wald test, n=6). K) Representative image of doublecortin (DCX)-positive neurons in the dentate gyrus (left). Quantitation of DCX density per area of the dentate gyrus (right). (Unpaired two-tailed Students t-test, n=4–5). Data are presented as mean ± S.E.M. * p < 0.05, **p < 0.01, ***p < 0.001. n.s.=not statistically significant. SPF=specific pathogen-free (conventionally-colonized), Abx= treated with antibiotics (ampicillin, vancomycin, metronidazole, neomycin), GF=germ-free, KD=ketogenic diet, Hyp=intermittent hypoxia exposure, Mock=intermittent normoxia exposure, GF+Clos = GF mice monocolonized with C. cocleatum. GF+Bilo = GF mice monocolonized with B. wadsworthia, DCX=doublecortin, LTP=long-term-potentiation, fEPSP=field excitatory post-synaptic potential.
Figure 5.
Figure 5.. Th1 cell Expansion Contributes to Bilophila-induced Impairments in Cognitive Behavior.
A) Experimental timeline. B) Representative Barnes maze traces for Abx+WT mice compared to Abx mice colonized with B. wadsworthia with either WT or Tbet−/− background. White lines indicate movement trajectories, whereas blue hues denote increasing durations of time spent at a particular location. Orange circles denote the escape hole. C) Latency to enter the escape hole. (Two-way ANOVA with Sidak, n=7–11). D) Errors made. (Two-way ANOVA with Sidak, n=7–11). E) Errors made during the probe trial. (Unpaired two-tailed Students t-test, n=7–11). F) Search strategy used during the probe trial. (n=7–11). G) Experimental timeline. H) Representative Barnes maze traces for SPF KD Mock WT mice compared to SPF KD Hyp mice with either WT or Tbet −/− background. I) Latency to enter the escape hole. (Two-way ANOVA with Sidak, n=10). J) Errors made. (Two-way ANOVA with Sidak, n=10). K) Errors made during the probe trial. (Unpaired two-tailed Students t-test, n=10). L) Search strategy used during the probe trial. (n=10). Data are presented as mean ± S.E.M. * p < 0.05, **p < 0.01. n.s.=not statistically significant. SPF=specific pathogen-free (conventionally-colonized), Abx (conventionally-colonized mice treated with broad-spectrum antibiotics), WT= wildtype, Tbet −/−= knockout line for Tbet transcription factor, KD=ketogenic diet, Mock=intermittent normoxia exposure, Hyp=intermittent hypoxia exposure.

References

    1. Akinyemi RO, Mukaetova-Ladinska EB, Attems J, Ihara M, and Kalaria RN (2013). Vascular risk factors and neurodegeneration in ageing related dementias: Alzheimer’s disease and vascular dementia. Curr Alzheimer Res 10, 642–653. - PubMed
    1. Amir A, McDonald D, Navas-Molina JA, Kopylova E, Morton JT, Zech Xu Z, Kightley EP, Thompson LR, Hyde ER, Gonzalez A, et al. (2017). Deblur Rapidly Resolves Single-Nucleotide Community Sequence Patterns. mSystems 2. - PMC - PubMed
    1. Anders S, Pyl PT, and Huber W (2015). HTSeq--a Python framework to work with high-throughput sequencing data. Bioinformatics 31, 166–169. - PMC - PubMed
    1. Andrews S (2010). FastQC: a quality control tool for high throughput sequence data. Available online at: http://www.bioinformatics.babraham.ac.uk/projects/fastqc
    1. Arcego DM, Toniazzo AP, Krolow R, Lampert C, Berlitz C, Dos Santos Garcia E, do Couto Nicola F, Hoppe JB, Gaelzer MM, Klein CP, et al. (2018). Impact of High-Fat Diet and Early Stress on Depressive-Like Behavior and Hippocampal Plasticity in Adult Male Rats. Molecular neurobiology 55, 2740–2753. - PubMed

Publication types