. 2021 Sep 2;81(17):3604-3622.e10.
doi: 10.1016/j.molcel.2021.07.018. Epub 2021 Aug 5.

ZMYND8-regulated IRF8 transcription axis is an acute myeloid leukemia dependency

Affiliations

ZMYND8-regulated IRF8 transcription axis is an acute myeloid leukemia dependency

Zhendong Cao et al. Mol Cell. .

Abstract

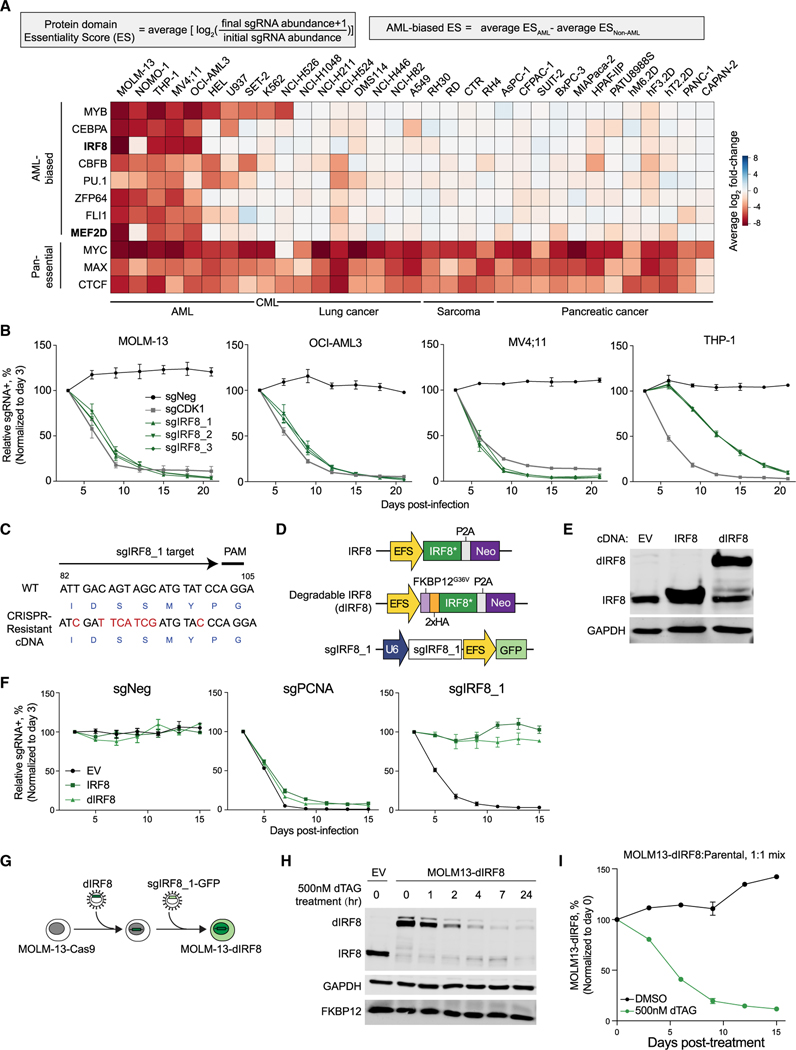
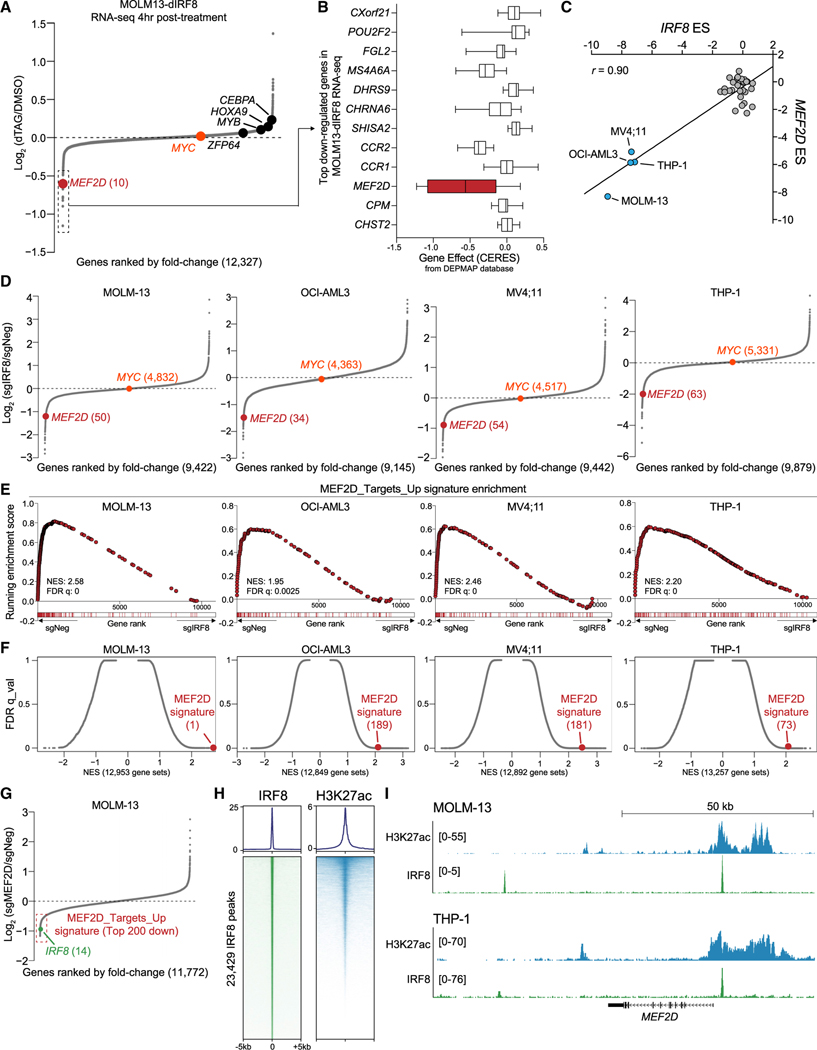
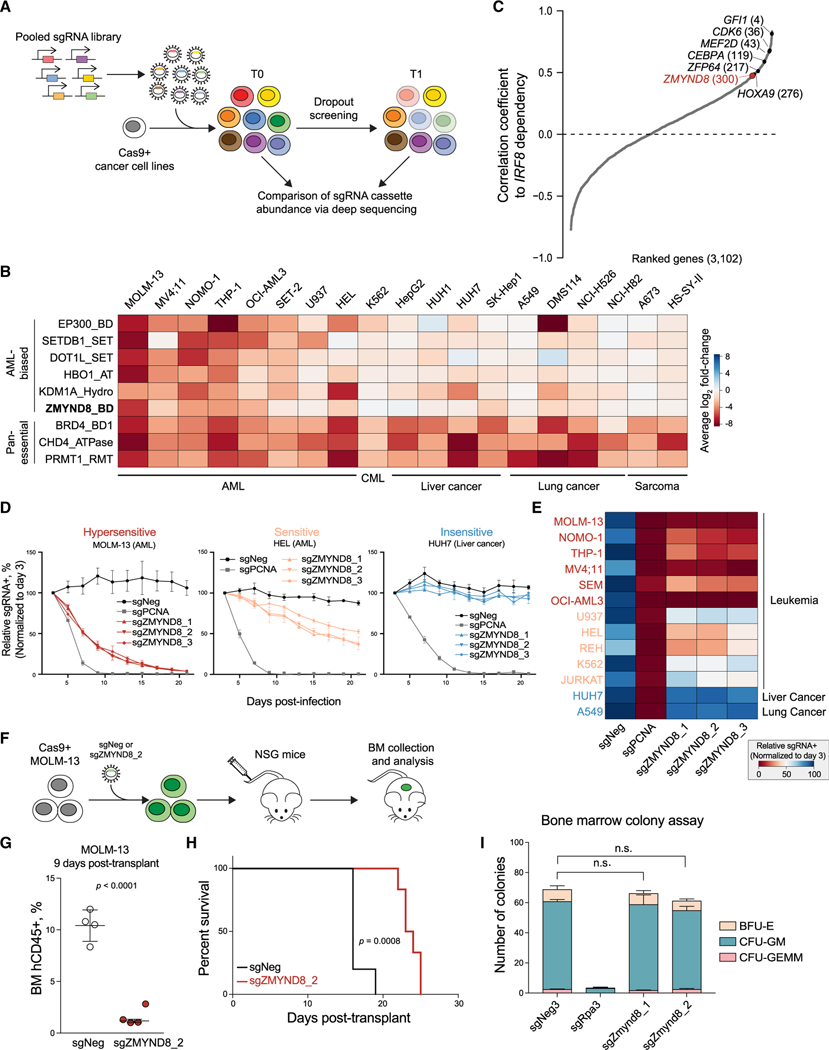
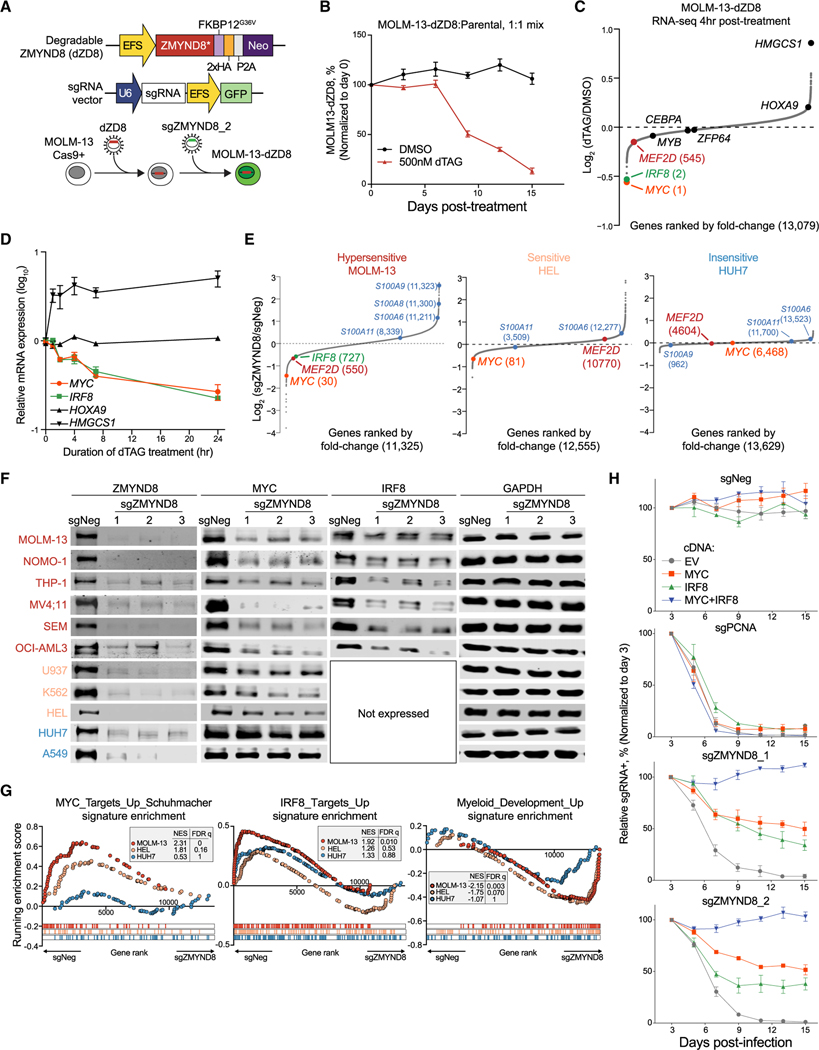
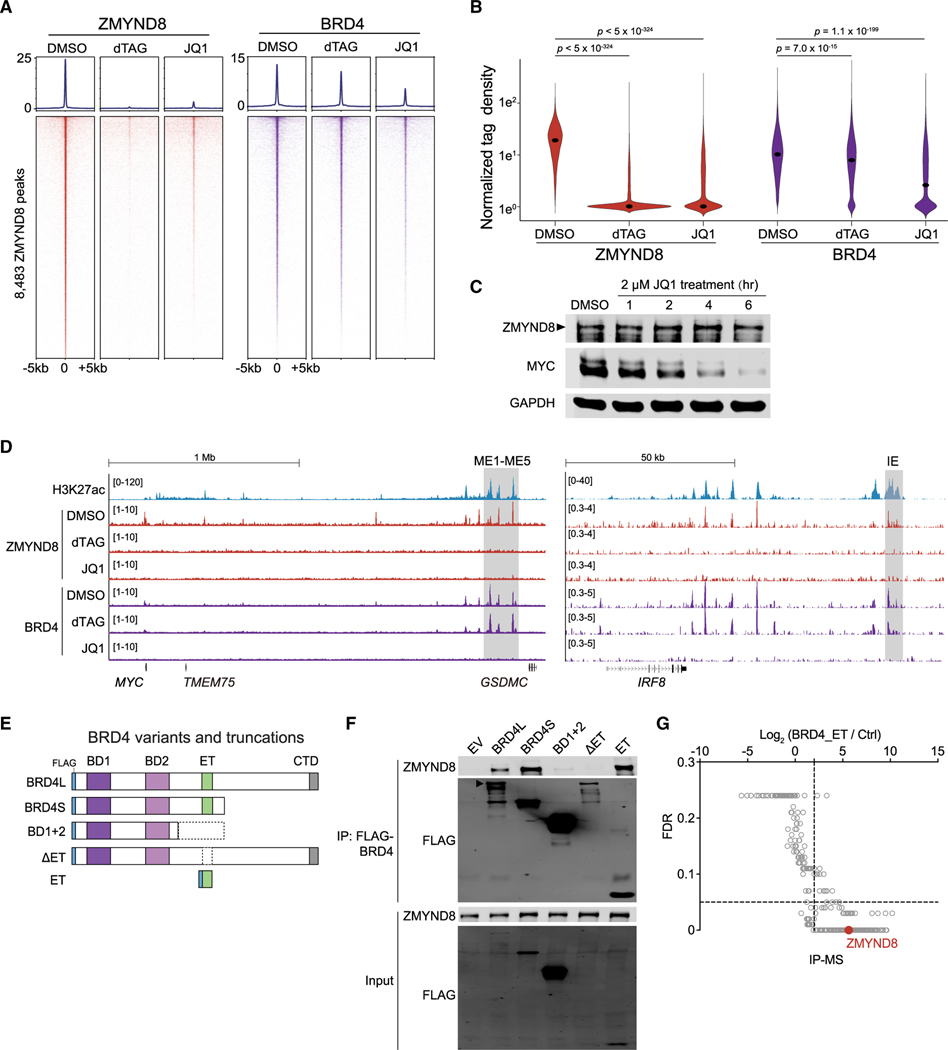
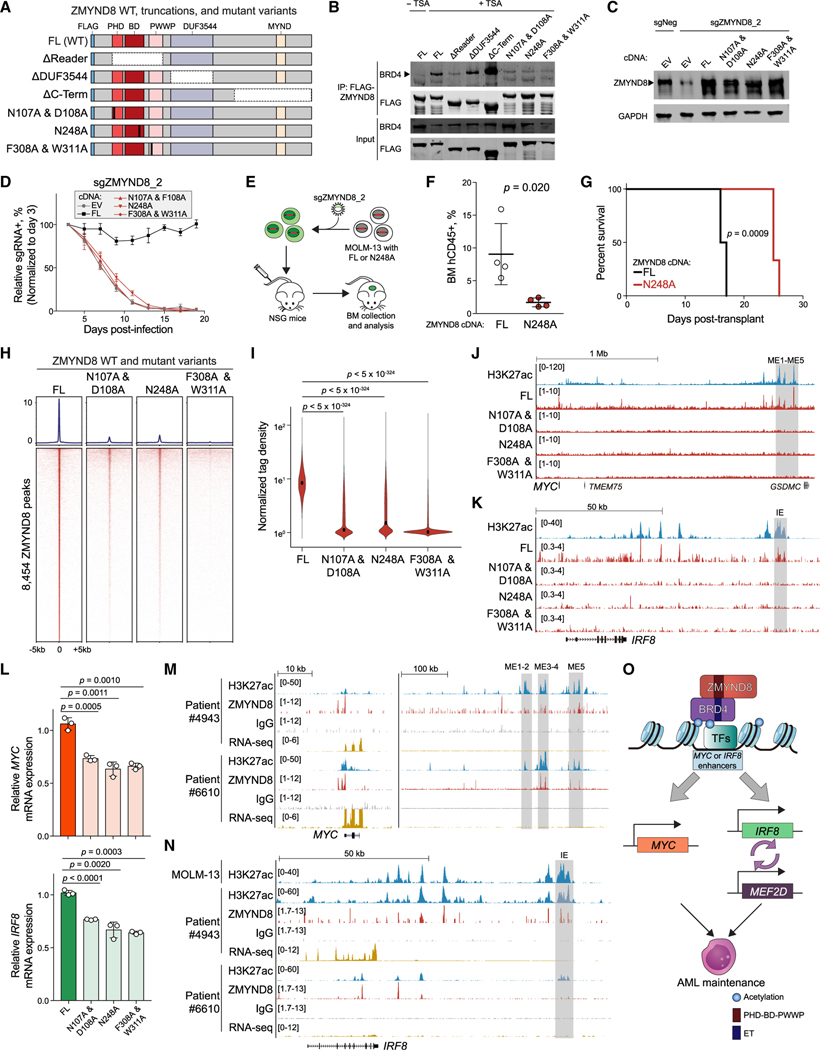
The transformed state in acute leukemia requires gene regulatory programs involving transcription factors and chromatin modulators. Here, we uncover an IRF8-MEF2D transcriptional circuit as an acute myeloid leukemia (AML)-biased dependency. We discover and characterize the mechanism by which the chromatin "reader" ZMYND8 directly activates IRF8 in parallel with the MYC proto-oncogene through their lineage-specific enhancers. ZMYND8 is essential for AML proliferation in vitro and in vivo and associates with MYC and IRF8 enhancer elements that we define in cell lines and in patient samples. ZMYND8 occupancy at IRF8 and MYC enhancers requires BRD4, a transcription coactivator also necessary for AML proliferation. We show that ZMYND8 binds to the ET domain of BRD4 via its chromatin reader cassette, which in turn is required for proper chromatin occupancy and maintenance of leukemic growth in vivo. Our results rationalize ZMYND8 as a potential therapeutic target for modulating essential transcriptional programs in AML.

Keywords: IRF8; MEF2D; ZMYND8; acute myeloid leukemia; epigenetics; transcriptional addiction.


Conflict of interest statement

Declaration of interests The authors declare no competing interests.

Figures

Figure 1.
Figure 1.. IRF8 is an AML-biased TF dependency
(A) Summary of TF-domain-focused CRISPR screens. Genes were ranked by AML-biased ES defined by the difference in a particular domain’s ES in AML versus in non-AML cell lines. CML, chronic myeloid leukemia. Data are from Lu et al. (2018). (B) Competition-based proliferation assays performed in indicated Cas9+ cell lines. sgRNA+ populations were monitored over time with a GFP co-expression marker. Plotted is the relative sgRNA+ population normalized to the day 3 sgRNA+ population over 21 days. sgNeg, negative control; sgCDK1, positive control. (C) Design of CRISPR-resistant IRF8 cDNA. Encoded amino acids are labeled in blue at the bottom of the cDNA sequence. (D) Vectors used for IRF8/dIRF8 cDNA complementation assay. IRF8*, sgIRF8_1-resistant IRF8 cDNA; dIRF8, degradable IRF8 that contains an additional FKBP12G36V domain and a 2×HA tag; Neo, neomycin resistance marker. (E) Immunoblotting of FKBP12G36V-tagged IRF8, IRF8, or GAPDH (loading control) in whole-cell lysates of MOLM-13 cells transduced with indicated vectors. (F) Competition-based proliferation assays performed in MOLM-13 Cas9+ cell lines stably expressing empty vector (EV), IRF8*, or dIRF8. sgPCNA, positive control. (G) Schematic depicting establishment of an inducible IRF8 degradation system in MOLM-13 cells. (H) Immunoblotting of whole-cell lysate of indicated cells treated with 500 nM dTAG-47 over time. (I) Competition-based proliferation assay of MOLM-13-dIRF8 versus parental cells treated with either DMSO or 500 nM dTAG-47. Plotted is the relative sgRNA+ population normalized to the day 0 sgRNA+ population. Data points of line graphs represent the average of three independent biological replicates (n = 3). Error bars represent mean ± SEM. See also Figure S1.
Figure 2.
Figure 2.. IRF8 is enriched at the MEF2D locus and modulates MEF2D expression
(A) RNA-seq analysis of gene expression changes in MOLM-13-dIRF8 cells treated with either DMSO or 500 nM of dTAG-47 for 4 h. Genes are ranked by log2 fold change (n = 3). (B) ESs of top 12 downregulated genes from DEPMAP dataset with log2 fold change less than —0.5 in IRF8-expressed (TPM > 1) AML cell lines (n = 12). Shown is a box and whisker plot of copy-number-adjusted ESs (CERES). TPM, transcripts per million reads. (C) Scatterplot of IRF8 and MEF2D essentiality scores in 33 human cancer cell lines extracted from Lu et al. (2018). IRF8hi cell lines are labeled. r, Pearson’s correlation coefficient. (D) RNA-seq analysis of gene expression changes in indicated cell lines transduced with sgIRF8 or sgNeg for 4 days. sgNeg and two independent sgRNAs targeting IRF8 are used (n = 2 biological replicates per sgRNA). Ranking position from the top most downregulated gene is indicated in parentheses. (E) GSEA rank plot of RNA-seq data presented in (D). The MEF2D signature is defined as the top 200 downregulated genes upon MEF2D depletion. Normalized enrichment score (NES) and false discovery rate (FDR) q value are shown. (F) Unbiased GSEA using all signatures from MSigDB v6.1 (Liberzon et al., 2015), together with the MEF2D signature for RNA-seq data presented in (D). Each gene set is represented as a single dot. The MEF2D signature is indicated in red, with numeral rank from the top most-enriched gene set in parentheses. (G) RNA-seq analysis of gene expression changes in MEF2D-depleted MOLM-13 cells 5 days after transduction of sgNeg or sgMEF2D. Two independent sgRNAs targeting either MEF2D or a negative control locus were used. MEF2D signature genes are indicated with a red box. (H) Metaplot (top) and density plot (bottom) showing enrichment of IRF8 and H3K27ac surrounding the 23,429 IRF8 ChIP-seq peaks at a ±5-kb interval in MOLM-13 cells. Peaks were ranked by IRF8 ChIP-seq tag counts. (I) Gene tracks of H3K27ac and IRF8 enrichment at the MEF2D locus in the indicated leukemia cell lines. H3K27ac and IRF8 ChIP-seq tracks in THP-1 cells are extracted from GSE123872. See also Figure S2 and Table S1.
Figure 3.
Figure 3.. CRISPR screens identify ZMYND8 as an AML-biased dependency
(A) Schematic showing the workflow of CRISPR dropout screen. (B) Summary of CR domain-focused CRISPR screens. Genes were ranked by AML-biased ES. A673 and HS-SY-II screening data were retrieved from Brien et al. (2018). (C) Correlated essentiality between IRF8 and 3,102 gene ESs from genome-wide CRISPR screens in leukemia cells (Wang et al., 2017). Pan-essential and nonessential genes are excluded. Remaining gene ESs were ranked by Pearson’s correlation coefficient to IRF8 ES. (D) Competition-based proliferation assays performed in indicated Cas9+ cell lines (n = 3). (E) Heatmap summarizing the competition-based proliferation assays performed as in Figure 3D (n = 3). (F) Schematic of in vivo transplantation of MOLM-13 cells infected with sgNeg or sgZMYND8_2. (G) Flow cytometry analysis of percentage of human CD45+ leukemia cells in BM of recipient mice sacrificed after 9 days post-transplantation (n = 4). Statistical analysis (p value) was performed using an unpaired Student’s t test. BM, bone marrow. (H) Kaplan-Meier survival curves of recipient mice transplanted with MOLM-13 cells transduced with sgNeg (n = 5) or sgZMYND8_2 (n = 6). The p value was determined by a log-rank Mantel-Cox test. (I) Colony formation of normal myeloid progenitor cells isolated from constitutively expressing Cas9 mice (n = 3). Statistical analysis was performed using a two-way ANOVA test. Error bars represent mean ± SEM. See also Figure S3 and Table S2.
Figure 4.
Figure 4.. ZMYND8 regulates IRF8 and MYC transcription to sustain AML proliferation
(A) Schematic depicting establishment of an inducible ZMYND8 degradation system in MOLM-13 cells. (B) Competition-based proliferation assay of MOLM-13-dZD8 versus parental cells. (C) RNA-seq analysis of gene expression changes in MOLM-13-dZD8 cells treated with either DMSO or 500 nM dTAG-13 for 4 h (n = 2). (D) Time-course reverse transcriptase quantitative PCR (RT-qPCR) analysis of mRNA expression in MOLM-13-dZD8 cells treated with 500 nM dTAG-47. Relative mRNA levels were normalized to GAPDH levels. (E) RNA-seq analysis of gene expression changes 5 days after transduction of sgNeg or sgZMYND8. Myeloid-differentiation-associated genes are labeled in blue. (F) Immunoblotting of ZMYND8, MYC, IRF8, or GAPDH in whole-cell lysates. (G) GSEA of RNA-seq data presented in Figure 4A. Myc_Targets_Up_Schuhmacher (Schuhmacher et al., 2001) and IRF8_Targets_Up or Myeloid_development_Up (Brown et al., 2006) signatures were used. (H) Competition-based proliferation assays performed in MOLM-13 cells expressing EV, MYC, IRF8, or MYC+IRF8 and transduced with indicated sgRNAs. EV, empty vector. Data points in line graphs represent the average of three independent biological replicates (n = 3). Error bars represent mean ± SEM. See also Figure S4 and Table S1.
Figure 5.
Figure 5.. Genome-wide binding profiles reveal the co-occupancy of ZMYND8 and BRD4 in active enhancer regions
(A) Meta-profile (top) and density plot (bottom) of CUT&RUN peaks at 13,125 ZMYND8-occupied regions in MOLM-13 cells. Peaks are ranked by ZMYND8 CUT&RUN tag counts. (B) Pie chart annotating the distribution of 13,125 ZMYND8 peaks in MOLM-13 cells. TTS, transcription termination site. Other, UTR and non-coding RNA regions. (C) ZMYND8 CUT&RUN-derived de novo motif analysis in MOLM-13 cells using HOMER. Statistical analysis (p value) was calculated using the binomial test. (D) Venn diagram displaying CUT&RUN peak overlap between ZMYND8, BRD4, and H3K27ac occupancy in MOLM-13 cells. (E) Gene tracks of H3K27ac, H3K14ac, BRD4, and ZMYND8 enrichment with 4C-seq analysis at leukemic MYC enhancer locus (ME1-ME5, gray box) in MOLM-13 cells. 4C-seq was performed using MYC promoter as the “viewpoint.” (F) Top: schematic of dCas9-KRAB-mediated epigenomic silencing. Locations of different sgRNAs targeting H3K27ac-enriched regions +23–86 kb from the IRF8 TSS are shown by red lines. Bottom: gene tracks of H3K27ac, H3K14ac, BRD4, and ZMYND8 enrichment in addition to 4C-seq analysis at the IRF8 locus in MOLM-13 cells. Putative IRF8 enhancer is labeled in a gray box. IE, IRF8 enhancer. (G) RT-qPCR analysis of mRNA expression of IRF8 in dCas9_KRAB+ MOLM-13 cells transduced with indicated sgRNAs in Figure 5F and harvested after 5 days post-infection. sgIRF8_TSS (purple) targets the IRF8 TSS region. Effective sgRNAs that induce >2-fold downregulation of IRF8 are labeled in green. Relative mRNA levels were normalized to GAPDH levels. sgNeg, negative control; TSS, transcription start site. Plotted are the mean ± SEM (n = 3). (H) Competition-based proliferation assays performed in dCas9_KRAB+ MOLM-13 cell lines. Cells were transduced with sgNeg (n = 4) or sgIRF8_TSS, sgIR-F8_enh-2, −3, −5, or −9 (n = 2). (I) Leukemic MYC enhancer (left, ME1-ME5, gray box) or IRF8 enhancer (right, IE, gray box) region in indicated cell lines. H3K27ac ChIP-seq data in THP-1, HEL, and HUH7 cells were extracted from GSE109493, GSE123872, or GSE89212. Error bars represent mean ± SEM. See also Figure S5.
Figure 6.
Figure 6.. ZMYND8 occupies active elements in AML through binding the ET domain of BRD4
(A) CUT&RUN meta-profile (top) and density plot (bottom) of ZMYND8 and BRD4 enrichment at 8,483 ZMYND8-occupied regions. Cells were treated with DMSO, 500 nM dTAG-47, or 2 μM JQ1 for 4 h. (B) Violin plot of normalized tag density of ZMYND8 (red) or BRD4 (purple) peaks in Figure 6A. Dots represent median values. p values were calculated by Welch’s two-sided t test. (C) Immunoblotting of MOLM-13-dZD8 whole-cell lysate treated with DMSO or 2 μM JQ1 over time. (D) Gene tracks of H3K27ac, ZMYND8, and BRD4 enrichment at the leukemic MYC (left, ME1-ME5, gray box) or IRF8 enhancers (right, IE, gray box) regions in cell populations described in Figure 6A. (E) Schematic of FLAG-tagged BRD4 variants and truncations used for coIP. (F) IP-immunoblotting of nuclear lysates prepared from HEK293T cells transfected with indicated vectors for 48 h. Arrowhead represents the expected BRD4-long isoform (BRD4L) band. (G) IP-MS analysis on nuclear lysates prepared from HEK293T cells transiently expressing the FLAG-ET domain or a streptavidin bead control. ZMYND8 peptide enrichment is labeled in red. Data were extracted from Lambert et al. (2019). See also Figure S6.
Figure 7.
Figure 7.. ZMYND8 PHD-BD-PWWP reader cassette is required for association with BRD4 on chromatin and leukemia growth
(A) Schematic of FLAG-tagged constructs used for coIP. FL, full-length. Vertical black bars represent mutagenized amino acid sites. (B) IP-immunoblotting of nuclear lysates prepared from HEK293T cells. TSA, trichostatin A. Arrowhead represents the expected BRD4 size. (n = 3). (C) Immunoblotting of nuclear lysates prepared from MOLM-13 cells stably expressing EV, FL, or mutated ZMYND8 cDNA and transduced with sgNeg or sgZMYND8_2. Arrowhead represents the expected ZMYND8 band. (D) Competition-based proliferation assays performed in MOLM-13 cells stably expressing the indicated cDNA and sgZMYND8_2 (n = 3). (E) Schematic of in vivo engraftment of MOLM-13 cells expressing FL or BD-mutated (N248A) ZMYND8. (F) Flow cytometry analysis of human CD45+ leukemia cells in BM of recipient mice (n = 4). Statistical analysis was performed using unpaired Student’s t test. BM, bone marrow. (G) Kaplan-Meier survival curves of recipient mice transplanted with MOLM-13 cells expressing WT or BD-mutated (N248A) ZMYND8 and transduced with sgNeg or sgZMYND8_2 (n = 6). p value determined by a log-rank Mantel-Cox test. (H) CUT&RUN meta-profile (top) and density plot (bottom) of ZMYND8 enrichment at 8,454 FL-ZMYND8-occupied regions in MOLM-13 cells. MOLM-13 cells stably expressing FL or mutated ZMYND8 were transduced with sgZMYND8_2 and collected 5 days post-infection. (I) Violin plot of normalized tag density of ZMYND8 peaks in (H). Black dots represent median values. p values were calculated by Welch’s two-sided t test. (J and K) Gene tracks of ZMYND8 enrichment at the leukemic MYC (J) or IRF8 (K) enhancer regions in cells described in (H). Enhancer regions are shown in gray boxes. (L) RT-qPCR analysis of mRNA expression of MYC (top) or IRF8 (bottom) in cells described in (H) (n = 3). (M and N) Gene track of H3K27ac and ZMYND8 enrichment at MYC (M) and IRF8 (N) regions in two primary AML patient blasts. RNA-seq data are also shown. (O) Model of how ZMYND8 regulates the IRF8-MEF2D and MYC axis in AML. Error bars represent mean ± SEM. See also Figure S7.

Comment in

References

    1. Anders S, Pyl PT, and Huber W (2015). HTSeq–a Python framework to work with high-throughput sequencing data. Bioinformatics 31, 166–169. - PMC - PubMed
    1. Anfossi G, Gewirtz AM, and Calabretta B (1989). An oligomer complementary to c-myb-encoded mRNA inhibits proliferation of human myeloid leukemia cell lines. Proc. Natl. Acad. Sci. USA 86, 3379–3383. - PMC - PubMed
    1. Bahr C, von Paleske L, Uslu VV, Remeseiro S, Takayama N, Ng SW, Murison A, Langenfeld K, Petretich M, Scognamiglio R, et al. (2018). A Myc enhancer cluster regulates normal and leukaemic haematopoietic stem cell hierarchies. Nature 553, 515–520. - PubMed
    1. Barretina J, Caponigro G, Stransky N, Venkatesan K, Margolin AA, Kim S, Wilson CJ, Leha r, J., Kryukov GV, Sonkin D, et al. (2012). The Cancer Cell Line Encyclopedia enables predictive modelling of anticancer drug sensitivity. Nature 483, 603–607. - PMC - PubMed
    1. Basu M, Sengupta I, Khan MW, Srivastava DK, Chakrabarti P, Roy S, and Das C (2017a). Dual histone reader ZMYND8 inhibits cancer cell invasion by positively regulating epithelial genes. Biochem. J 474, 1919–1934. - PubMed

Publication types

MeSH terms