Review
. 2021 Aug 5;184(16):4115-4136.
doi: 10.1016/j.cell.2021.07.009.

Basic principles of hydrogel-based tissue transformation technologies and their applications

Affiliations
Review

Basic principles of hydrogel-based tissue transformation technologies and their applications

Seo Woo Choi et al. Cell. .

Abstract

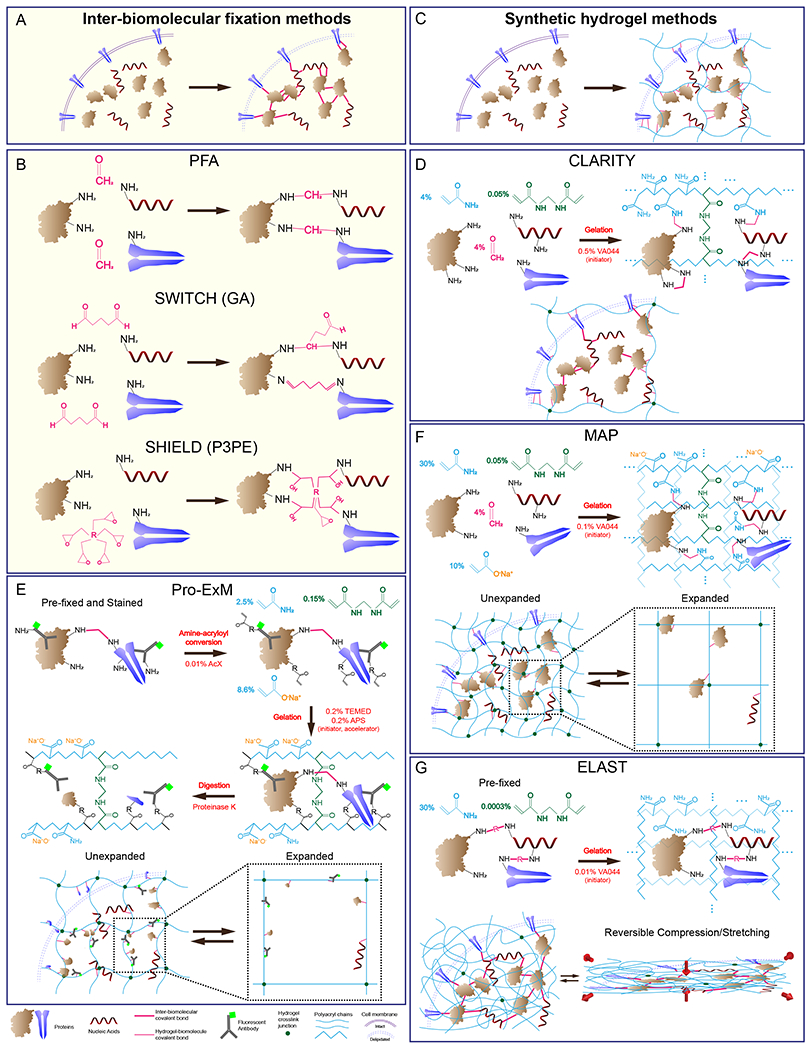
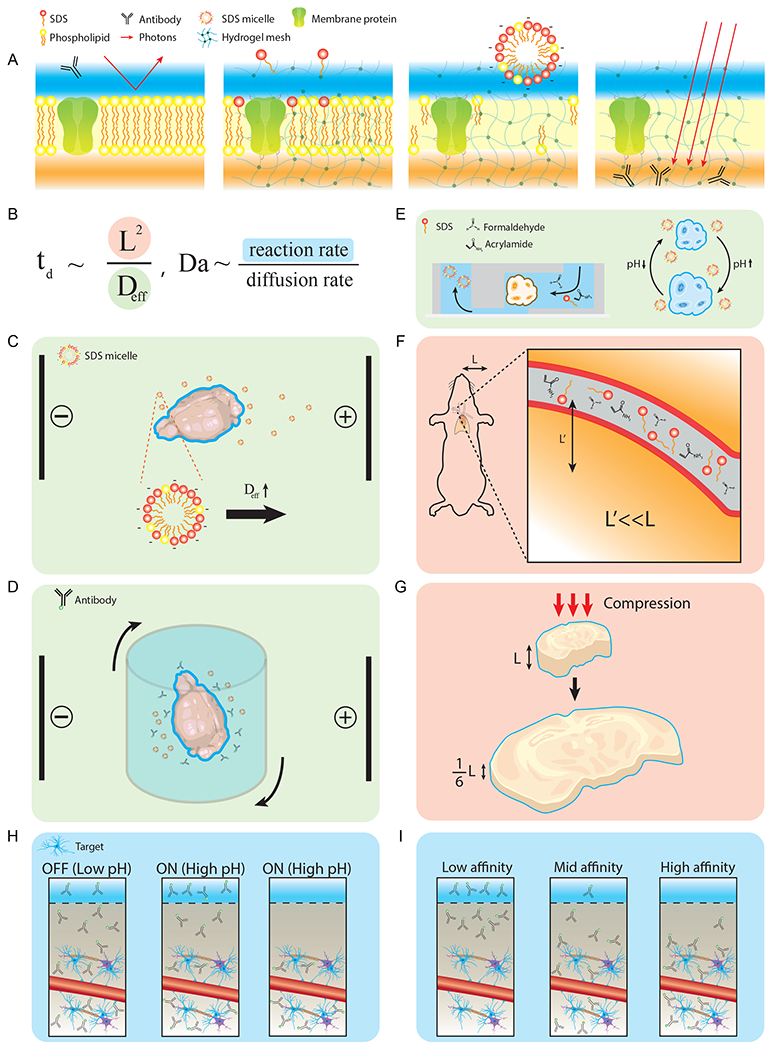
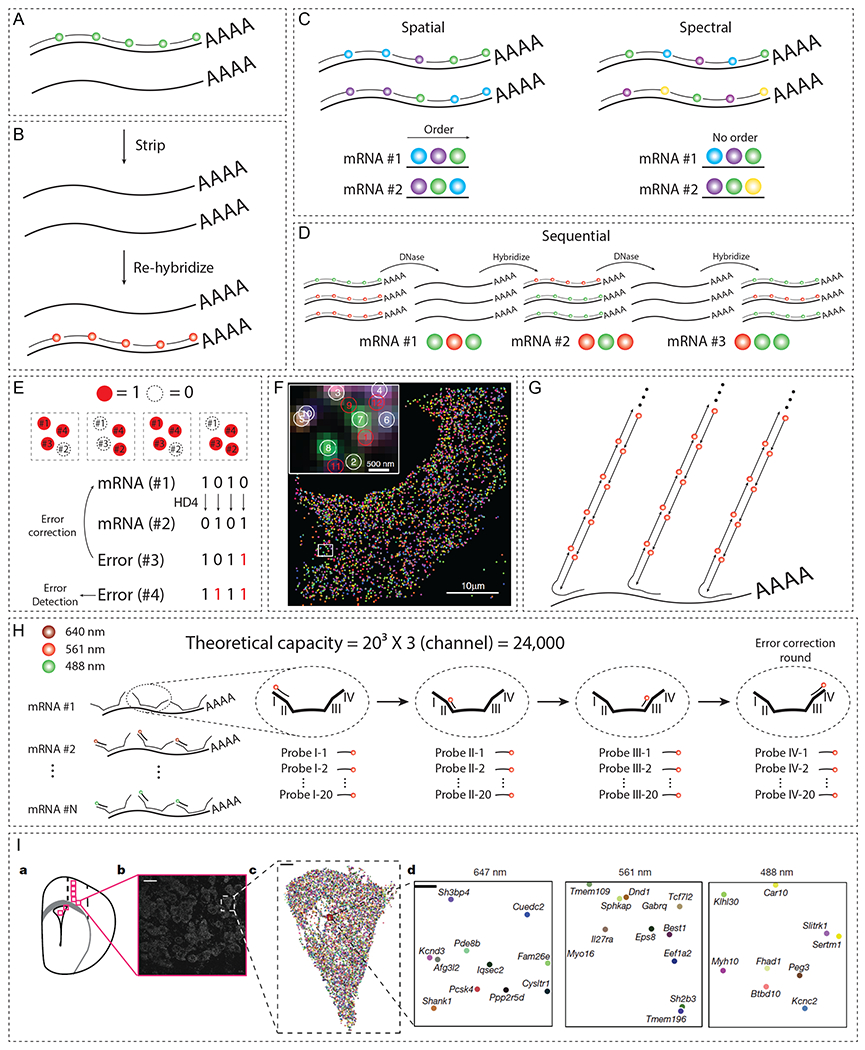
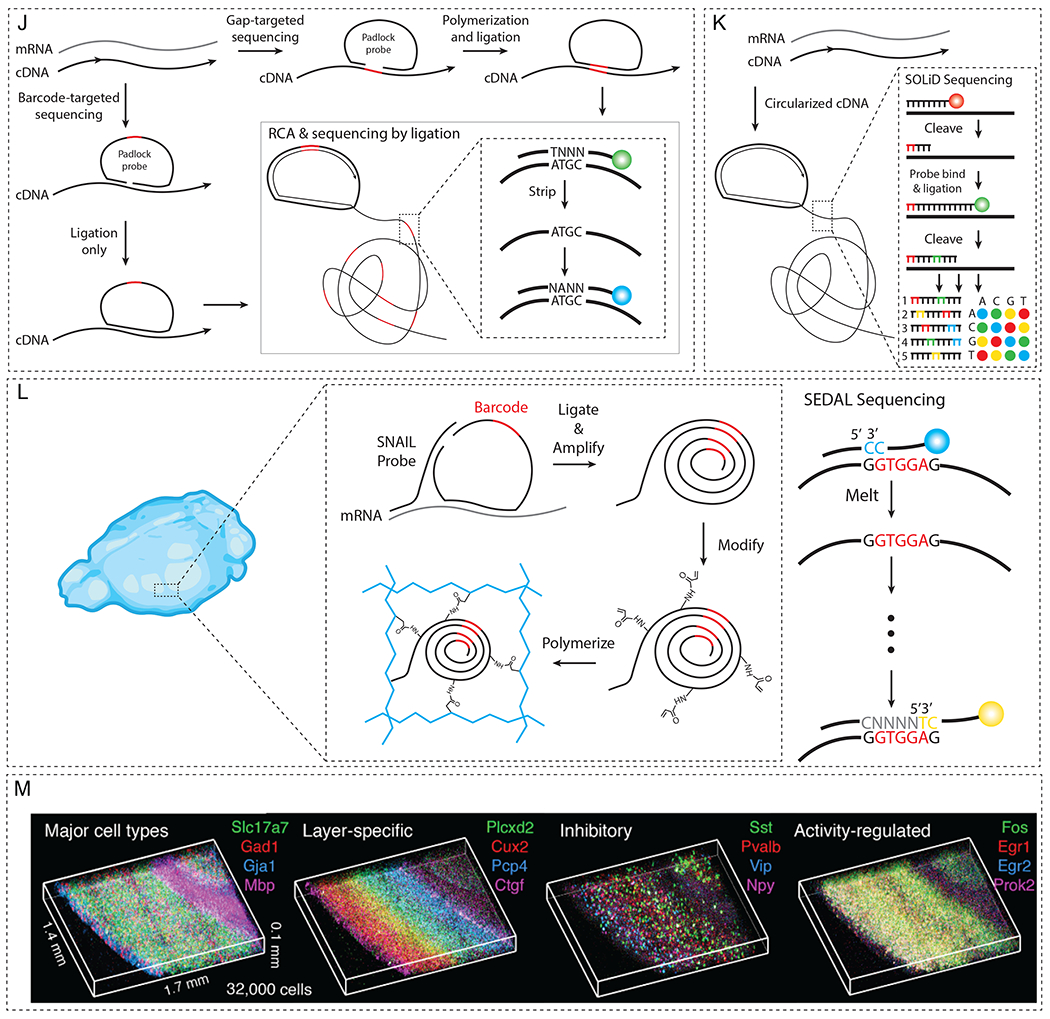
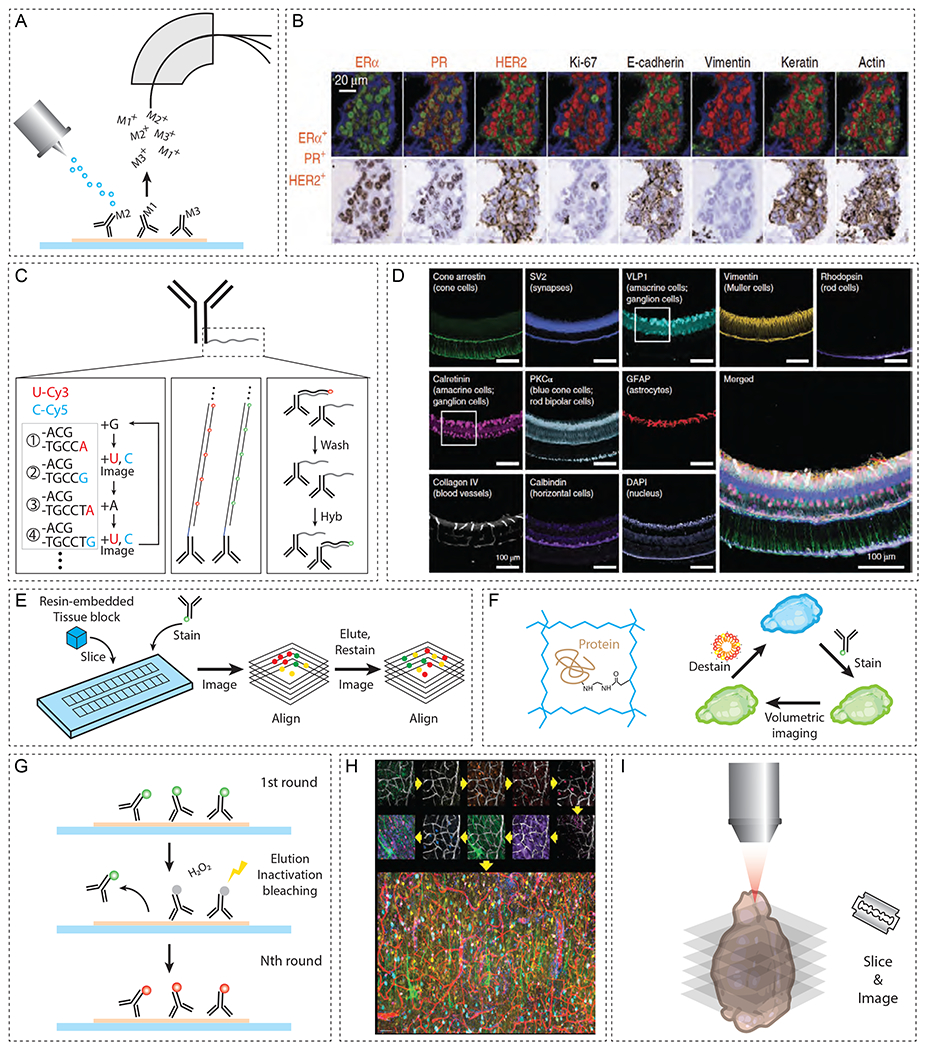
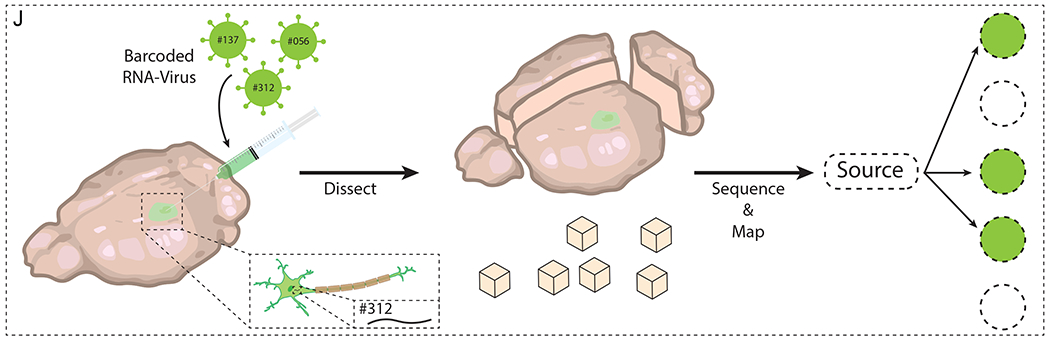
Emerging tissue transformation technologies provide an unprecedented opportunity to investigate system-level molecular and anatomical features in situ. Hydrogel-based methods engineer physicochemical tissue properties to render intact organs optically transparent and size and shape adjustable while preserving biomolecules at their physiological locations. When combined with advanced molecular tools, labeling, and imaging techniques, tissue transformation enables three-dimensional (3D) mapping of molecules, cells, and their interrelationships at increasing speeds and resolutions. In this review, we discuss the basic engineering principles of tissue transformation and labeling techniques as well as their broad applications, current challenges, and future potential.


Conflict of interest statement

Declaration of interests The authors declare no competing interests.

Figures

Figure 1.
Figure 1.. Multi-scale molecular and structural interrogation enabled by tissue-hydrogel transformation.
The gray bars below show the scales covered by hydrogel-based tissue transformation technologies. (A) Whole-organ scale. (B) Neural circuits and inter-regional connectivity. (C) Tissue micro-environment. (D) Single cell. (E) Subcellular and nanoscopic architectures.
Figure 2.
Figure 2.. Overview of common tissue-hydrogel techniques.
(A) Inter-biomolecular-fixation-based methods use covalently linked inter- and intra-molecular biomolecule meshes. (B) Schematics of PFA, GA, and P3PE fixation chemistries. (C) Synthetic-hydrogel-based techniques generate external polymeric meshes to which biomolecules are anchored. (D) CLARITY uses PFA and 4% acrylamide to covalently crosslink biomolecules to each other and to the pAAm mesh. (E) In Pro-ExM, PFA-fixed and antibody-stained biomolecules undergo amine-acryloyl conversion to enable their covalent anchoring to a polymeric mesh. This is followed by protease digestion to produce isotropic expansion in DI water. (F) MAP uses PFA and a dense heteropolymer composed of high acrylamide and sodium acrylate monomeric units to promote covalent crosslinking of biomolecules exclusively to the mesh (and not to each other), allowing isotropic expansion in DI water. (G) In ELAST, high acrylamide, and low crosslinker and initiator are used without PFA to physically entangle a pre-fixed tissue with a dense pAAm mesh that enables reversible compression and stretching.
Figure 3.
Figure 3.. Optimization of tissue-gel properties.
(A) Qualitative trends of four criteria for optimizing tissue-gel properties as well as their dependence on five experimental parameters. (B) GFP signal retention after 70°C, 24h SDS treatment. SHIELD (P3PE) outperforms other methods (adapted with permission from Y. Park et al., 2018). (C) GFP signal retention is worse in harsher delipidation conditions, but higher degree of delipidation offers better permeability and transparency (adapted with permission from Y. Park et al., 2018). (D) Stress-relaxation curves for three regimes. Strong but brittle materials can withstand high stress but fracture at low strains (orange), while ductile materials are permanently deformed after small stresses (red). Tough tissue-gels can withstand high strain and stress (green). (E) Rigidity is a measure of strength, which is desirable in tissue-hydrogels (adapted with permission from Y. Park et al., 2018). (F) Low crosslinker (Bis) concentration confers high compressibility and toughness to pAAm gels by encouraging more chain entanglement (adapted with permission from Ku et al., 2020). (G) A graph showing pre-expansion vs. post-expansion effective monomer density. High pre-expansion monomer density does not necessarily correlate with high post-expansion gel density (i.e., low permeability) due to hydrogel expansion (H) A graph showing monomer:crosslinker ratios for each hydrogel-based technique (Blue: expansion-based, Green: CLARITY-based, Magenta: physical entanglement-based). (I)-(K) Factors that influence expansion ratios of tissue-hydrogels. (I) Πel is the elastic pressure contribution to overall swelling pressure. High delipidation/digestion, low crosslinker %, low fixation strength (bottom) results in higher Πel (elastic pressure) and swelling. (J) Low monomer % (top) yields lower Πmix (polymer-solvent mixing) than high monomer % (bottom), resulting in lower expansion. (K) Higher concentration of fixed charges (bottom, i.e., sodium acrylate) results in higher Πion (ion exchange osmotic pressure) and more expansion.
Figure 4.
Figure 4.. Basic principles of tissue clearing and molecular deliveries.
(A) A schematic of the delipidation process and the molecular preservation by hydrogel-based techniques. (B) Diffusion time scale, td, is proportional to the characteristic length (L) squared and inversely proportional to the effective diffusivity (Deff). Damköhler number, Da, dictates the relationship between the reaction rate and the diffusion rate. (C) CLARITY increases the value of Deff by applying an electric field on thick tissues for active delipidation. (D) Stochastic electrotransport applies a rotational electric field to selectively accelerate highly electromobile species (micelles/antibodies). (E) Use of convective flow and osmotic pumping to increase Deff in delivering CLARITY solution. (F) Repurposing of existing vasculature to deliver fixatives and detergents by effective reduction of the characteristic length (L’≪L). (G) Reversibly compressible tissue-gel hybrid by ELAST to modify the characteristic length scale. (H) SWITCH overcomes fast reaction time scales by suppressing reactions at low pH and by triggering reactions at physiological pH. (I) In eFLASH, a gradual modulation of antibody affinity allows steady change of Da, improving scalability over SWITCH.
Figure 5.
Figure 5.. Overview of spatial transcriptome analysis.
(A) smFISH hybridizes multiple fluorescently labeled DNA probes to the target mRNA. (B) FISH probes can be repeatedly hybridized and stripped off for the multiplexed detection of RNA molecules. (C) Spatial (left) and spectral (right) barcoding schemes that allow exponential increase in the number of targets with a given set of fluorophores. (D) A schematic of sequential barcoding, relying on multiple rounds of hybridization. (E) Concept of MERFISH to decrease the error rates by utilizing HD4 coding scheme. (F) Simultaneous measurements of 1,001 RNA species in single cells using MERFISH (adapted with permission from K. H. Chen et al., 2015). (G) HCR amplification for improving SNR. (H) Schematic of SeqFISH+, which extends multiplexing capacity to ~104. (I) SeqFISH+ detecting 9,418 mRNAs in a single cell (adapted with permission from Eng et al., 2019). (J) Schematic of in situ sequencing, in which target mRNA is reverse transcribed to cDNA using padlock probes and amplified via RCA. (K) FISSEQ circularizes cDNA into an amplicon, allowing untargeted analyses of mRNA profiles. (L) STARmap co-polymerizes DNA nanoballs into a hydrogel mesh, preserving the spatial information of the mRNA sequence. (M) STARmap on 100-μm-thick mouse visual cortex (adapted with permission from X. Wang et al., 2018).
Figure 6.
Figure 6.. Overview of spatial proteome and connectome analysis.
(A) MS-based multiplexing of antibody signals by tagging each antibody with different metals. (B) MIBI of patient FFPE tissue sections (adapted with permission from Angelo et al., 2014). (C) Antibodies can be tagged with oligonucleotide barcode sequences for multiplexing. (D) Immuno-SABER on 40-μm-thick mouse retina labeling ten different targets (adapted with permission from Saka et al., 2019). (E) Array tomography images of serially sectioned, resin-embedded bulk tissue to reconstruct a volumetric dataset. (F) CLARITY embeds tissues into a hydrogel mesh, reinforcing mechanical/chemical stability to allow delipidation, multi-round labeling, and volumetric imaging. (G) Repeated cycles of antibody staining with various methods of antibody removal (photobleaching, fluorophore inactivation, and physical elution). (H) Multi-round antibody staining and lectin-based co-registration in SWITCH (adapted from Murray et al., 2015). (I) Basic principle behind connectome approach relying on serial imaging of sliced planes. (J) MAPseq-based methods to multiplex connectomic analysis. Barcoded mRNAs are injected into the volumetric sample, which is then dissected and sequenced in a region-specific manner to reveal the projectome.

Similar articles

Cited by

References

    1. Alon S, Goodwin DR, Sinha A, Wassie AT, Chen F, Daugharthy ER, Bando Y, Kajita A, Xue AG, Marrett K, Prior R, Cui Y, Payne AC, Yao CC, Suk HJ, Wang R, Yu CC, Tillberg P, Reginato P, … Boyden ES (2021). Expansion sequencing: Spatially precise in situ transcriptomics in intact biological systems. Science, 371(6528). 10.1126/science.aax2656 - DOI - PMC - PubMed
    1. Angelo M, Bendall SC, Finck R, Hale MB, Hitzman C, Borowsky AD, Levenson RM, Lowe JB, Liu SD, Zhao S, Natkunam Y, & Nolan GP (2014). Multiplexed ion beam imaging of human breast tumors. Nature Medicine, 20(4), 436–442. 10.1038/nm.3488 - DOI - PMC - PubMed
    1. Belle M, Godefroy D, Couly G, Malone SA, Collier F, Giacobini P, & Chédotal A (2017). Tridimensional Visualization and Analysis of Early Human Development. Cell, 169(1), 161–173.e12. 10.1016/j.cell.2017.03.008 - DOI - PubMed
    1. Bolin FP, Preuss LE, Taylor RC, & Ference RJ (1989). Refractive index of some mammalian tissues using a fiber optic cladding method. 28(12), 2297–2303. - PubMed
    1. Chang JB, Chen F, Yoon YG, Jung EE, Babcock H, Kang JS, Asano S, Suk HJ, Pak N, Tillberg PW, Wassie AT, Cai D, & Boyden ES (2017). Iterative expansion microscopy. Nature Methods, 14(6), 593–599. 10.1038/nmeth.4261 - DOI - PMC - PubMed

Publication types

LinkOut - more resources