. 2021 Aug 5;184(16):4348-4371.e40.
doi: 10.1016/j.cell.2021.07.016.

A proteogenomic portrait of lung squamous cell carcinoma

Shankha Satpathy  1 Karsten Krug  2 Pierre M Jean Beltran  2 Sara R Savage  3 Francesca Petralia  4 Chandan Kumar-Sinha  5 Yongchao Dou  3 Boris Reva  4 M Harry Kane  2 Shayan C Avanessian  2 Suhas V Vasaikar  6 Azra Krek  4 Jonathan T Lei  3 Eric J Jaehnig  3 Tatiana Omelchenko  7 Yifat Geffen  2 Erik J Bergstrom  2 Vasileios Stathias  8 Karen E Christianson  2 David I Heiman  2 Marcin P Cieslik  9 Song Cao  10 Xiaoyu Song  11 Jiayi Ji  11 Wenke Liu  12 Kai Li  3 Bo Wen  3 Yize Li  10 Zeynep H Gümüş  4 Myvizhi Esai Selvan  4 Rama Soundararajan  6 Tanvi H Visal  6 Maria G Raso  6 Edwin Roger Parra  6 Özgün Babur  13 Pankaj Vats  5 Shankara Anand  2 Tobias Schraink  14 MacIntosh Cornwell  14 Fernanda Martins Rodrigues  10 Houxiang Zhu  10 Chia-Kuei Mo  10 Yuping Zhang  5 Felipe da Veiga Leprevost  5 Chen Huang  3 Arul M Chinnaiyan  5 Matthew A Wyczalkowski  10 Gilbert S Omenn  15 Chelsea J Newton  16 Stephan Schurer  8 Kelly V Ruggles  14 David Fenyö  12 Scott D Jewell  16 Mathangi Thiagarajan  17 Mehdi Mesri  18 Henry Rodriguez  18 Sendurai A Mani  6 Namrata D Udeshi  2 Gad Getz  2 James Suh  17 Qing Kay Li  19 Galen Hostetter  16 Paul K Paik  7 Saravana M Dhanasekaran  5 Ramaswamy Govindan  10 Li Ding  10 Ana I Robles  18 Karl R Clauser  2 Alexey I Nesvizhskii  9 Pei Wang  4 Steven A Carr  20 Bing Zhang  21 D R Mani  22 Michael A Gillette  23 Clinical Proteomic Tumor Analysis Consortium
Collaborators, Affiliations

A proteogenomic portrait of lung squamous cell carcinoma

Shankha Satpathy et al. Cell. .

Abstract

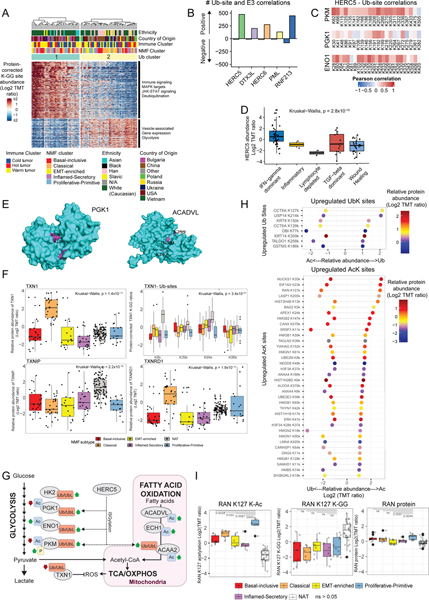
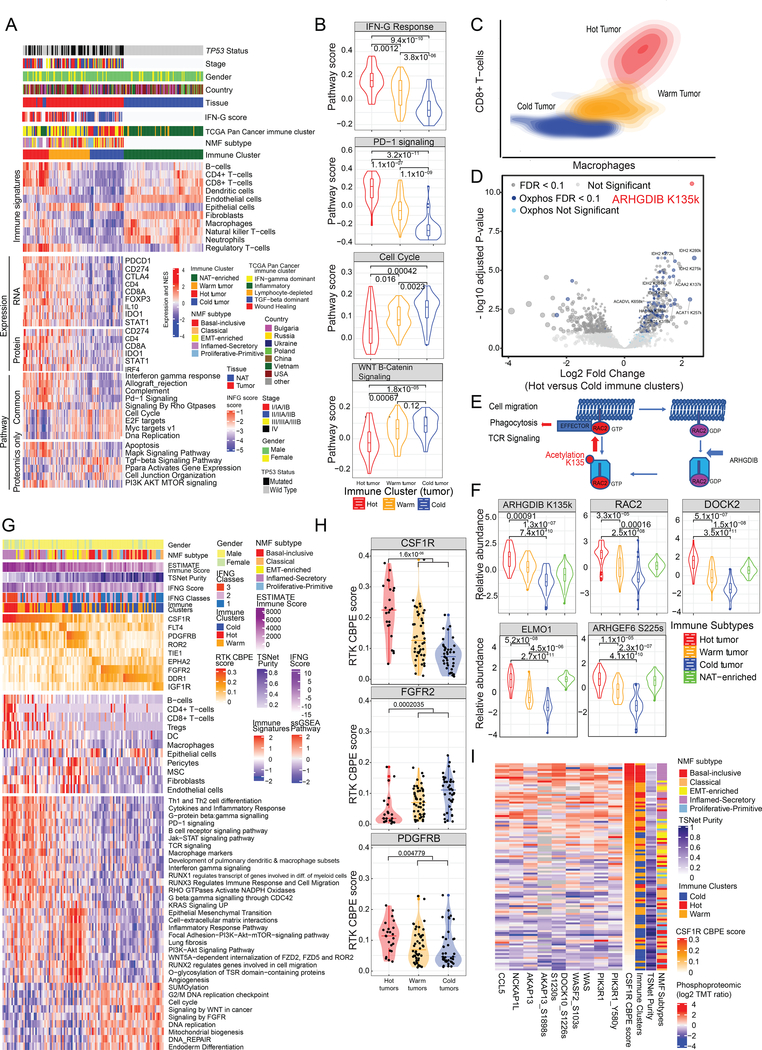
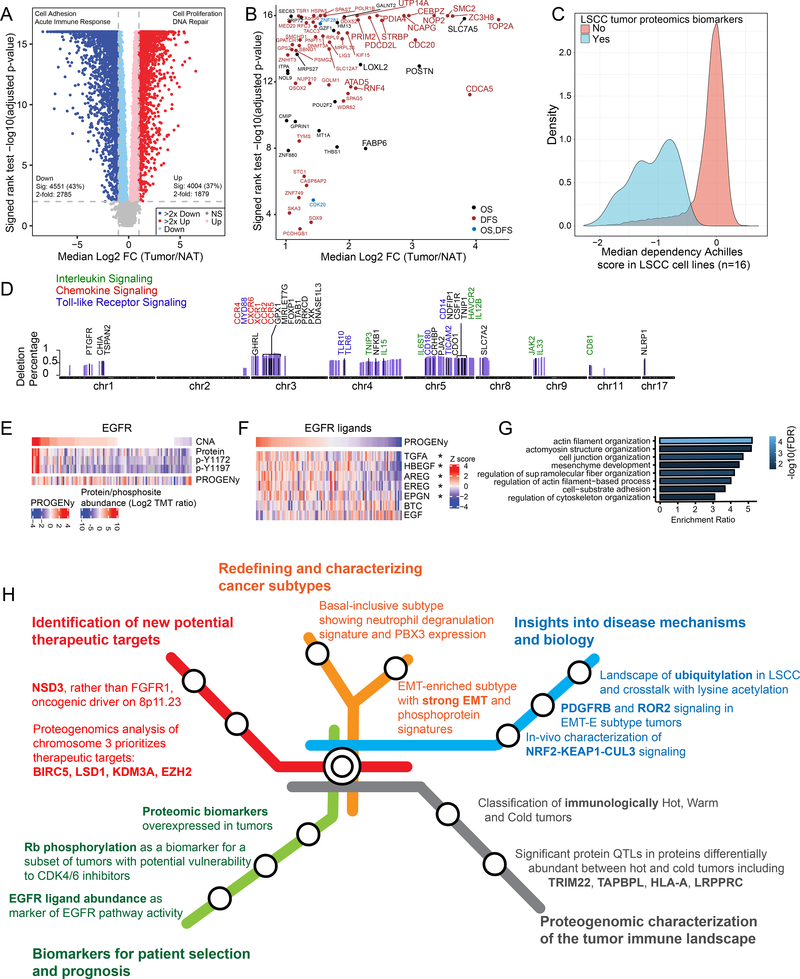
Lung squamous cell carcinoma (LSCC) remains a leading cause of cancer death with few therapeutic options. We characterized the proteogenomic landscape of LSCC, providing a deeper exposition of LSCC biology with potential therapeutic implications. We identify NSD3 as an alternative driver in FGFR1-amplified tumors and low-p63 tumors overexpressing the therapeutic target survivin. SOX2 is considered undruggable, but our analyses provide rationale for exploring chromatin modifiers such as LSD1 and EZH2 to target SOX2-overexpressing tumors. Our data support complex regulation of metabolic pathways by crosstalk between post-translational modifications including ubiquitylation. Numerous immune-related proteogenomic observations suggest directions for further investigation. Proteogenomic dissection of CDKN2A mutations argue for more nuanced assessment of RB1 protein expression and phosphorylation before declaring CDK4/6 inhibition unsuccessful. Finally, triangulation between LSCC, LUAD, and HNSCC identified both unique and common therapeutic vulnerabilities. These observations and proteogenomics data resources may guide research into the biology and treatment of LSCC.

Keywords: CPTAC; acetylation; genomics; lung cancer; phosphorylation; protein; proteogenomics; proteomics; squamous; ubiquitylation.


Conflict of interest statement

Declaration of interests The authors declare no competing interests.

Figures

Figure 1:
Figure 1:. Proteogenomic Landscape of LSCC
A. Schematic showing the number of tumors and NATs profiled and the various data types generated in this study. The lower panel represents data completeness. WGS: Whole Genome Sequencing, WES: Whole Exome Sequencing. CNA: copy number alteration. DNAme: DNA methylation. pSTY: phosphoproteome. Ac: acetylproteome. Ub: ubiquitylproteome. B. Stacked histograms indicating the distribution of patient phenotypes. Smoking History reflects self-report. C. Co-occuring mutation plot indicating cancer-relevant genes. MutSig-based significantly mutated genes (SMGs, q-value < 0.1) in this dataset are highlighted in red font. D. Heatmaps showing correlation between copy number alterations (CNA) and RNA (left) or proteomics (right). Red and green events represent significant (FDR <0.01) positive and negative correlations, respectively. E. Flow chart for identification of cancer-associated genes (CAGs) that showed GISTIC-based focal amplification or deletion (q<0.25) and cis-effects in both mRNA and protein (FDR<0.05). F. Differential protein expression (Log2 fold-change (FC)) in tumors with and without high-level amplification of the FGFR1 gene (GISTIC thresholded value =2). G. Genes whose DNA methylation was significantly associated with cascading cis regulation of their cognate mRNA expression, protein level, phosphopeptide and acetylpeptide abundance. Shapes indicate the cis-effects across the indicated datasets. Named genes also showed differential expression between tumors and NATs. See also Figure S1 and Table S1–3
Figure 2:
Figure 2:. LSCC Molecular Subtypes and Associations
A. NMF-based clustering of tumor CNA, RNA, protein, phosphosite and acetylsite profiles, showing five primary NMF subtypes (top sample annotation row). B. Heatmap representing significantly enriched pathways (MSigDB Hallmark) in five multi-omic subtypes. C. Kaplan-Meier plot comparing survival probability of patients whose tumors were core members of a specific NMF subtype (NMF Core) to those whose tumors had characteristics of more than one NMF subtype (NMF mixed). D. Heatmap showing relative overexpression of mesenchymal proteins in the EMT-E subtype compared to others. E. Correlation between ssGSEA-based enrichment of EMT (Hallmark genesets) and fibroblast proliferation (GO: Gene Ontology) genesets (Pearson correlation=0.65, p=2.8×10⁻¹⁴). F. Distribution of RTK correlation-based phosphosite enrichment (RTK CBPE) scores for PDGFRB and ROR2 across the five NMF subtypes. Wilcoxon p values for CBPE scores in EMT-E vs other subtypes are 1.5×10⁻⁶ for PDGFRB and 2.7×10⁻⁷ for ROR2. G. Proteins and phosphosites significantly associated with PDGFRB or ROR2 CBPE scores, known to play a role in EMT and extracellular matrix reorganization. The left panel shows Spearman correlation between PDGFRB CBPE scores and protein/phosphosite abundance profiles. See also Figure S2 and Table S1–4
Figure 3:
Figure 3:. Impact of Somatic Mutations on Proteogenomic Features
A. Significant (Wilcoxon FDR<0.05) cis- (circles) and trans-effects (squares) of selected mutations (x axis) on the expression of cancer-associated gene products, with mRNA in blue and proteins in green. B. Similar to panel A but showing phosphosites. C. Similar to panel A but showing acetylsites. D. Similar to panel A but showing ubiquitylsites. E. CNA data for CDKN2A and RB1 was used to classify tumors as having homozygous deletions or three classes of loss of heterozygosity mutations: nonsense/frameshift indel, missense/inframe indel, and splicing (see Table S4). CDKN2A genetic and hypermethylation annotations were based on the effect of the aberration on the p16INK4a (p16) gene product, but the effects of these CDKN2A/p16 aberrations on both major isoforms (p16INK4a and p14ARF (p14)) at the RNA (barplot) and protein (heatmap directly below barplot) levels are shown. Samples with amplification of CCND1–3, CDK4, and CDK6 were assessed by GISTIC (threshold = 2), and the genomic status, protein, and phosphoprotein levels for RB1 are included. Also shown are RNA-based scores for the cell cycle (MGPS, the mean of cell cycle genes and E2F target and G2M checkpoint gene set scores derived from ssGSEA of Hallmark gene sets) and phosphosite-based CDK kinase activity scores for CDKs 1, 2, and 4 derived from single sample post translational modifications - signature enrichment analysis (ssPTM-SEA) of known kinase targets. Three tumors with copy number gain of CDKN2A are not included. F. Correlation between differential regulation of protein abundance (Log2 Fold-change (FC)) versus phosphoprotein log2 FC in tumors with NRF2 pathway mutation (one or two mutations in KEAP1, CUL3, or NFE2L2) versus NRF2 WT tumors (no NRF2 pathway aberration). G. NRF2 pathway score and RNA, protein and phosphoprotein expression of key NRF pathway members according to NMF subtype. H. CDK5 protein expression (Log2 TMT ratio) by NMF subtype. P-values are from the Anova test. I. PTM-SEA-derived normalized enrichment scores (NES) for pathways enriched in NRF2 pathway-mutated (Mutant) vs wild-type samples (WT) plotted against NES for pathways enriched in NMF Classical vs other subtypes. Significantly upregulated (FDR<0.05) PTM-SEA terms in the Classical subtype are indicated by red dots and labeled. See also Figure S3 and Table S4
Figure 4:
Figure 4:. Proteogenomic Impact of Chromosome 3q Amplification
A. Differential protein expression (Log2 FC) between tumors and NATs for genes on chromosome arm 3q. B. Frequency distribution of ΔNp63α RNA expression in tumors and NATs. C. Differential protein expression in samples classified as ΔNp63α-low vs -high based on ΔNp63α transcript level. The outlier upregulated gene product in red is BIRC5, also known as survivin. D. Differential expression of microRNAs in ΔNp63α-low vs -high samples. E. Pearson correlation between expression of miR-205 and mRNA expression of its cognate, experimentally validated targets. F. Pearson correlation between expression of miR-205 and protein abundance of its cognate targets. G. Relationship between miR-205 expression (log2 TPM) and EMT (top, p=2.3×10−08, Correlation = −0.53) and DNA replication (bottom, p=1.1×10−06, Correlation= 0.47) scores. H. Heatmap showing relative protein expression (TMT log ratio) of selected proteins with significant (FDR<0.01) Pearson correlation values (positive or negative) with SOX2 protein expression. I. Pearson correlation (p= 5.2×10−07, Correlation = −0.46) between SOX2 protein expression and HALLMARK_IL6_JAK-STAT_signaling NES. See also Figure S4 and Table S4
Figure 5:
Figure 5:. Ubiquitylation landscape in LSCC
A. Consensus clustering of protein ratio-corrected K-GG (di-glycine) site abundances in tumor samples and their associations. Heatmap shows only protein ratio-corrected K-GG sites with differential abundance across clusters (FDR<0.01). Enriched pathways and molecular and clinical annotations are indicated. B. Number of K-GG sites showing significant correlations (FDR< 0.01) with E3 ligases. Shown are the five E3 ligases with the highest proportion of positive correlations. C. Pearson correlations between HERC5 protein expression and K-GG site protein-corrected abundance in key glycolytic enzymes PKM, PGK1, and ENO1. D. HERC5 protein expression (log2 TMT ratio) with samples grouped by immune subtype. Significant (Kruskal−Wallis, p = 2.8×10−05) association is seen between HERC5 abundance and immune subtypes. E. Representative examples of significant spatial clustering of lysine acetylsites (purple) on PGK1 (left) and ACADVL (right) protein 3-D structure space-filling models (cyan) as determined by PTM CLUMPS. (PGK1 structure = PDB ID:3ZOZ. ACADVL structure = PDB ID:3B9). F. TXN protein levels in the NMF Classical subtype relative to NATs and other NMF subtypes (top left). Protein-corrected ubiquitylation (K-GG) sites are decreased on TXN1 in tumor subtypes relative to NATs (top right). TXNIP is decreased in tumor subtypes relative to NATs (lower left). TXN1 activator TXNRD1 is increased in the Classical subtype relative to NATs and other NMF subtypes (lower right). Kruskal−Wallis p-values are indicated in the respective plots. G. Schematic representation of PTM-based modulation in LSCC tumors showing key enzymes in the metabolic and reactive oxygen species (ROS) pathways. Green and red arrows indicate higher and lower abundance of the corresponding PTMs in tumors. Putative ISGylation targets of HERC5 are indicated by dotted lines. A known regulatory PKM phosphosite observed to be modulated in LSCC tumors is also highlighted. H. Lollipop charts showing the Log2 FC of acetylated (K-Ac) and ubiquitylated sites (K-GG) between tumors and NATs (Hyper: log2(FC)>1 or Hypo: <−1, FDR<0.01). The upper panel shows specific sites that were hyper-ubiquitylated and hypoacetylated in tumors; the lower panel shows specific sites that were hyperacetylated and hypo-ubiquitylated in tumors. Dot colors indicate protein fold change between tumors and NATs. “k” represents modified lysine. I. Relative abundances of RAN K127 acetylation (K-Ac), ubiquitylation (K-GG) and RAN protein levels across NMF subtypes and NATs. Wilcoxon p-values are indicated above; ns represents p>0.05. See also Figure S5 and Table S5
Figure 6:
Figure 6:. Immune Landscape of LSCC
A. Heatmaps illustrate cell type compositions and activities of selected individual genes/proteins and pathways across the four immune clusters: Hot, Warm, and Cold tumor and NAT-enriched. Successive heatmaps illustrate xCell immune signatures, mRNA and protein expression of key immune-related markers, and ssGSEA pathway scores based on global proteomic data for biological pathways that were differentially regulated in immune groups based on both mRNA and global protein abundance (Common) or on global protein abundance alone (Proteomics only). B. Pathway scores of key pathways differentially expressed across the immune clusters. Wilcoxon p-values for the individual comparisons are provided on top. C. Contour plot of two-dimensional density based on Macrophage (x-axis) and CD8 T-cell scores (y-axis) showing the variation in these cell types’ distributions observed across the different immune clusters. D. Acetylsites differentially expressed between Hot and Cold tumors. Acetylsites of genes contained in the Hallmark Oxidative Phosphorylation pathway are highlighted in blue, ARHGDIB K135 is highlighted in red, and remaining sites are in gray. Darker color designates significant sites (FDR < 0.1). E. Regulation of Rho GTPase signaling including K135 acetylation of ARHGDIB. F. Global protein abundance of RAC2, DOCK2 and ELMO1, acetylproteome abundance of ARHGDIB K135k and phosphorylation abundance of ARHGEF6 at Serine 225 in immune clusters. Wilcoxon p-values are reported. G. RTK CBPE scores for 108 tumor samples and associated xCell signatures and pathway scores. The first heatmap shows CBPE scores of key RTKs, the second xCell signatures (Aran et al., 2017) and the third pathway scores based on global protein abundance. H. Distribution of RTK CBPE scores for CSF1R, PDGFRB and FGFR2 stratified by immune clusters. Significance values (two-sided Wilcoxon test) between Hot clusters and combined Warm and Cold clusters are indicated on the violin plots. I. Heatmap showing proteins and phosphosites correlated with CSF1R CBPE scores that are known to be involved in immune evasion. See also Figure S6 and Table S6
Figure 7:
Figure 7:. Proteomic Features Related to Diagnosis, Prognosis, or Treatment
A. Differentially expressed proteins between tumors and NATs. B. Significantly increased proteins (larger font indicates >4 fold) in the study LSCC cohort that are associated with poor overall survival (OS) or disease-free survival (DFS) in the TCGA LSCC cohort mRNA. C. Genetic dependencies of 502 proteins (log2 FC >2, FDR<0.01 and NAs <50%) in LSCC cell lines (n=16) profiled as part of the Achilles Dependency-Map project. D. Genes, ordered by their chromosomal location, that are deleted in at least 25% of the samples and significantly correlated to the immune score. Immune-related genes are highlighted. E. EGFR protein and tyrosine phosphorylation levels compared to EGFR copy number and an EGFR activity score (PROGENy). F. Heatmap showing Pearson correlation between the EGFR activity score represented by PROGENy (top) and RNA expression of EGFR ligands. *p<0.05 G. GO Biological Process enrichment for proteins with increased phosphorylation in EGFR amplified samples compared to non-amplified samples. H. Summary roadmap figure partitioned into five major categories, indicated by different colors. See also Figure S7 and Table S7

References

    1. Abril-Rodriguez G, and Ribas A (2017). SnapShot: Immune Checkpoint Inhibitors. Cancer Cell 31, 848–848.e1. - PubMed
    1. Ahn ER, Mangat PK, Garrett-Mayer E, Halabi S, Dib EG, Haggstrom DE, Alguire KB, Calfa CJ, Cannon TL, Crilley PA, et al. (2020). Palbociclib in Patients With Non–Small-Cell Lung Cancer With CDKN2A Alterations: Results From the Targeted Agent and Profiling Utilization Registry Study. JCO Precision Oncology 757–766. - PubMed
    1. Albert M, Bécares M, Falqui M, Fernández-Lozano C, and Guerra S (2018). ISG15, a Small Molecule with Huge Implications: Regulation of Mitochondrial Homeostasis. Viruses 10. - PMC - PubMed
    1. Alcalá S, Sancho P, Martinelli P, Navarro D, Pedrero C, Martín-Hijano L, Valle S, Earl J, Rodríguez-Serrano M, Ruiz-Cañas L, et al. (2020). ISG15 and ISGylation is required for pancreatic cancer stem cell mitophagy and metabolic plasticity. Nat. Commun. 11, 2682. - PMC - PubMed
    1. Almeida LG, Sakabe NJ, deOliveira AR, Silva MCC, Mundstein AS, Cohen T, Chen Y-T, Chua R, Gurung S, Gnjatic S, et al. (2009). CTdatabase: a knowledge-base of high-throughput and curated data on cancer-testis antigens. Nucleic Acids Res. 37, D816–D819. - PMC - PubMed

Publication types

MeSH terms

Substances